Inspiration
A 911 center only reviews monthly averages of ambulance response times, which hide a zone that has been slow for a week. (Prompt: Health Systems – Emergency Response.)
What it does
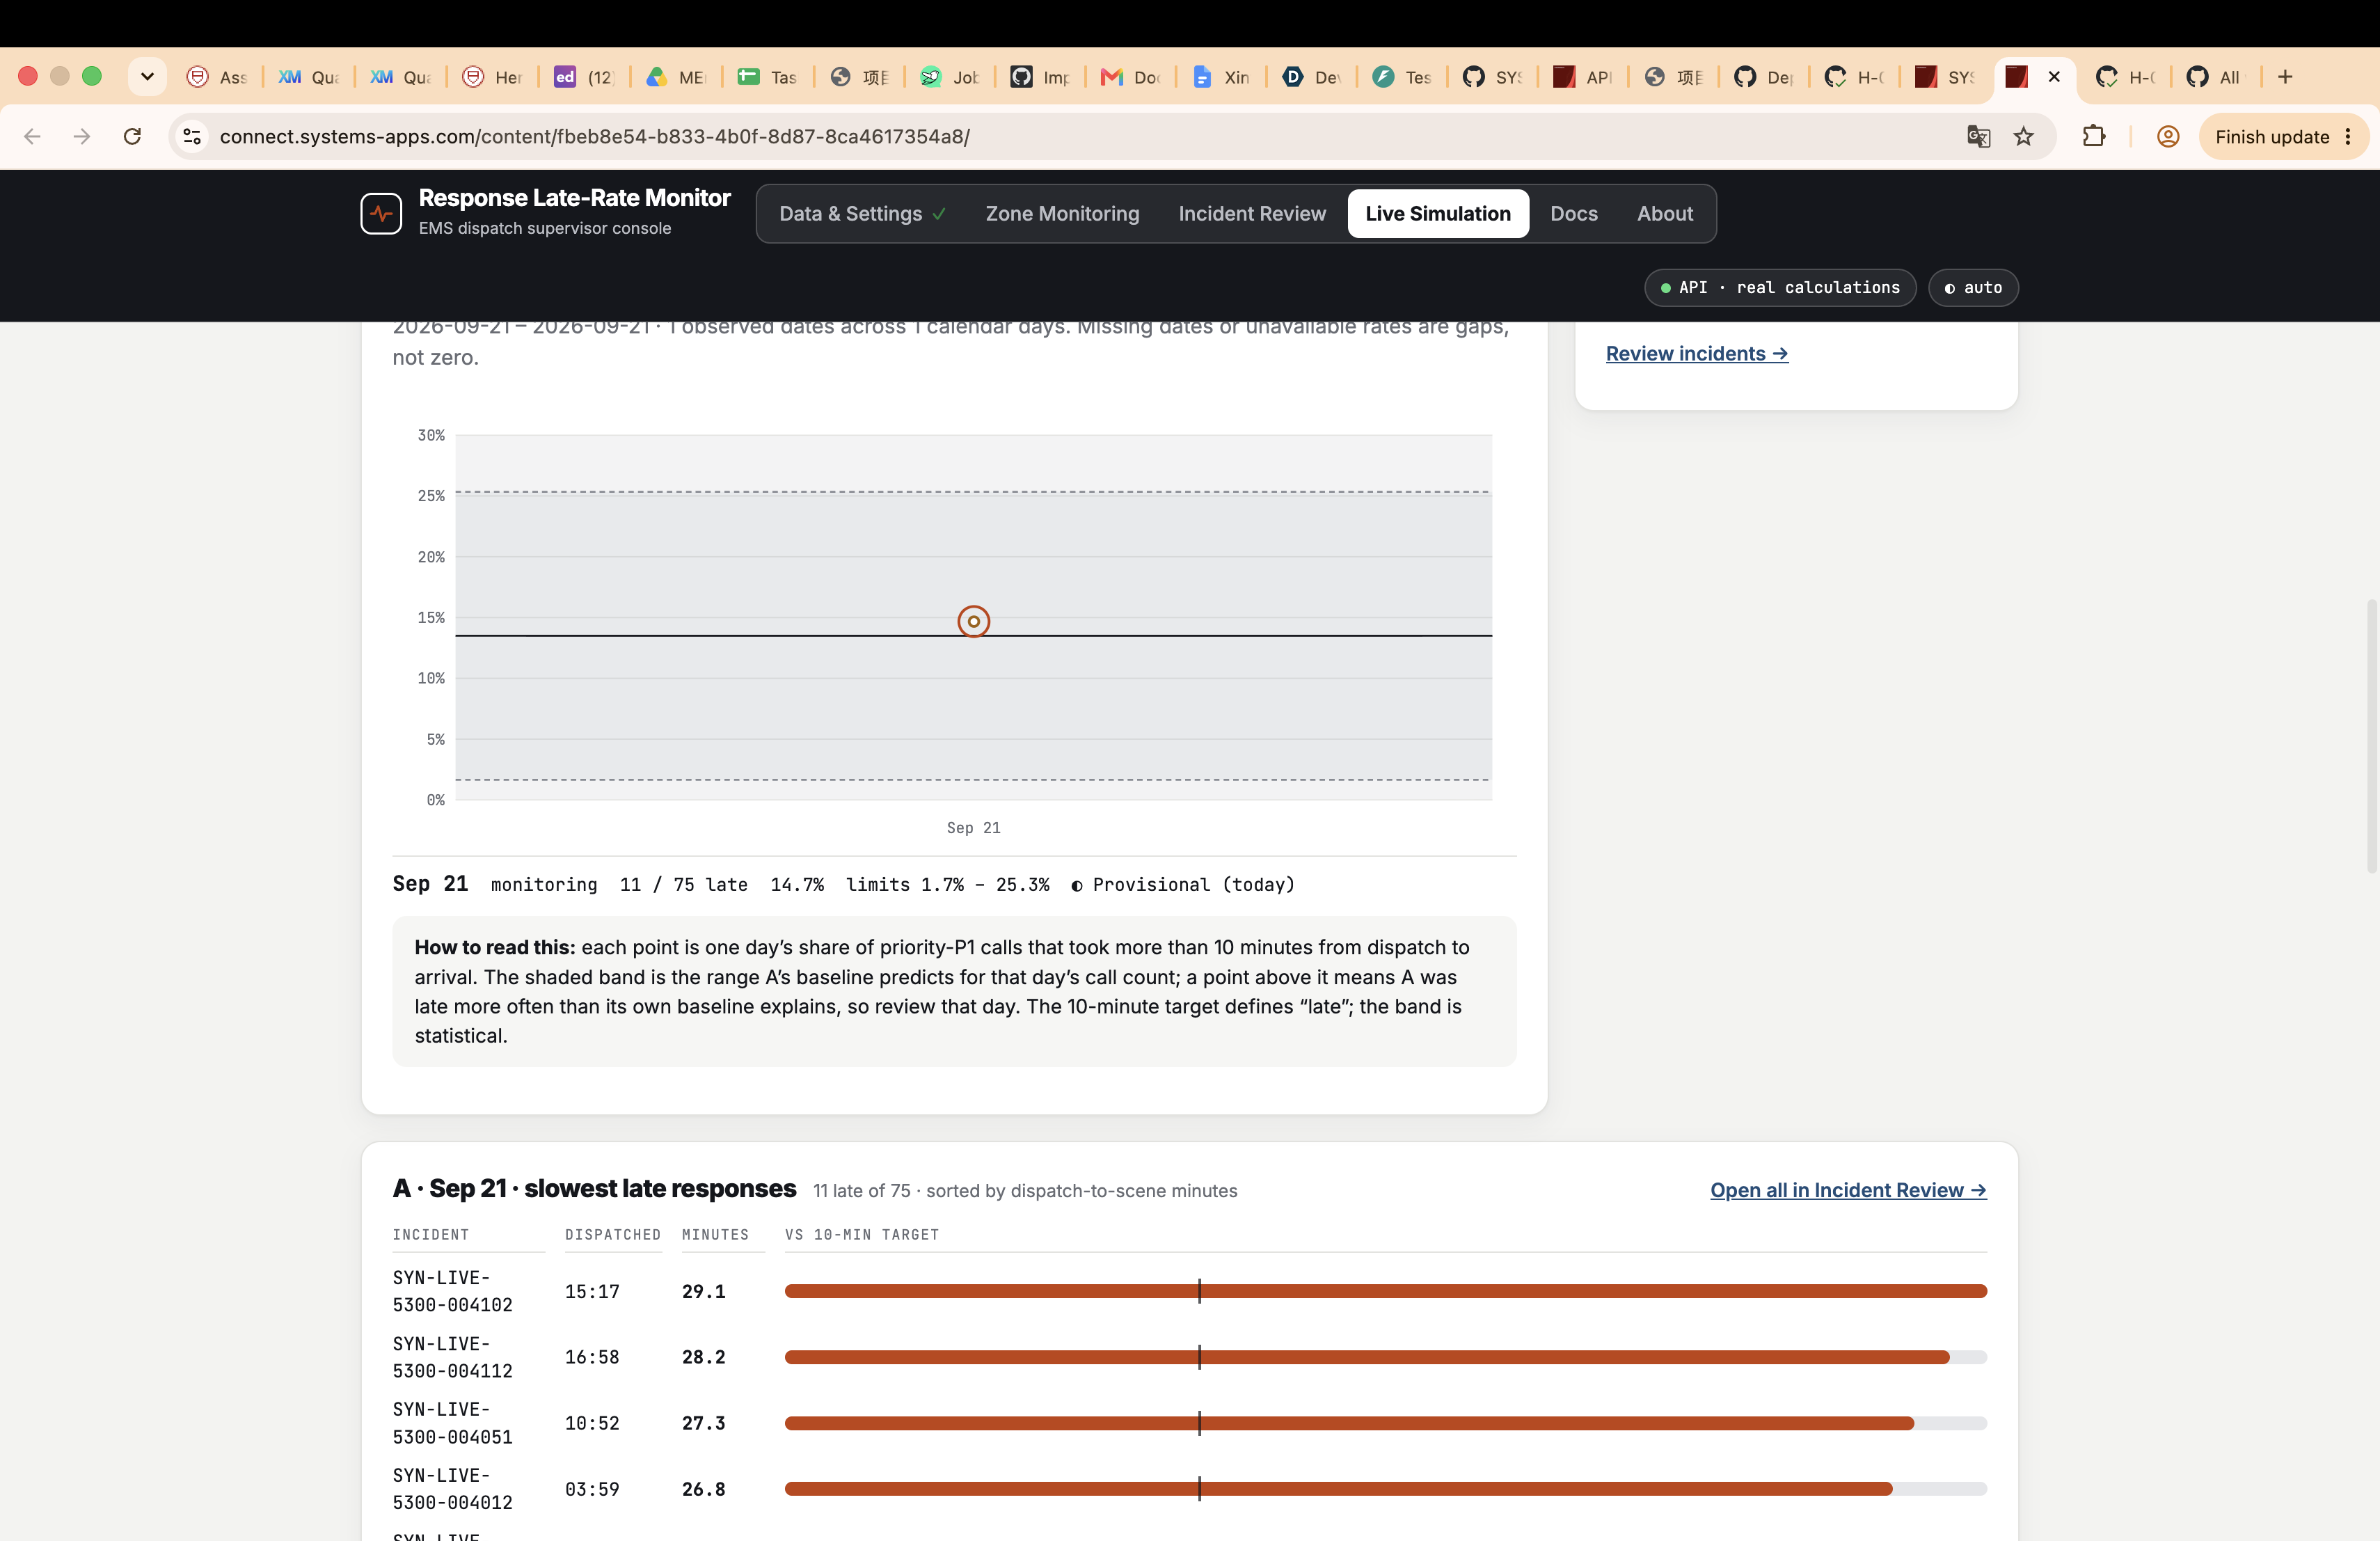
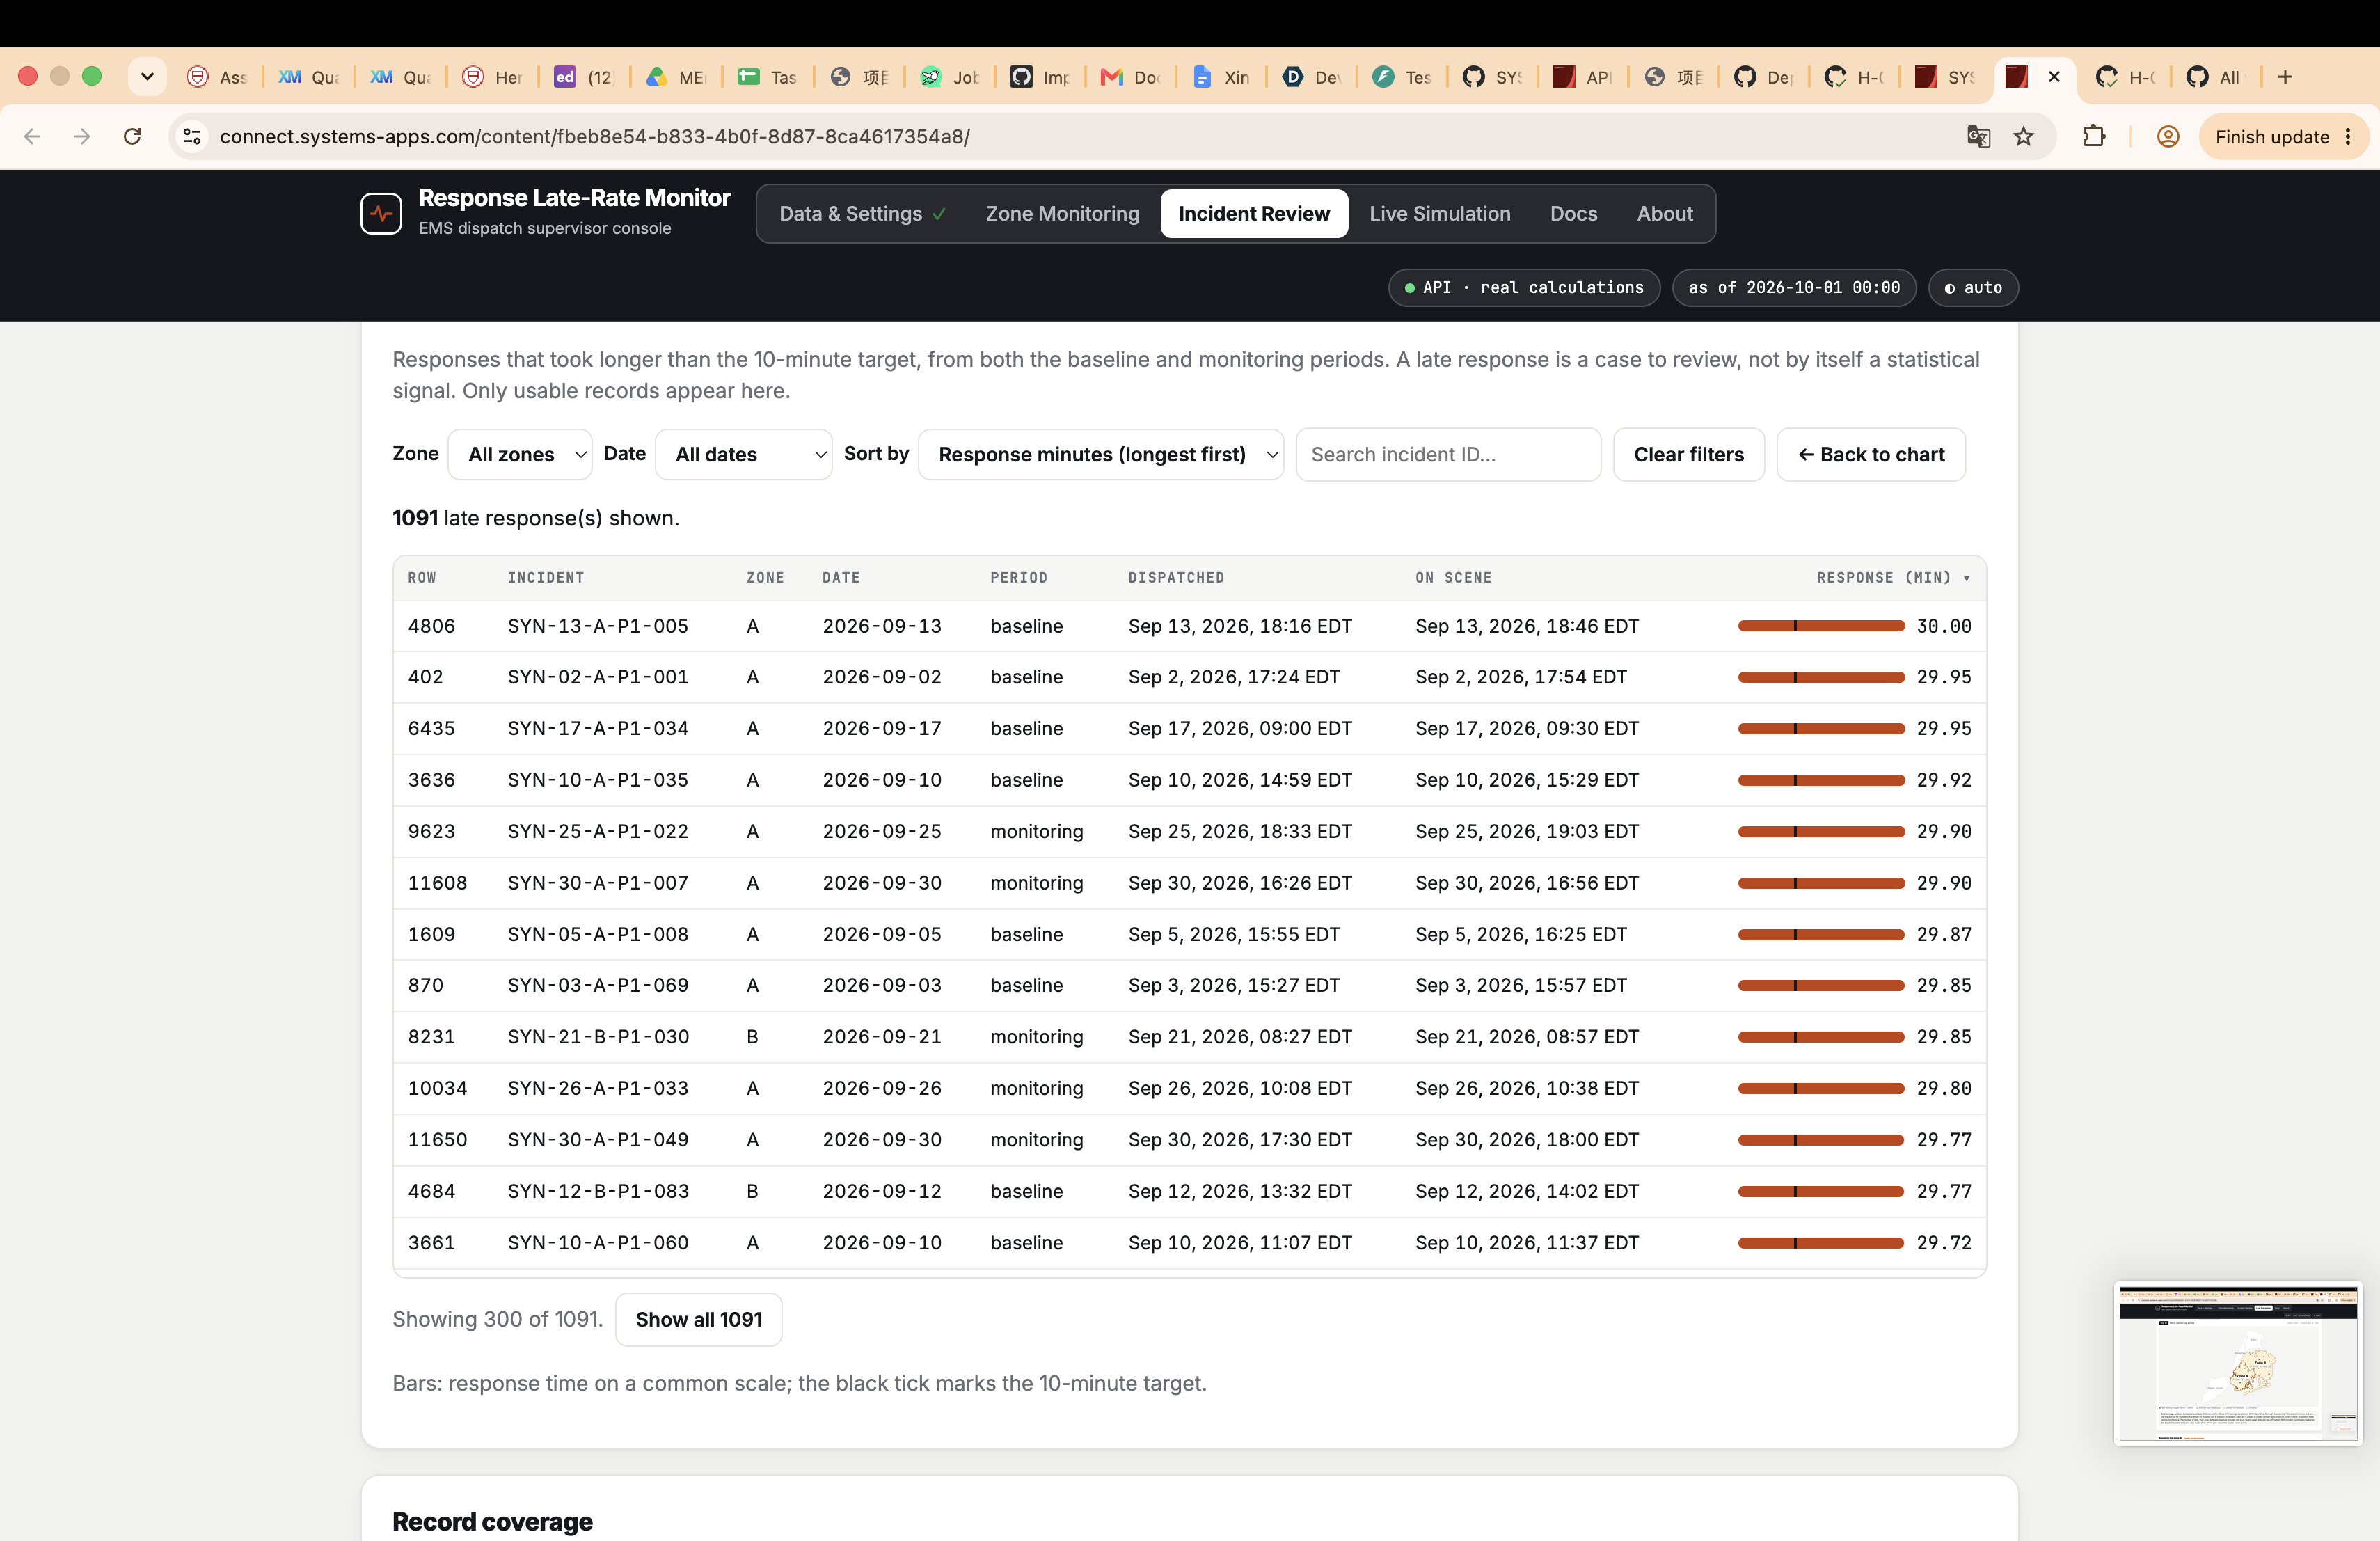
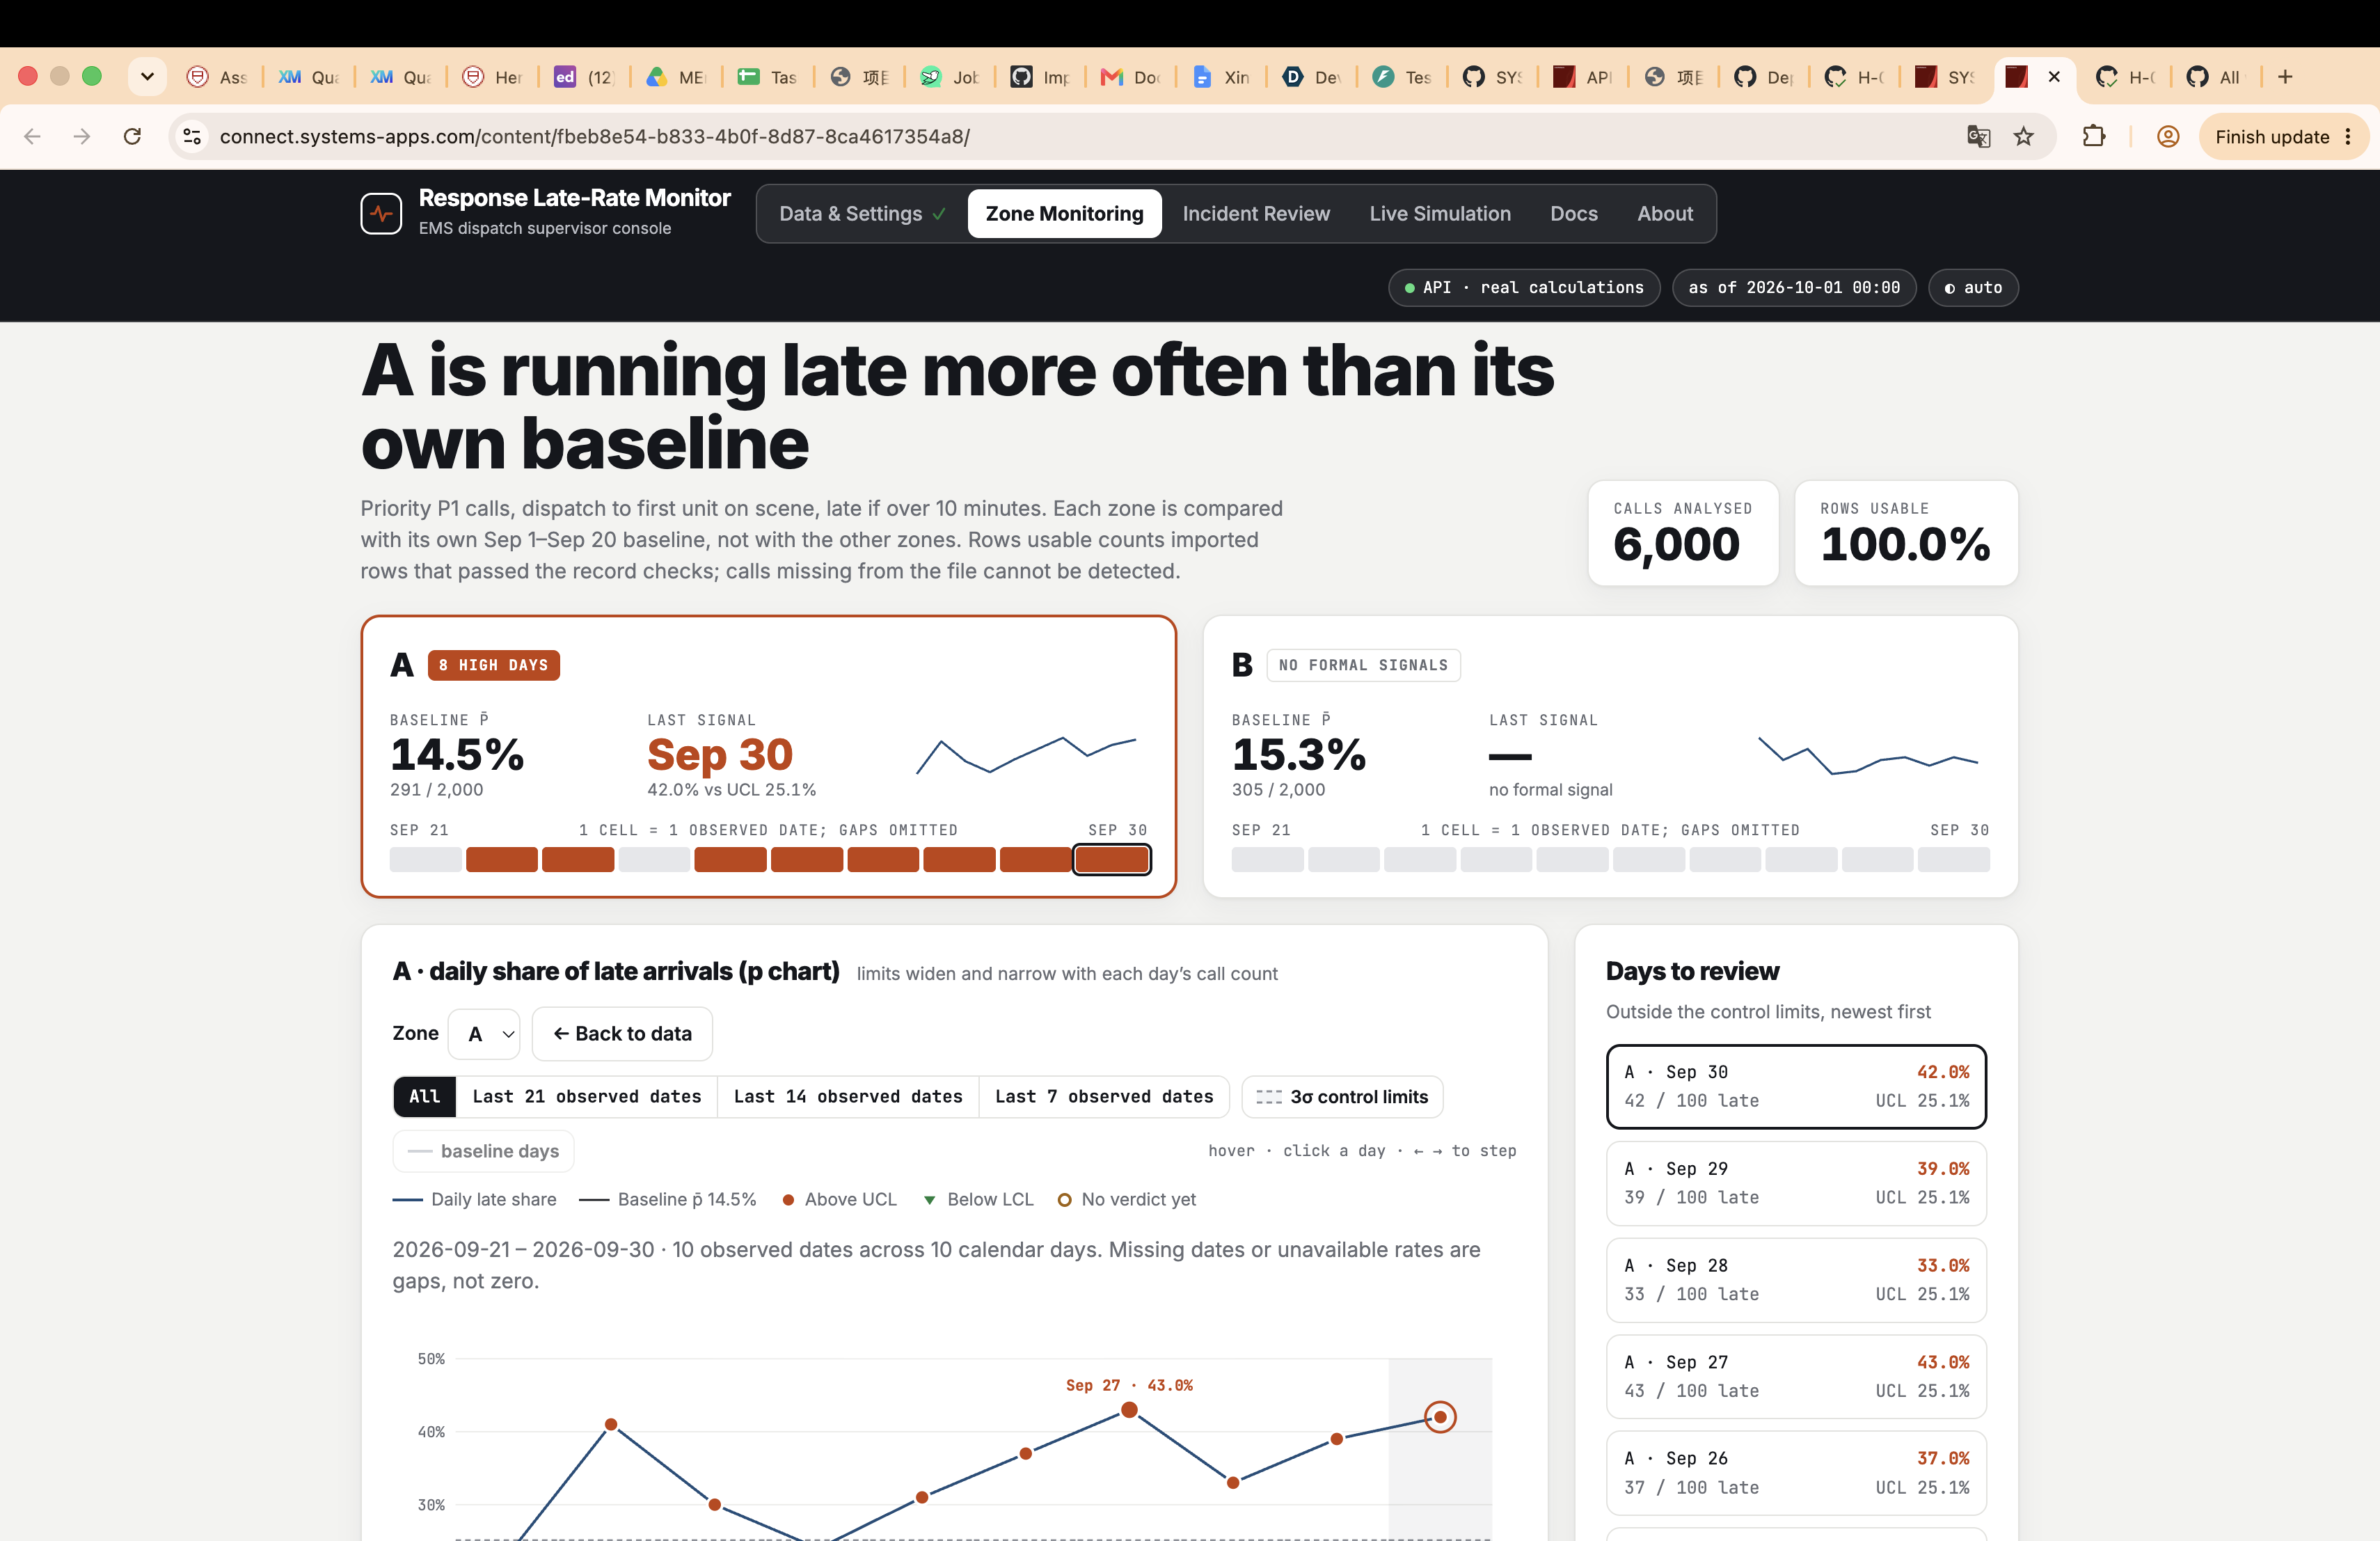
For the EMS dispatch supervisor: a daily p chart per zone that flags days when a zone is late (> 10 min) more often than its own baseline, plus a list of the late calls to review. Inputs are 5 fields every dispatch system logs: incident_id, zone, priority, dispatched_at, on_scene_at.
How it works
Baseline $$\bar p = \frac{\sum late}{\sum n}$$ Daily limits $$\bar p \pm 3\sqrt{\bar p(1-\bar p)/n}$$ No verdict until 20+ baseline days, \(n\bar p \ge 5\), the day is closed and the supervisor confirms the baseline. Bad rows are excluded with reasons, never counted as 0 minutes.
Results
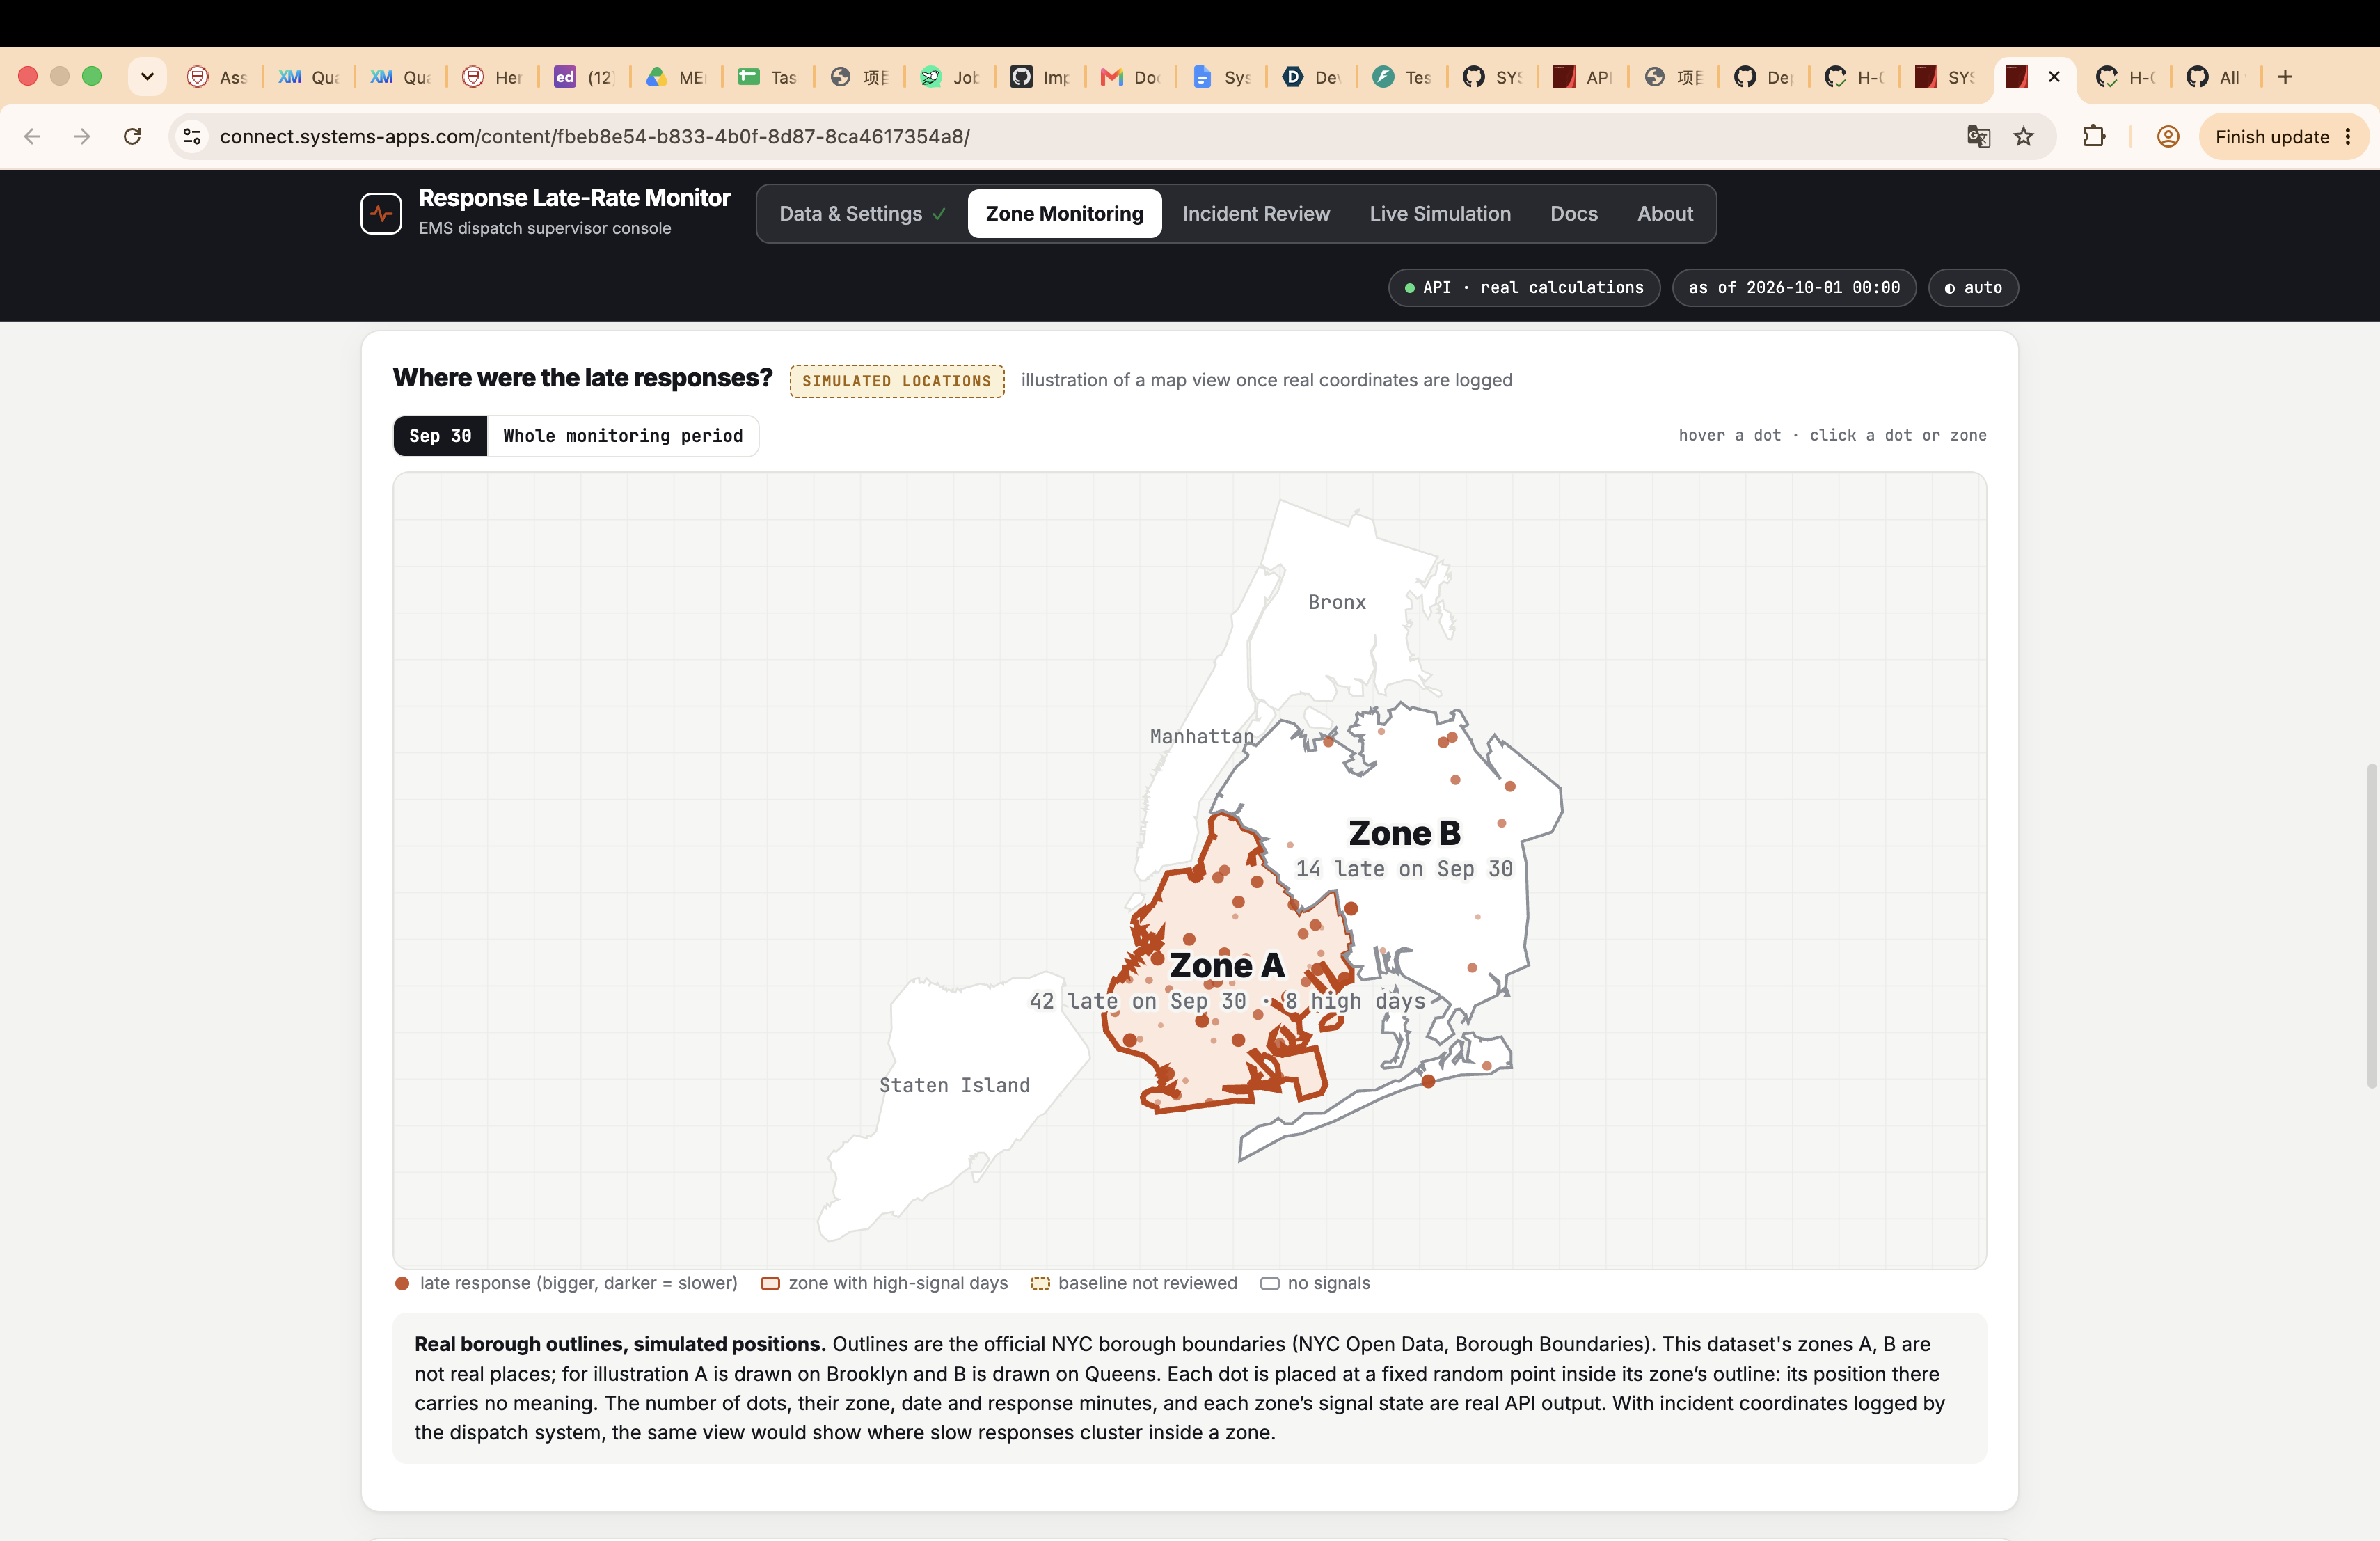
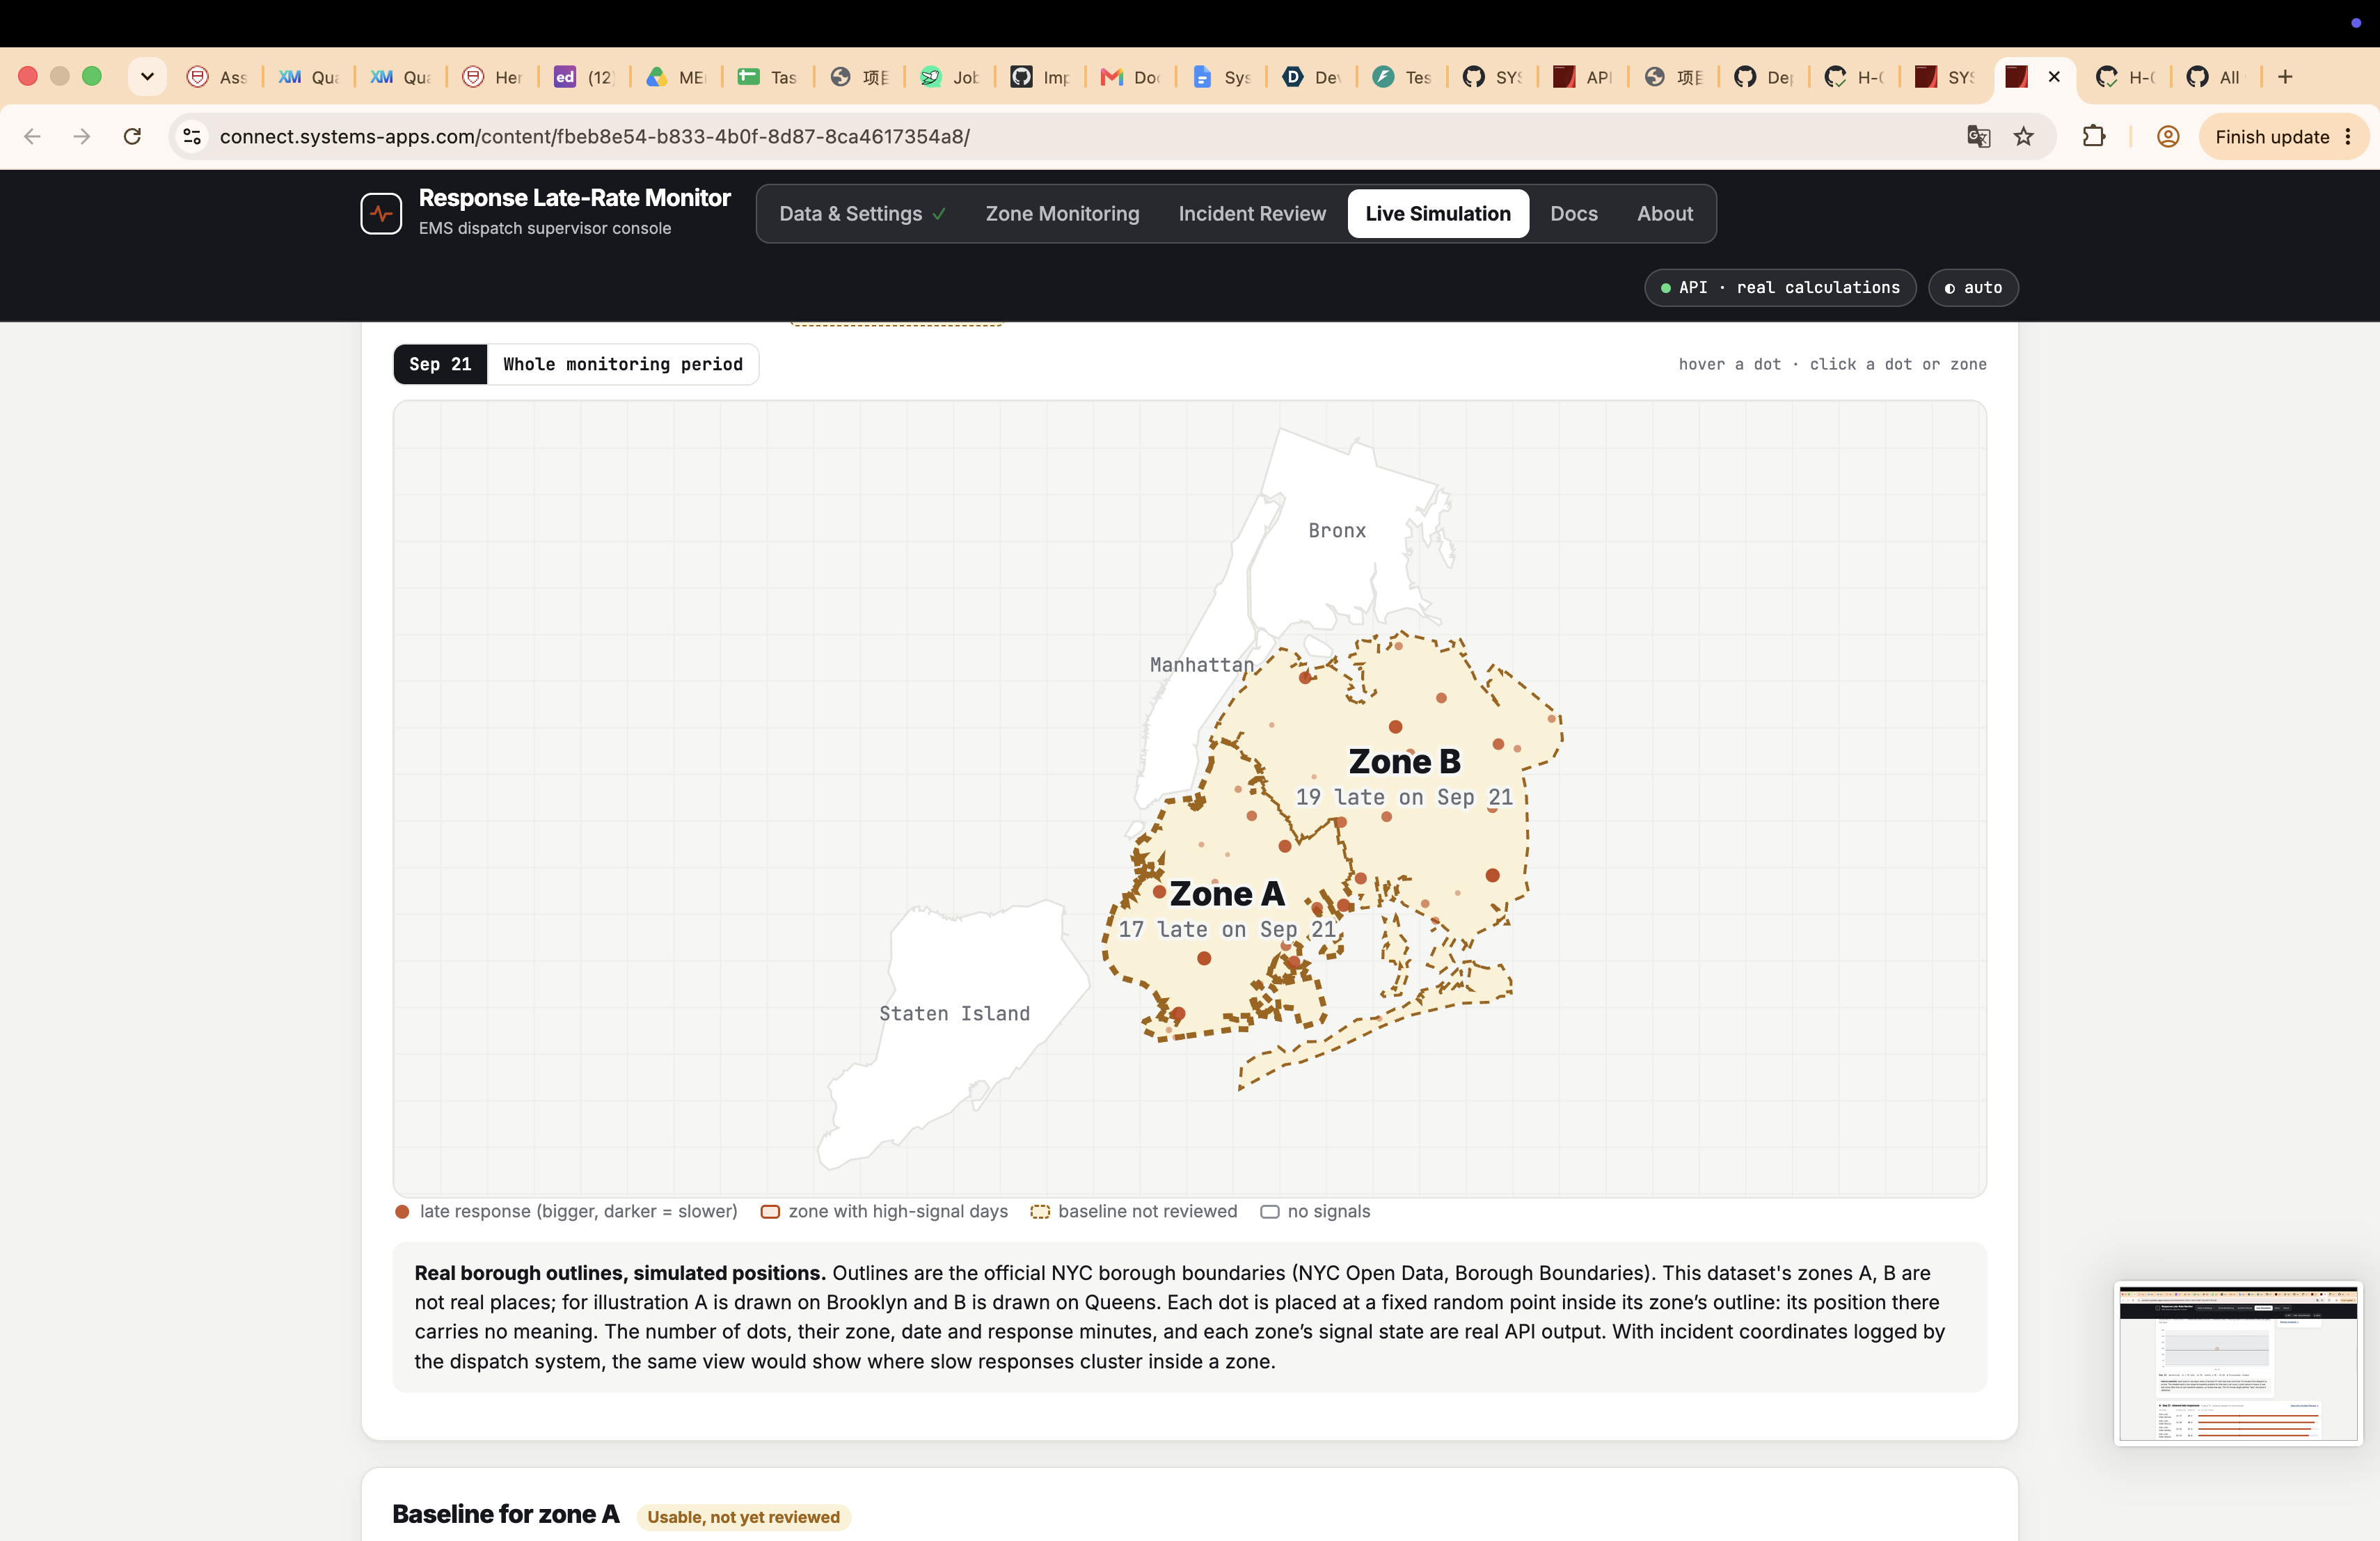
Planted shift: zone A 8 high days, control 0. Stable data: 0 signals. Real NYC FDNY data (26,209 calls): Brooklyn 6 high days in September.
How we built it
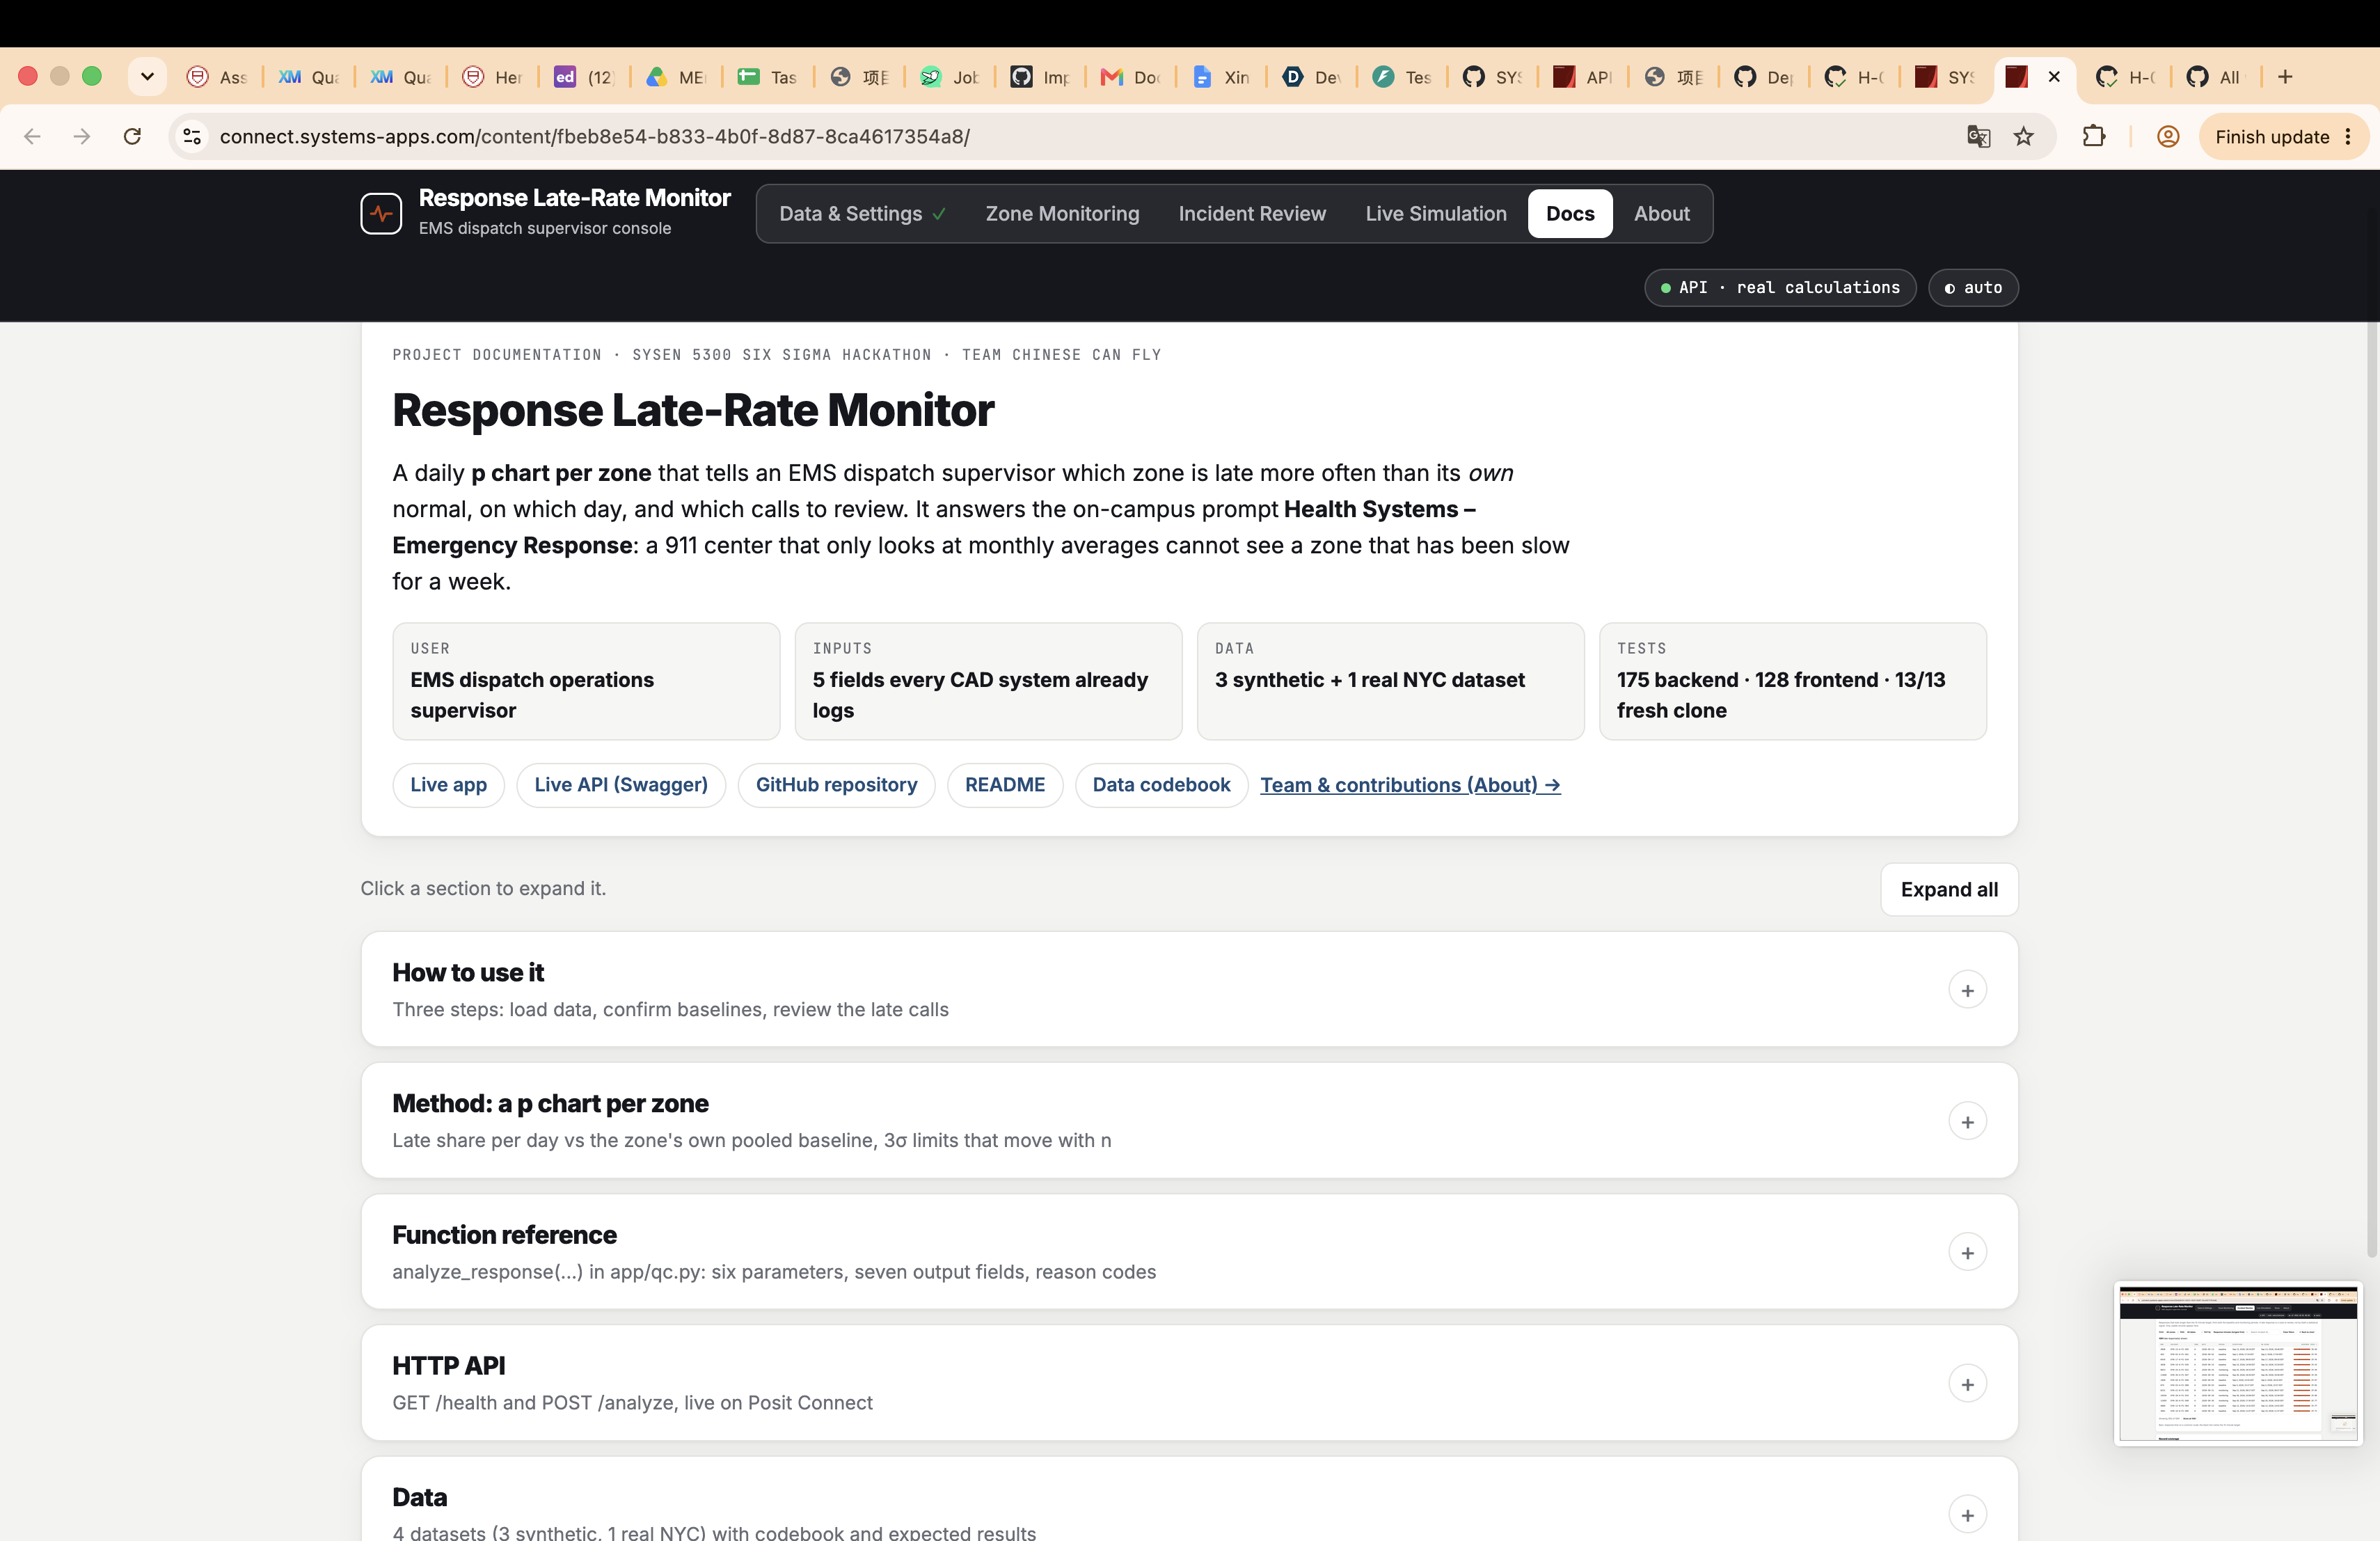
Python core (app/qc.py) → FastAPI → React, deployed on Posit Connect via GitHub Actions. 175 backend + 128 frontend tests.
Limitations
Assumes a stable baseline and independent calls; large n can cause overdispersion (next step: Laney p′). A signal says when and where, not why.


Log in or sign up for Devpost to join the conversation.