-
-
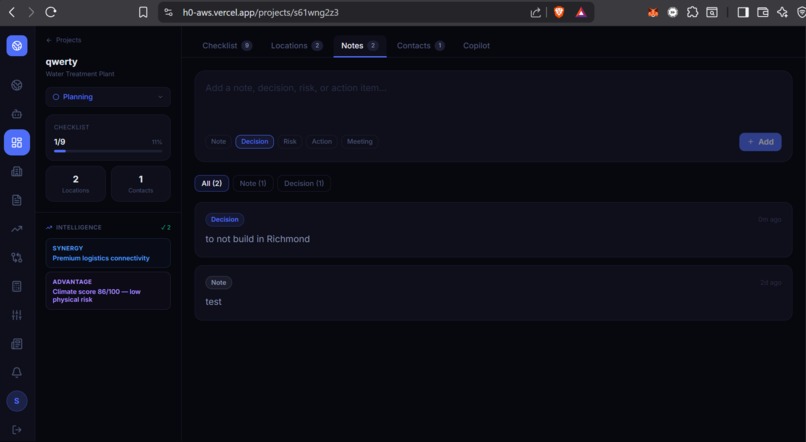
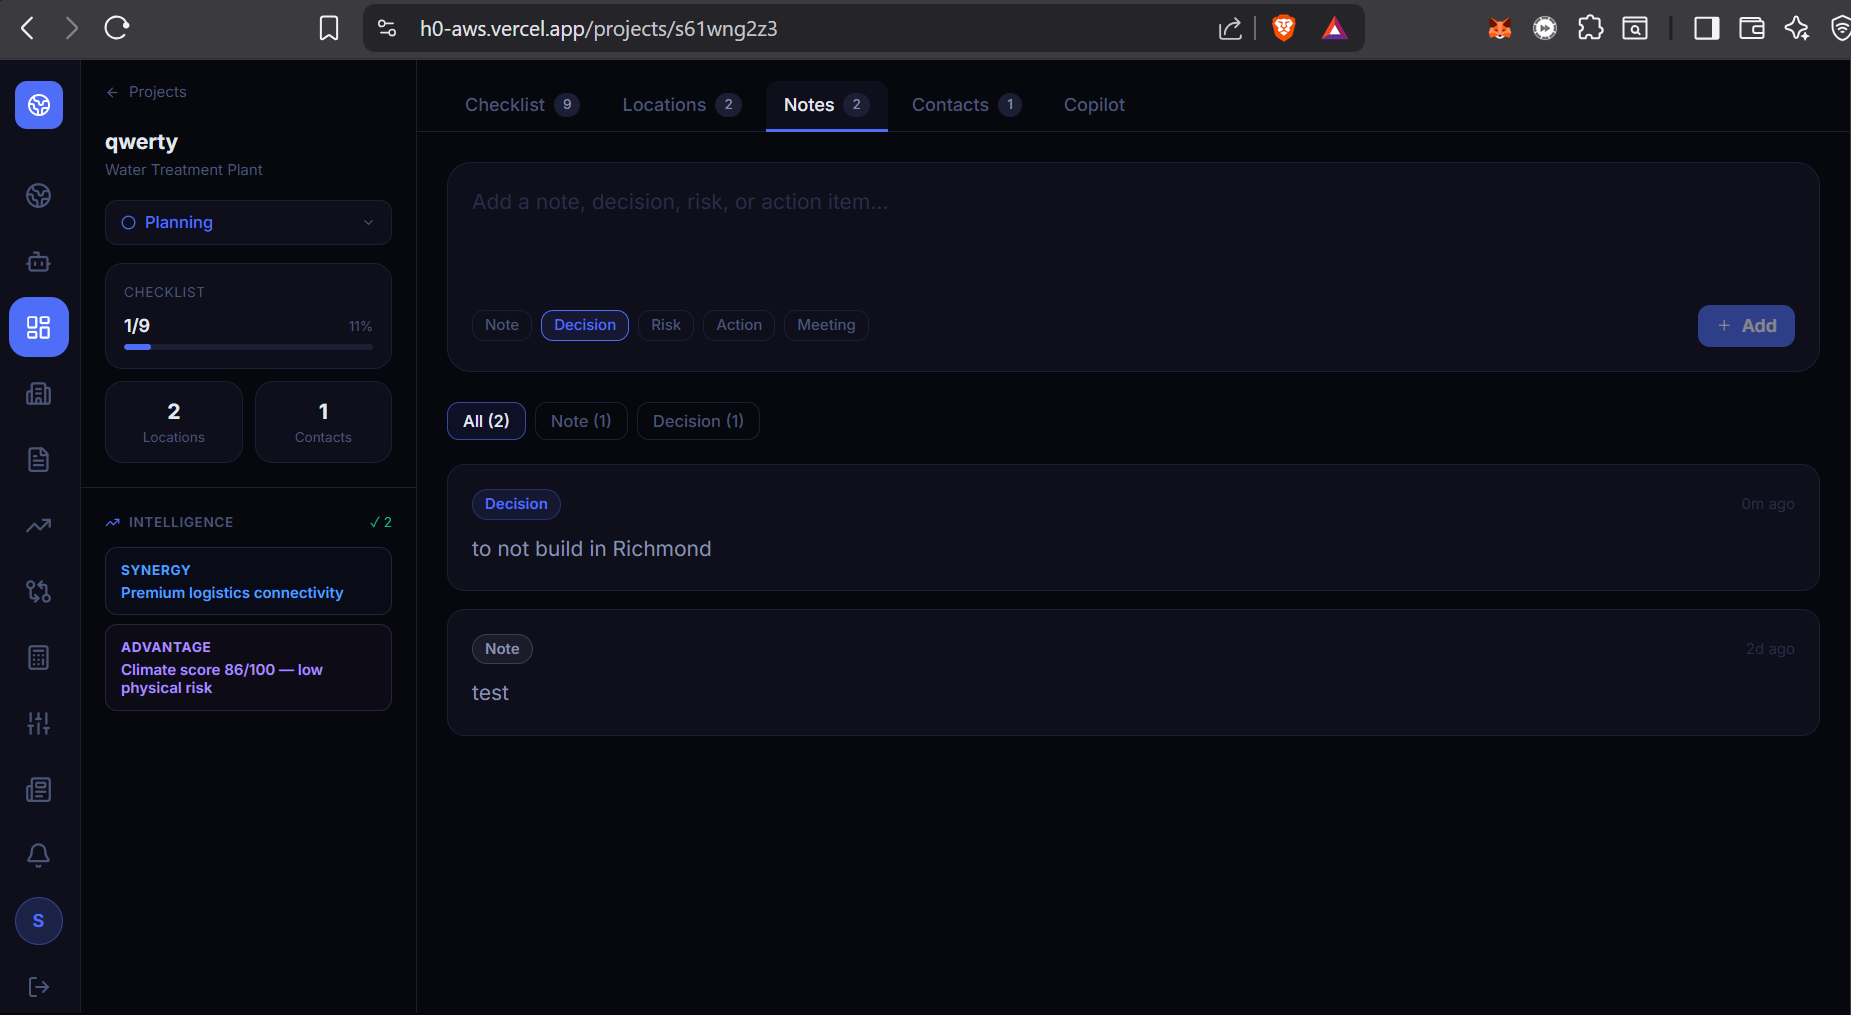
notes and team management
-
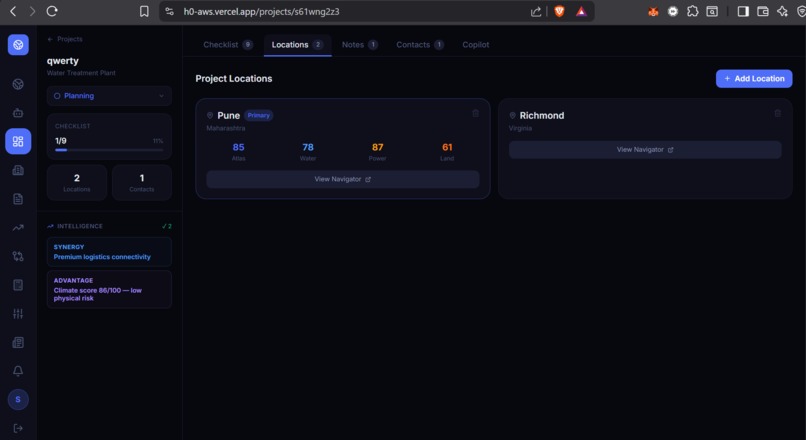
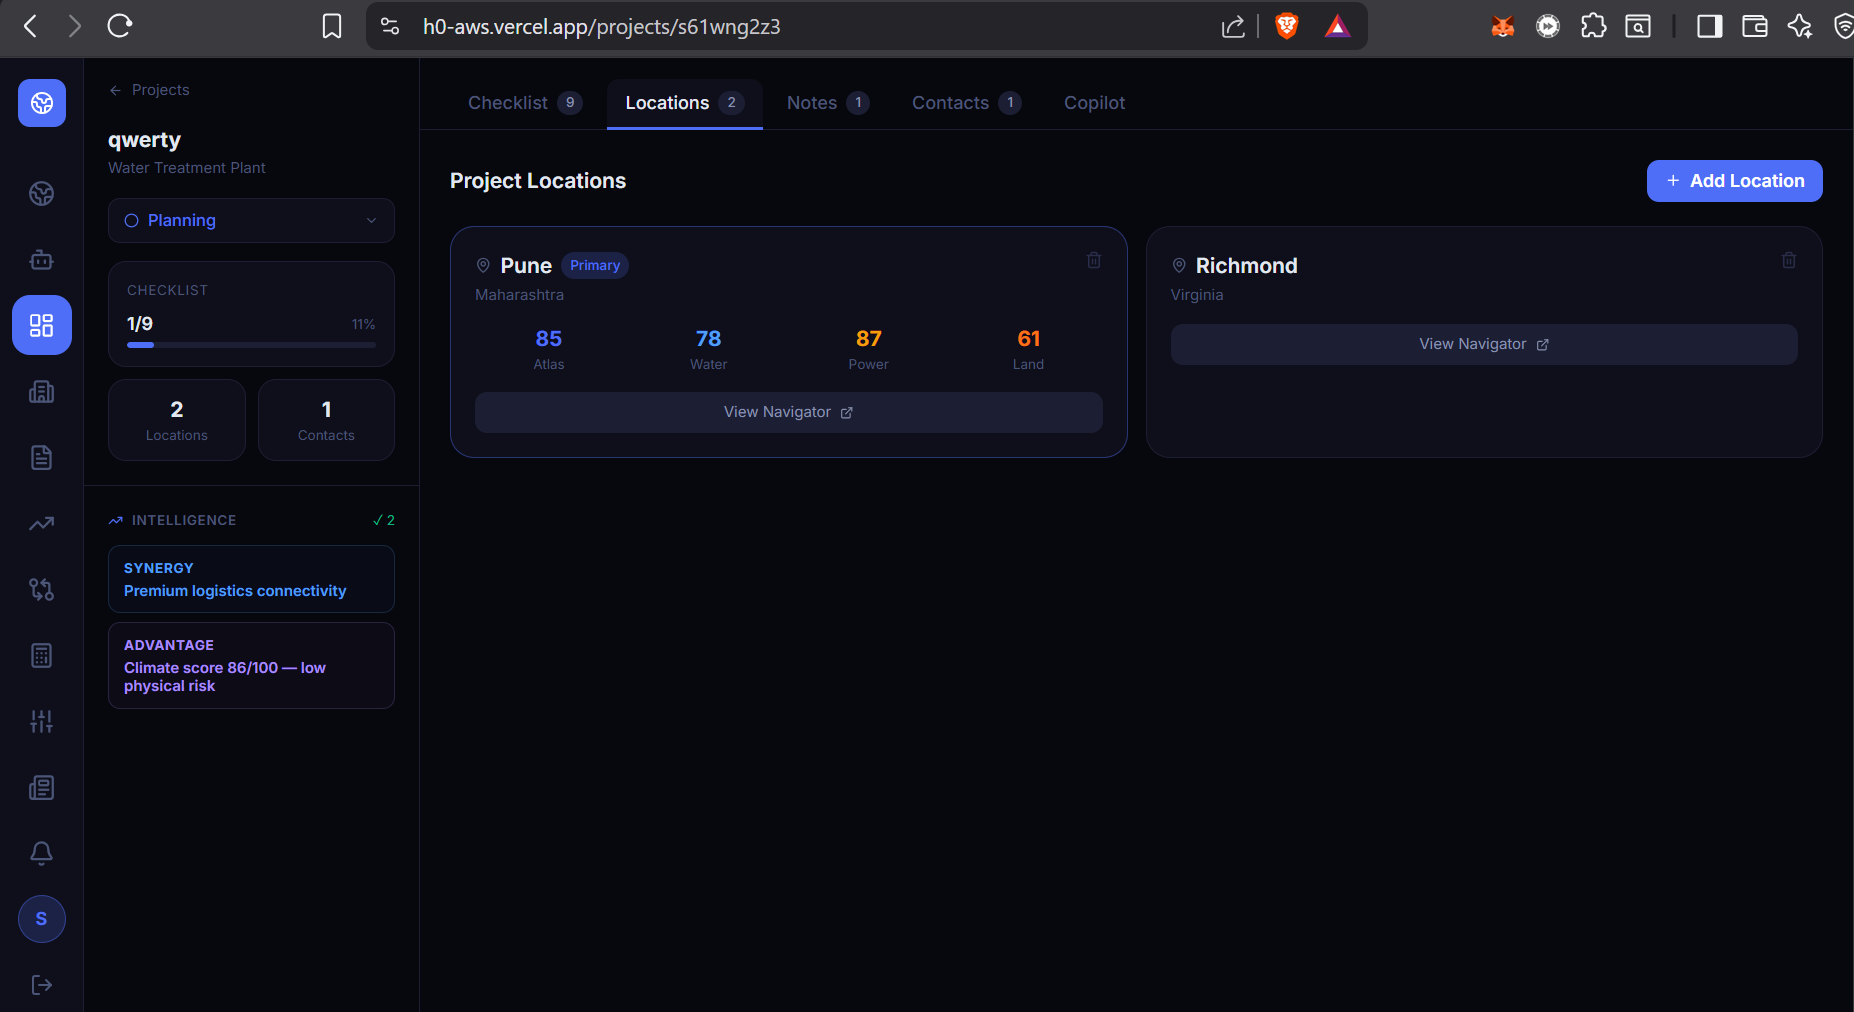
Project management
-
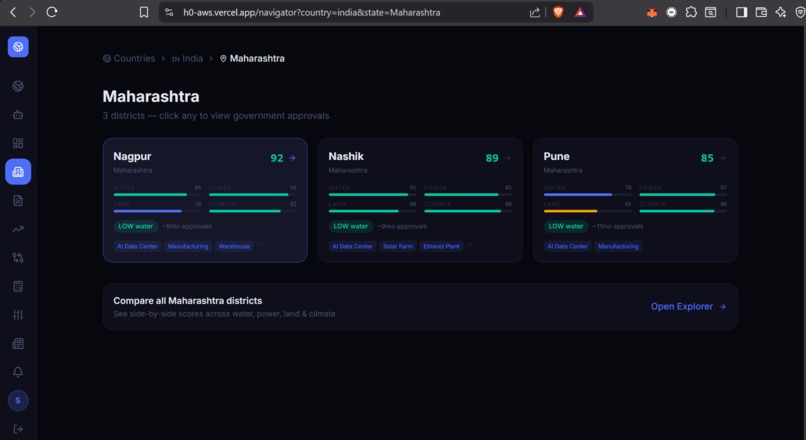
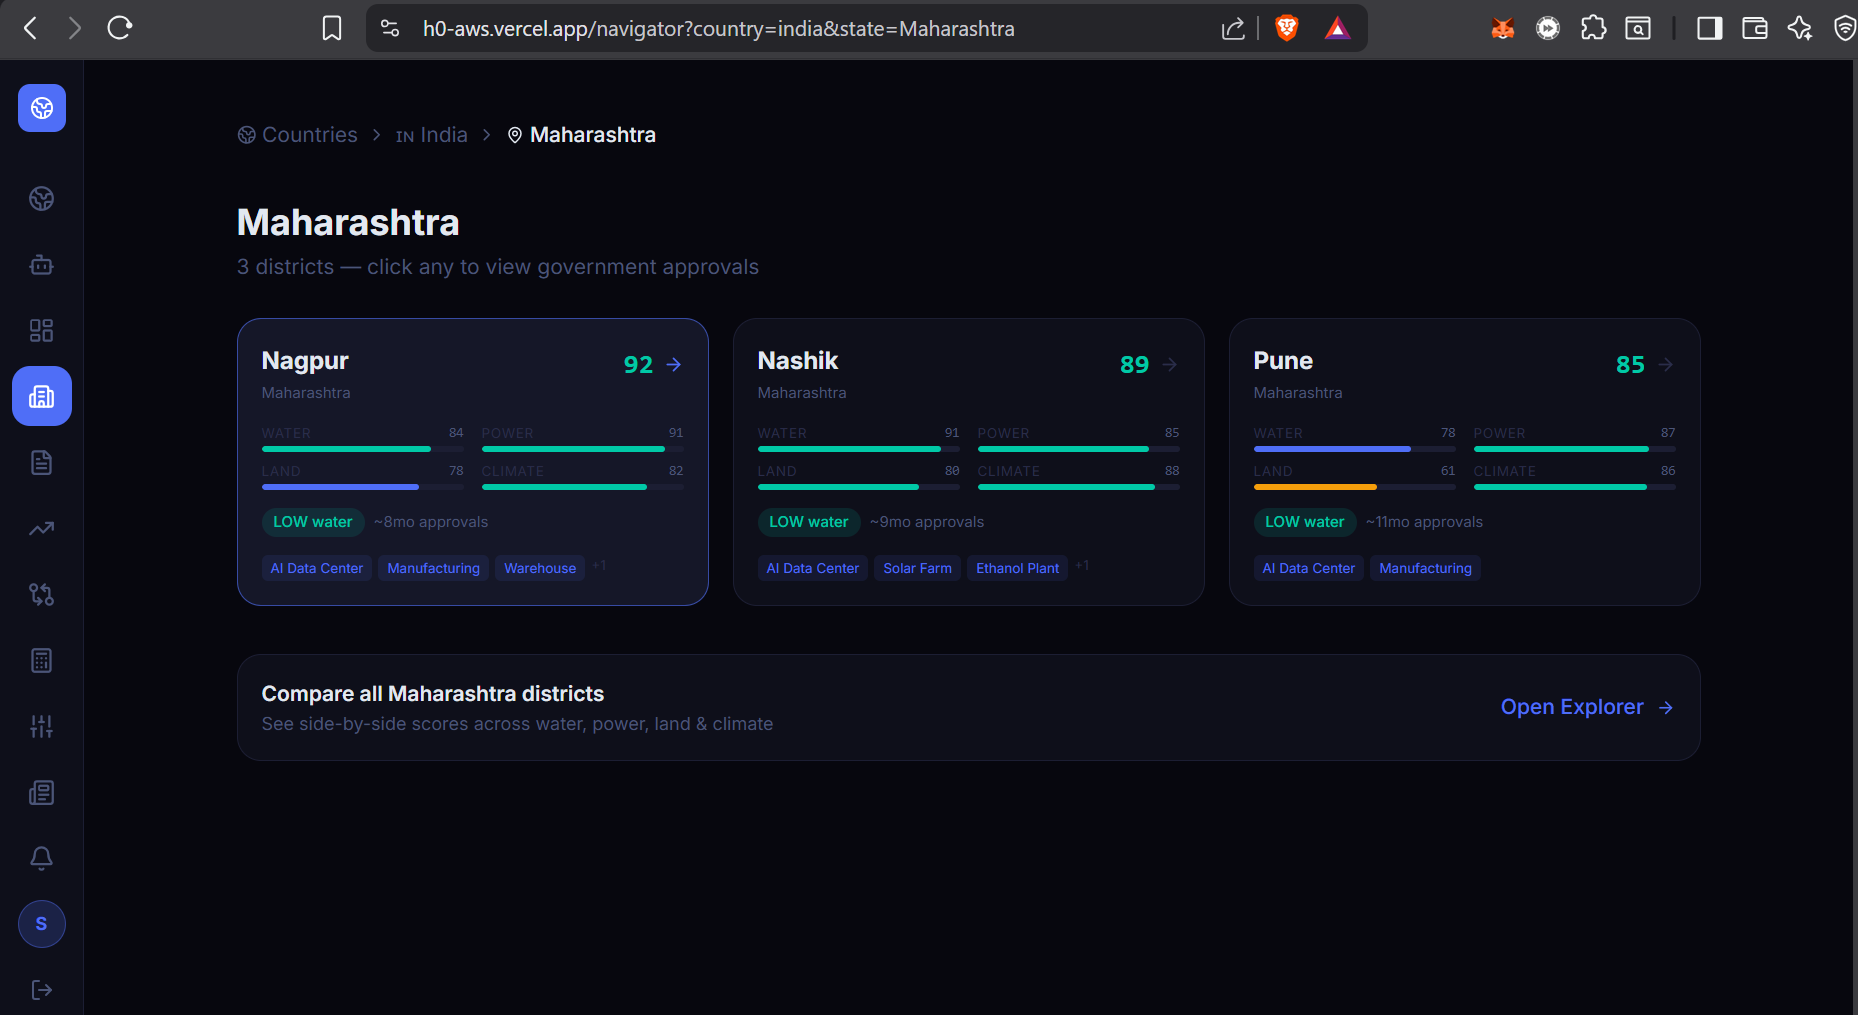
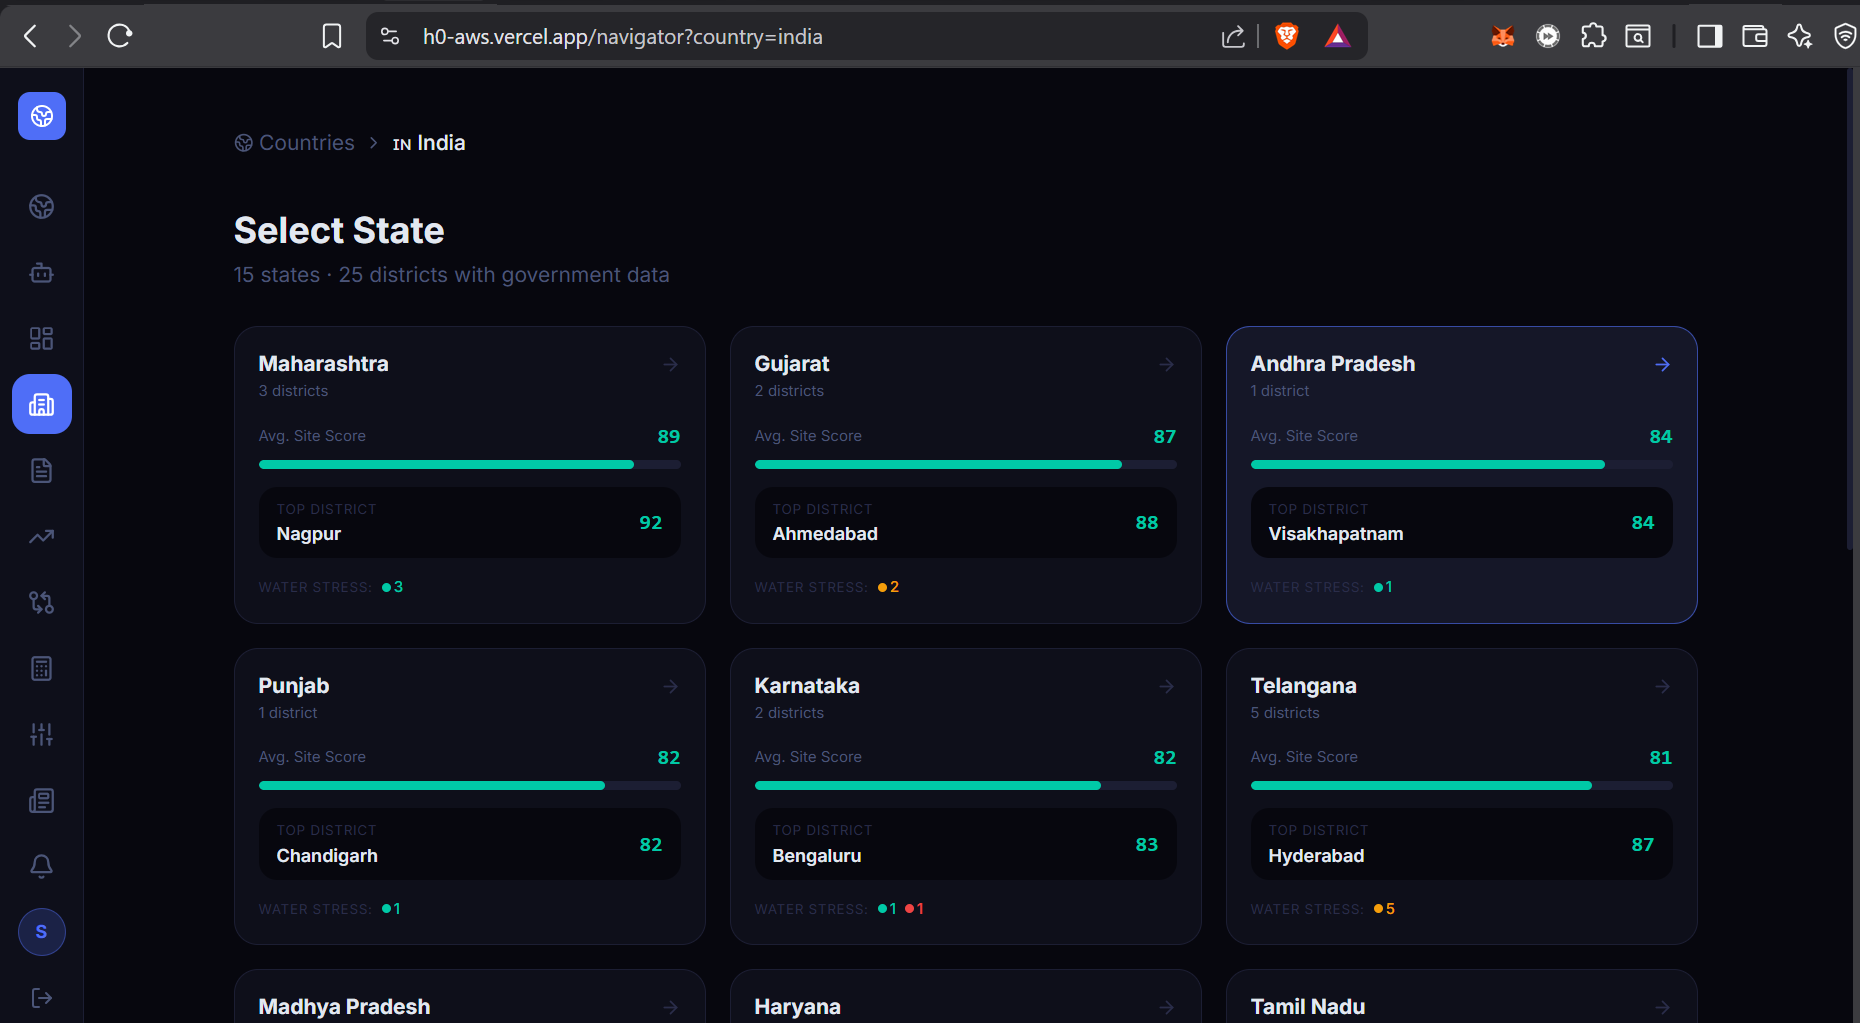
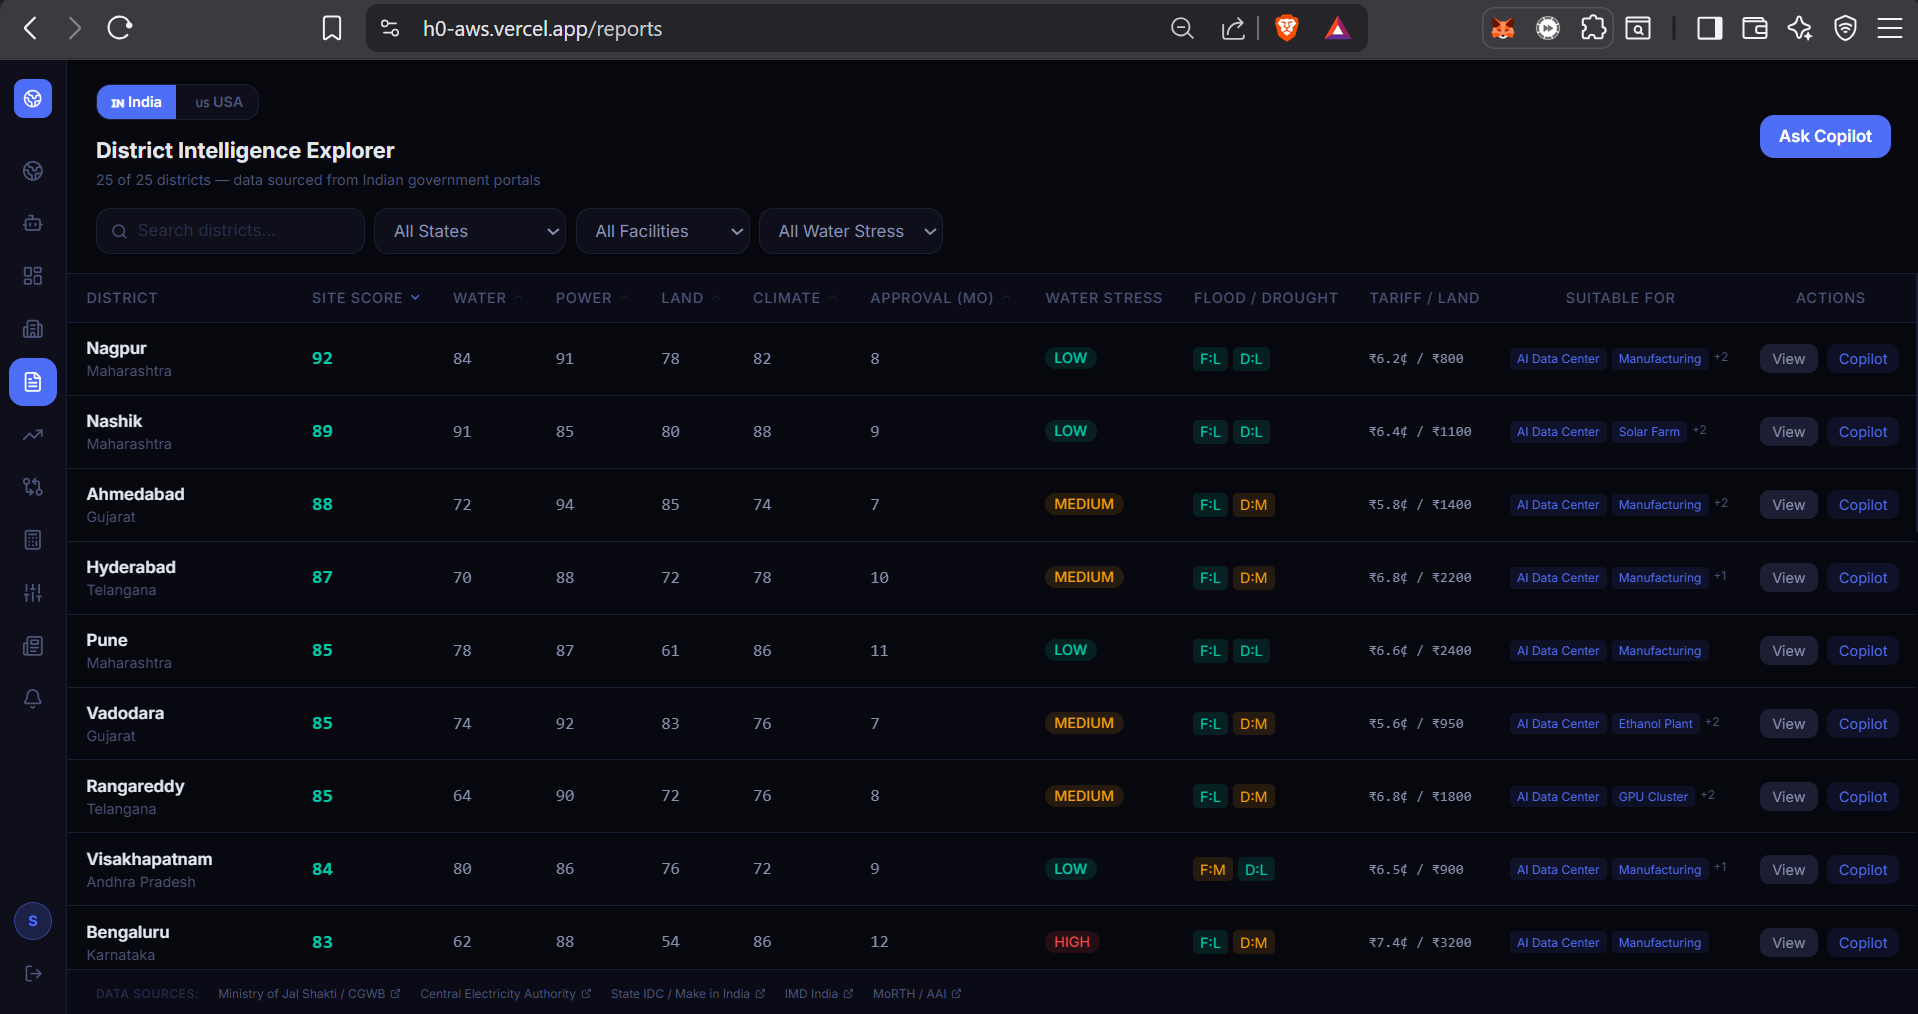
Information show of all extracted data - district wise
-
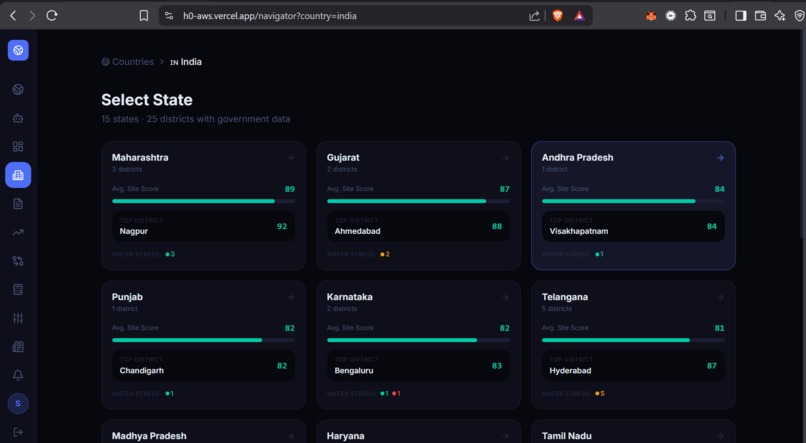
All locations
-
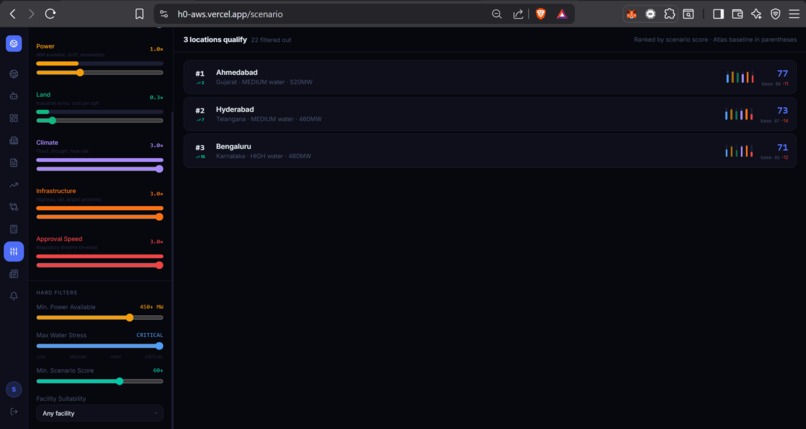
All district filter
-
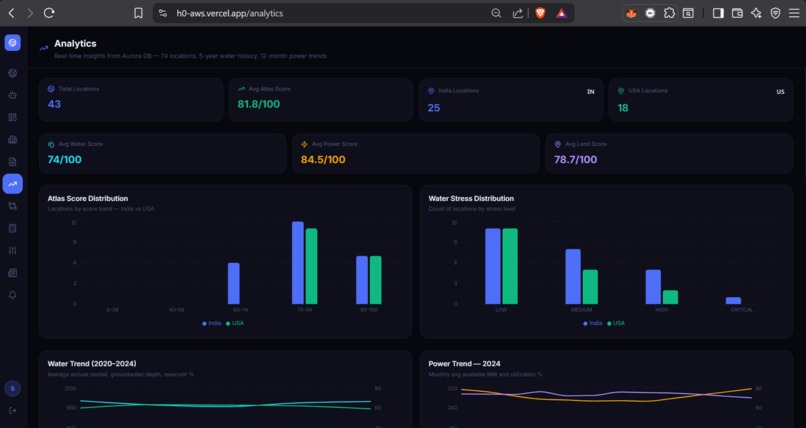
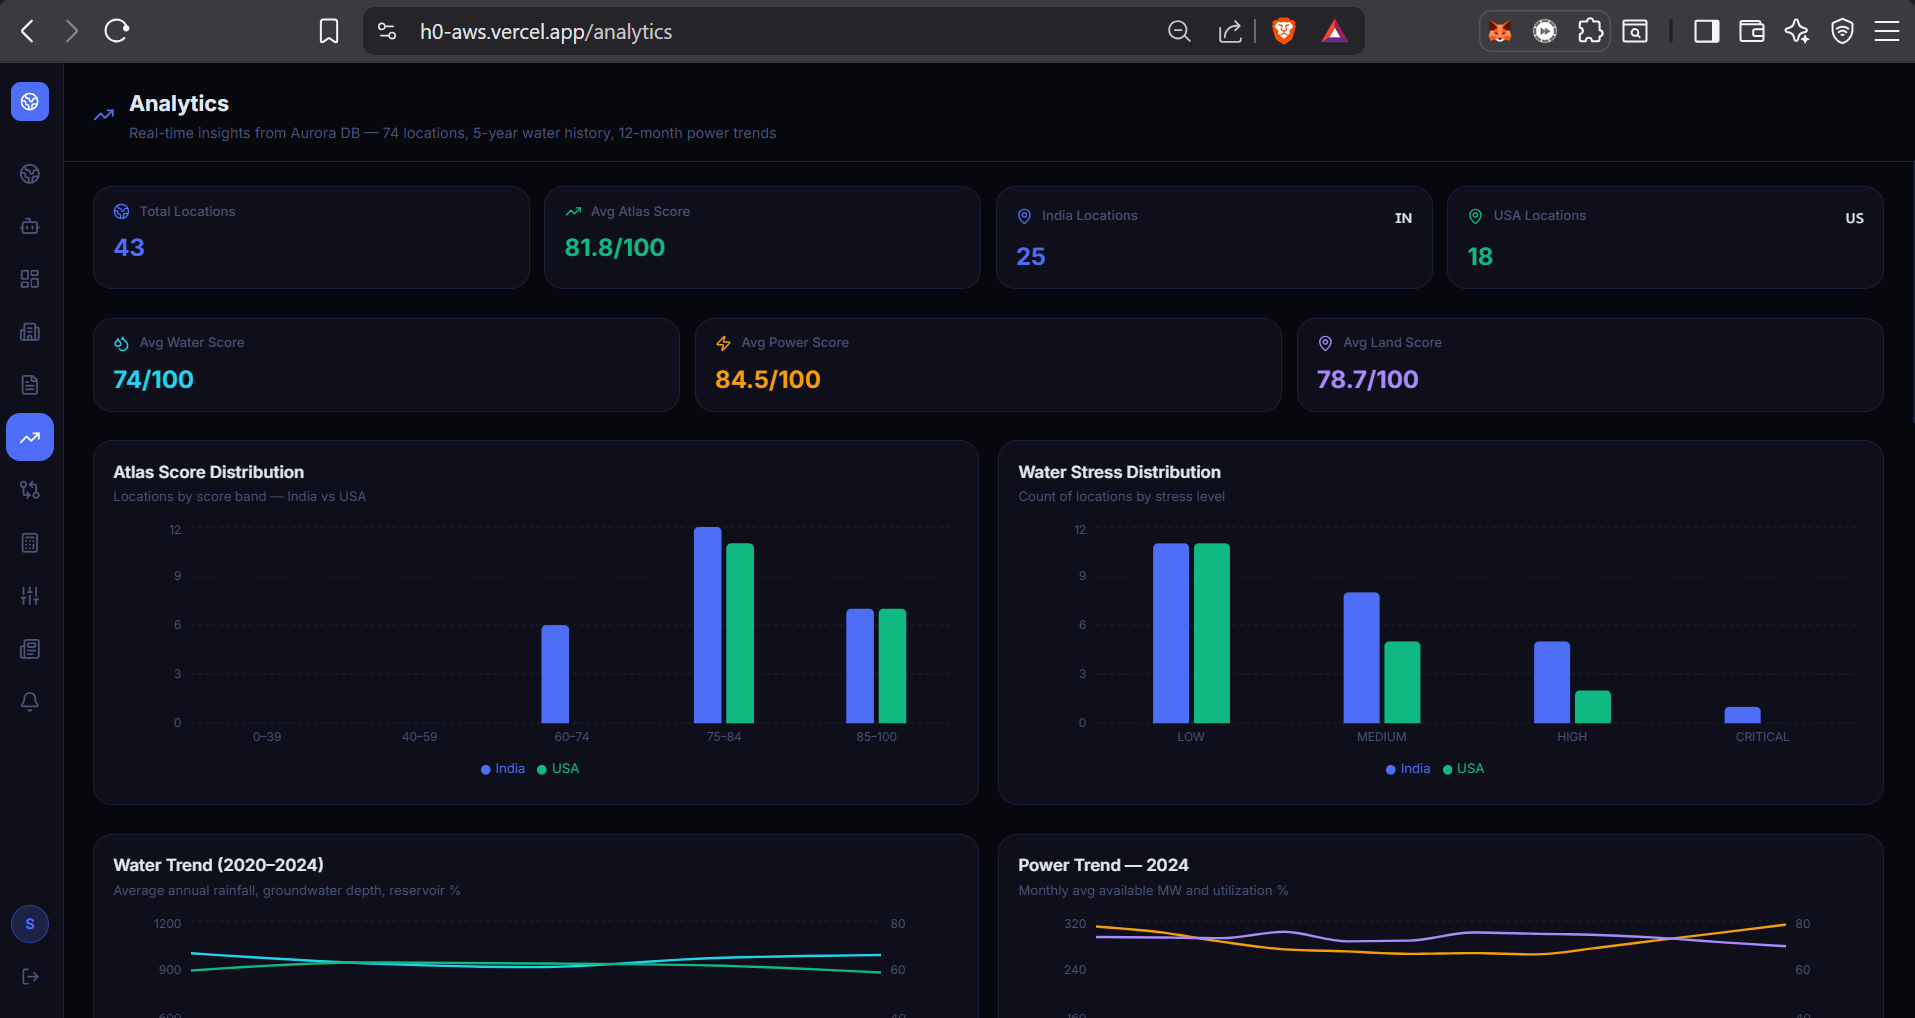
analytics
-
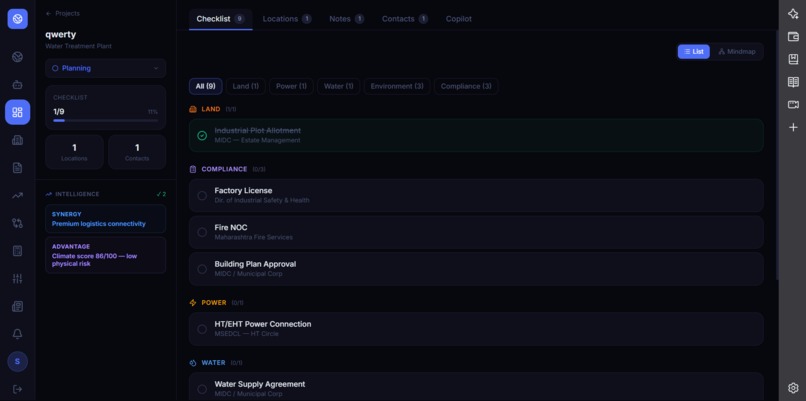
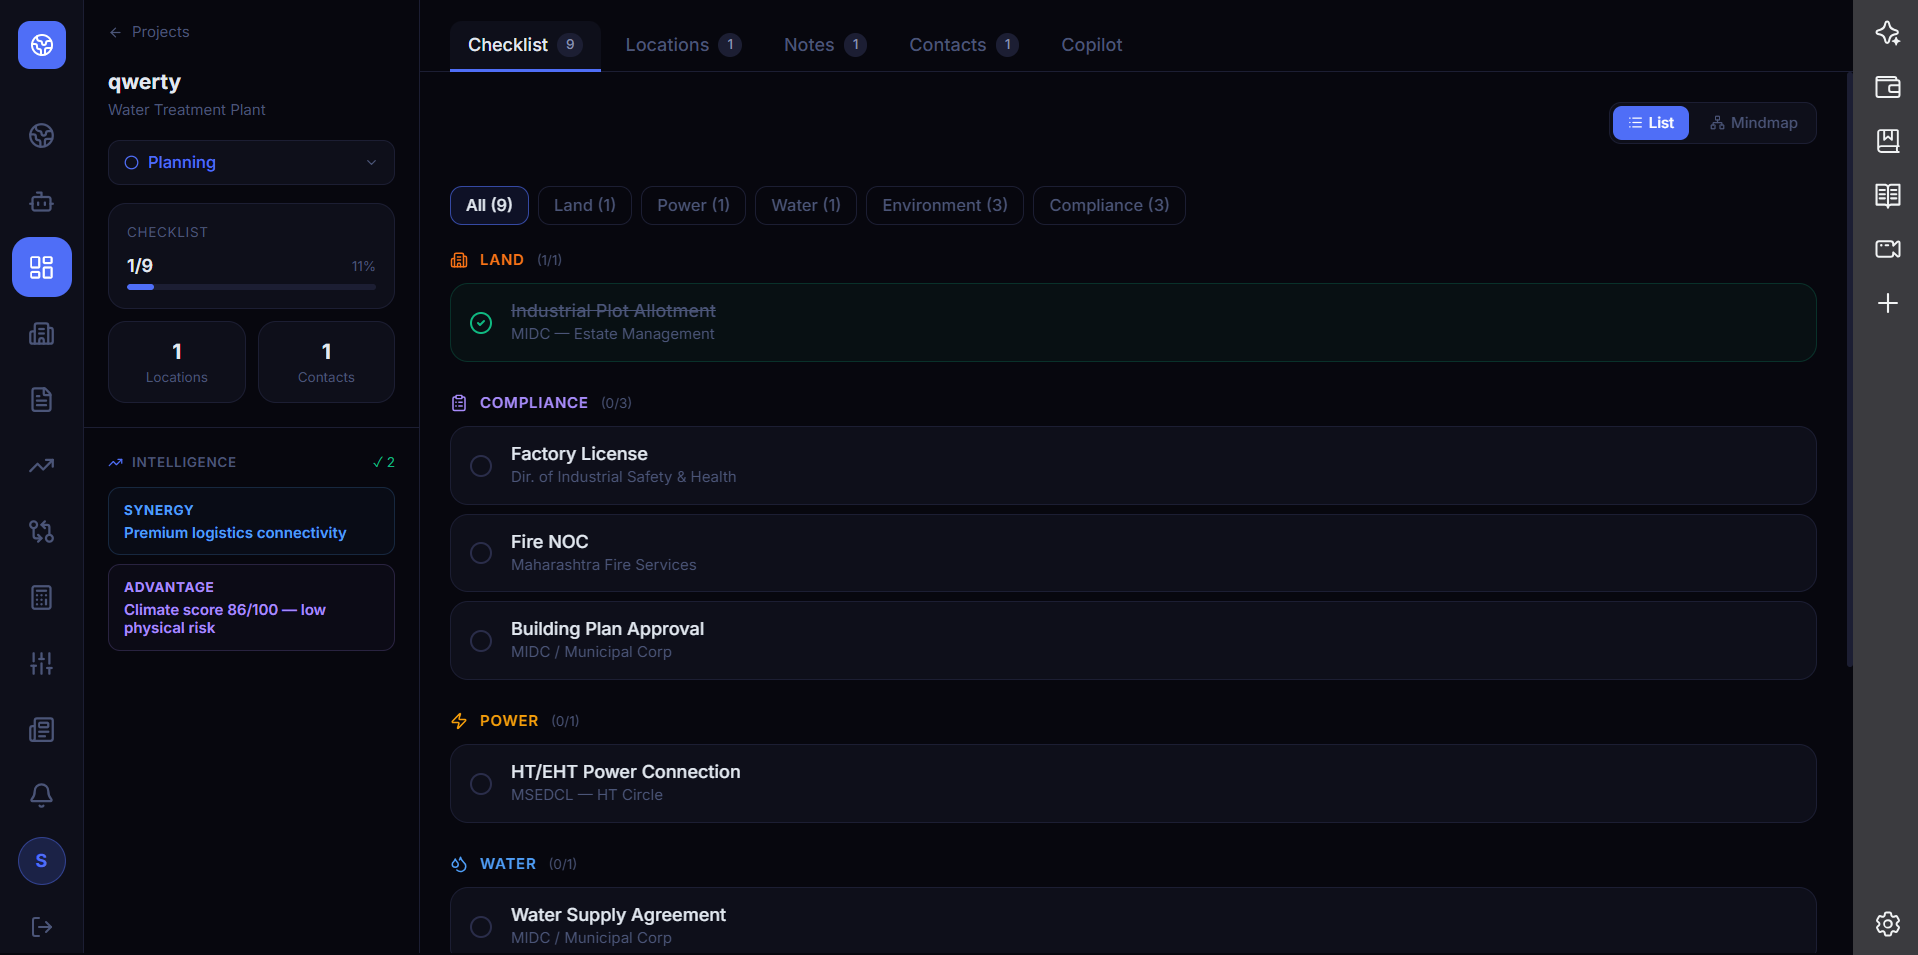
checklist
-
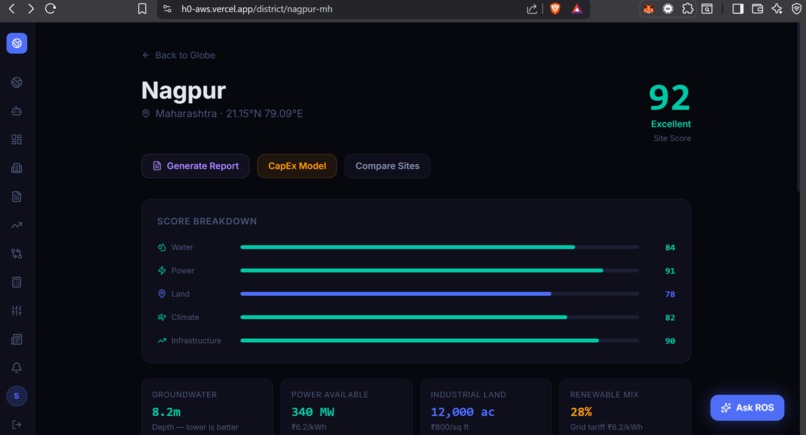
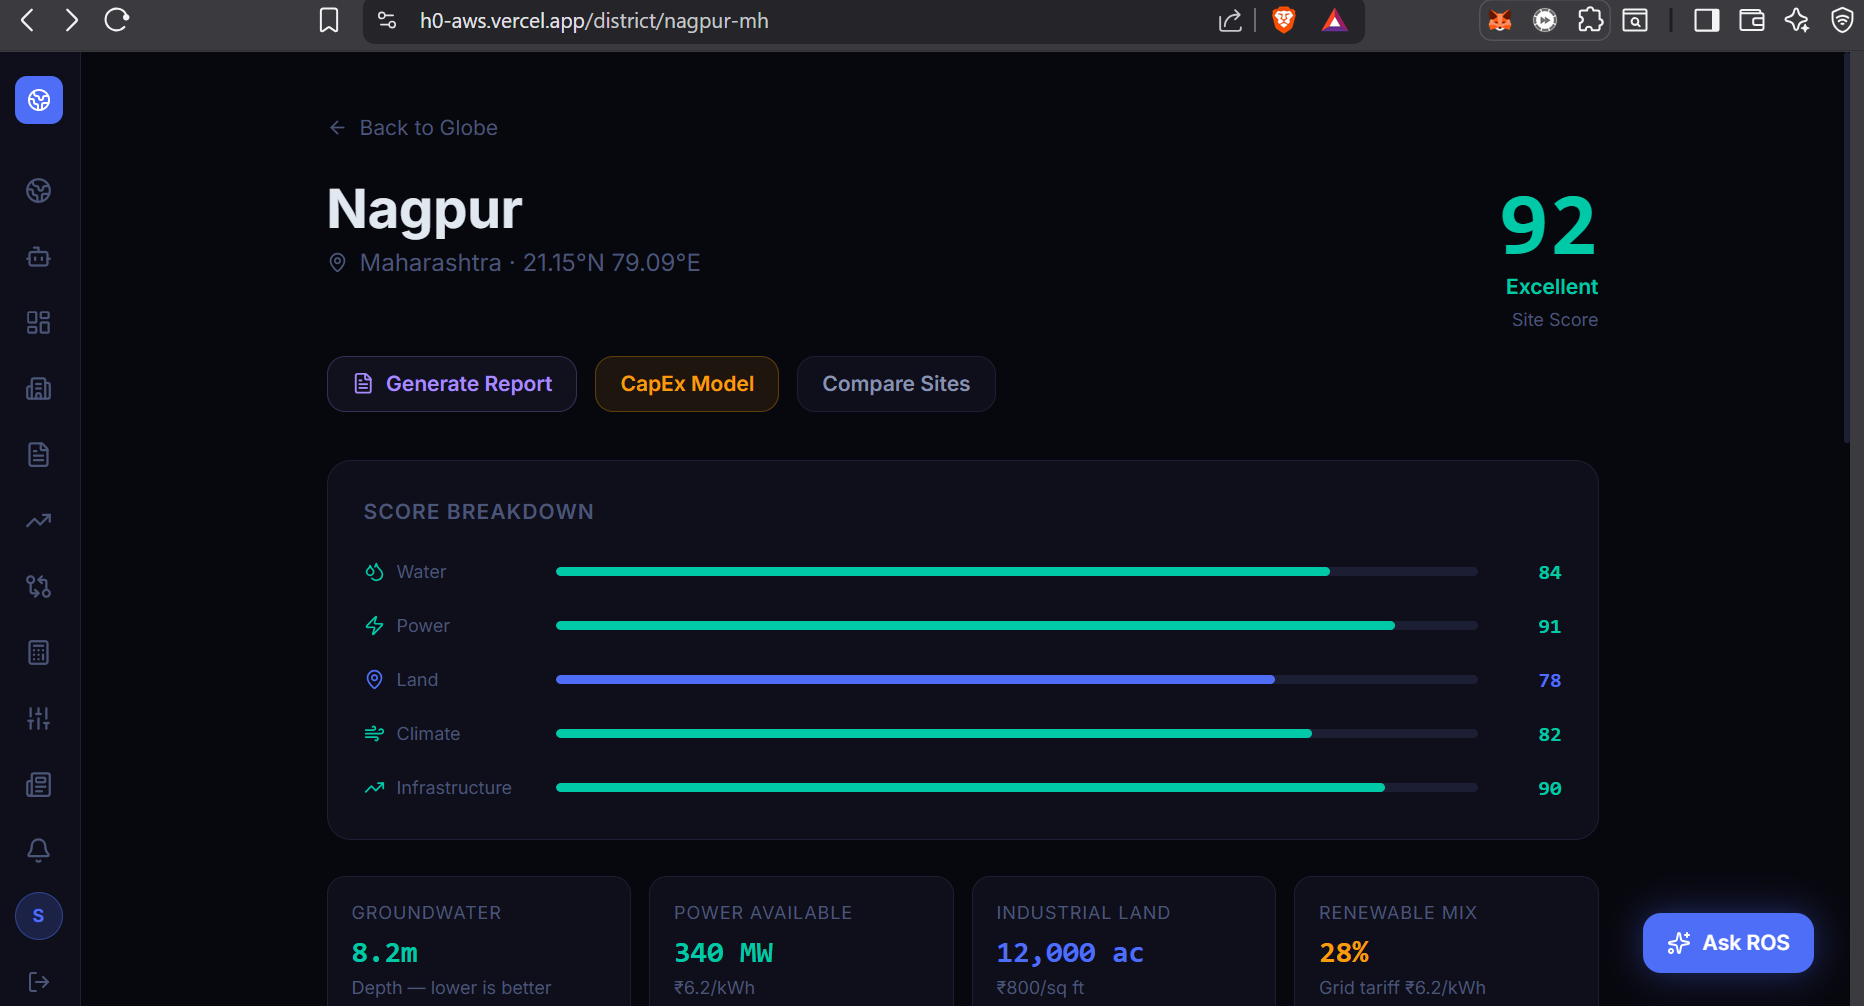
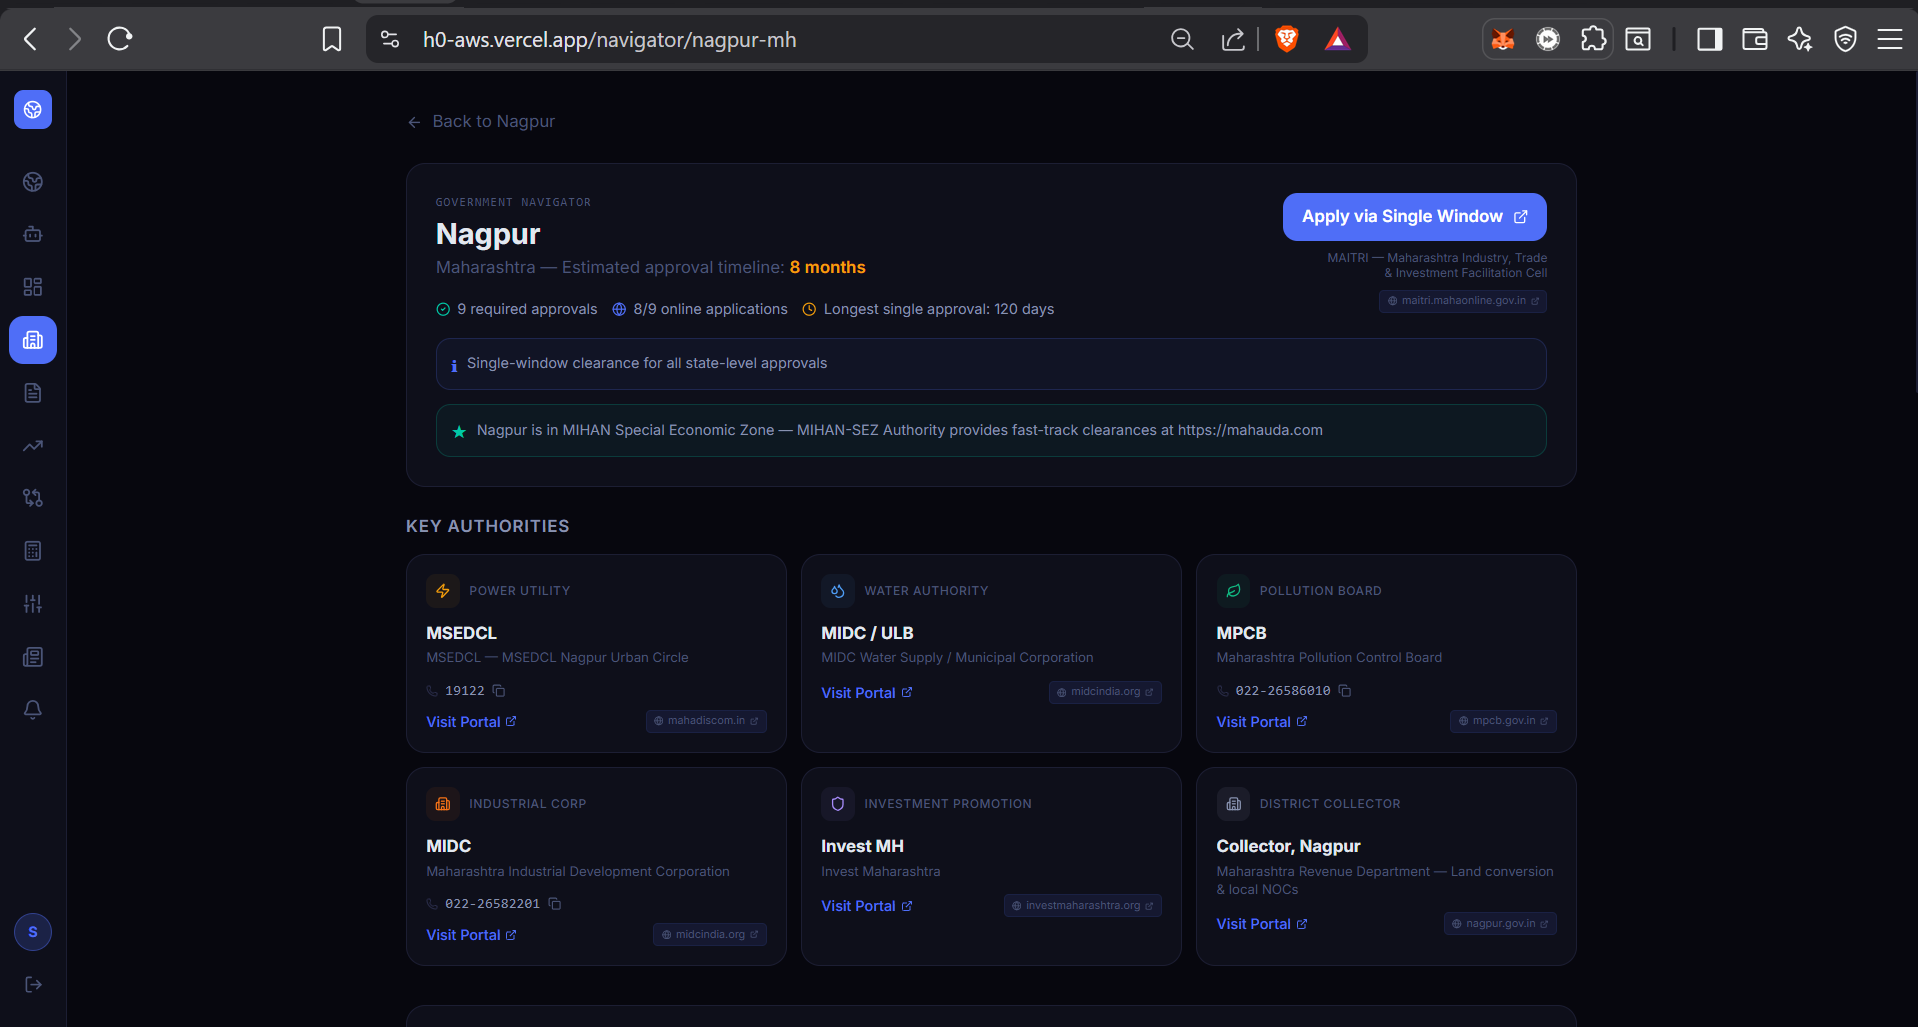
Vitals of that location
-
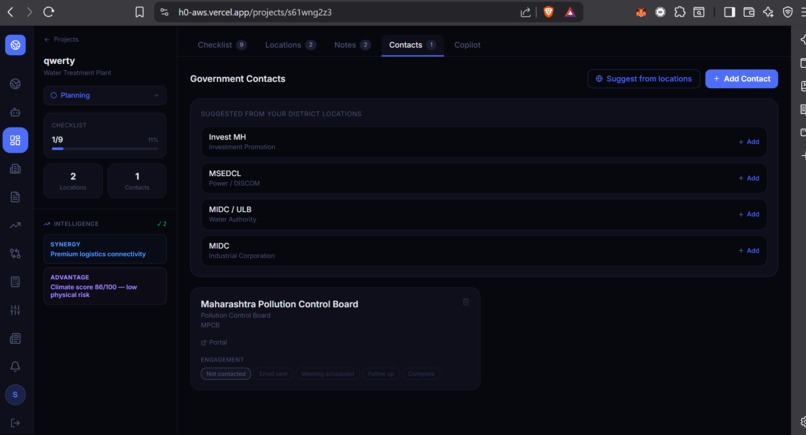
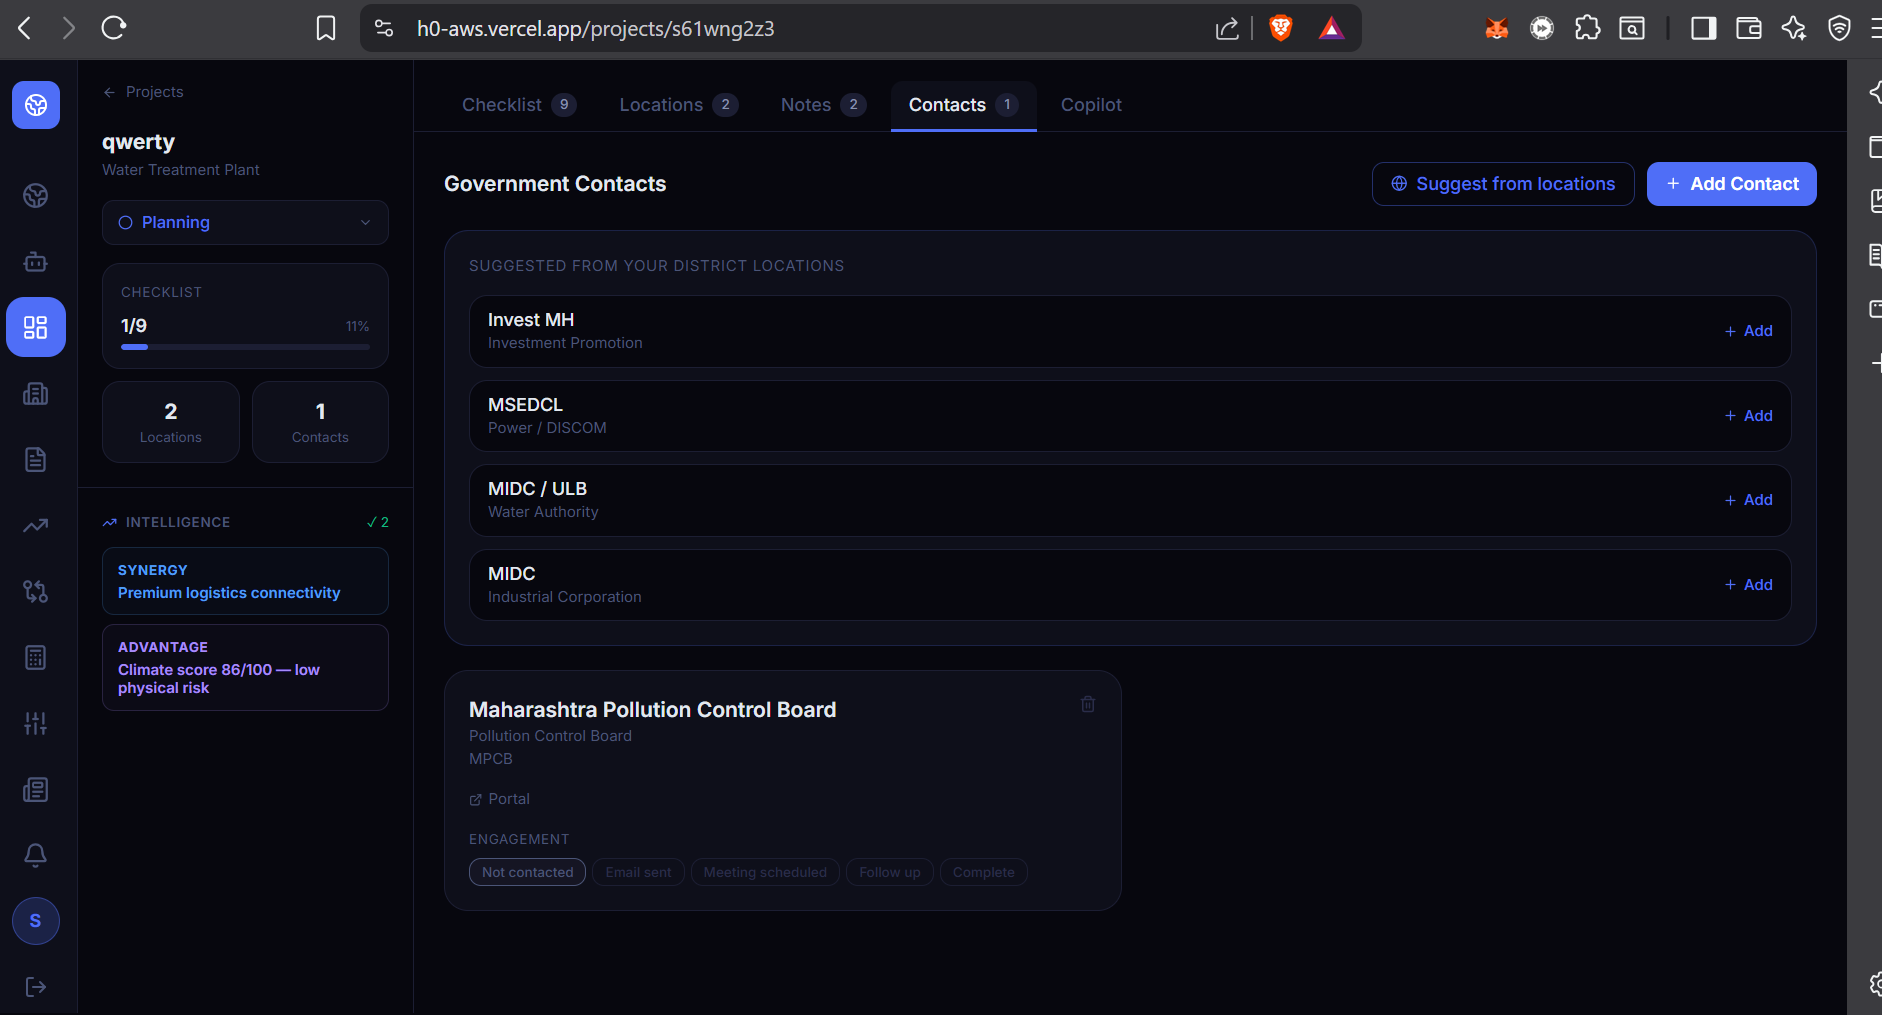
pull contacts of govt agencies into the project
-
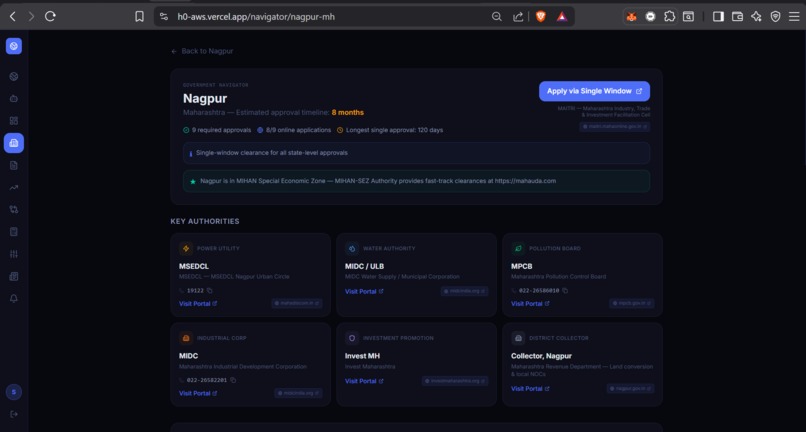
Govt agencies contact and checklist for that location
-
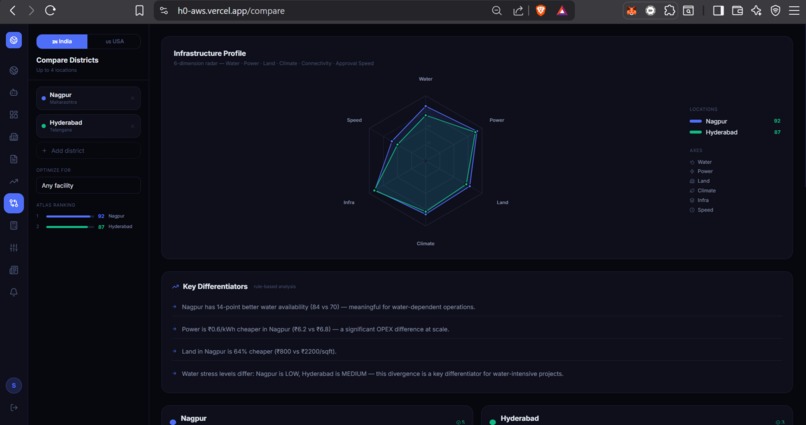
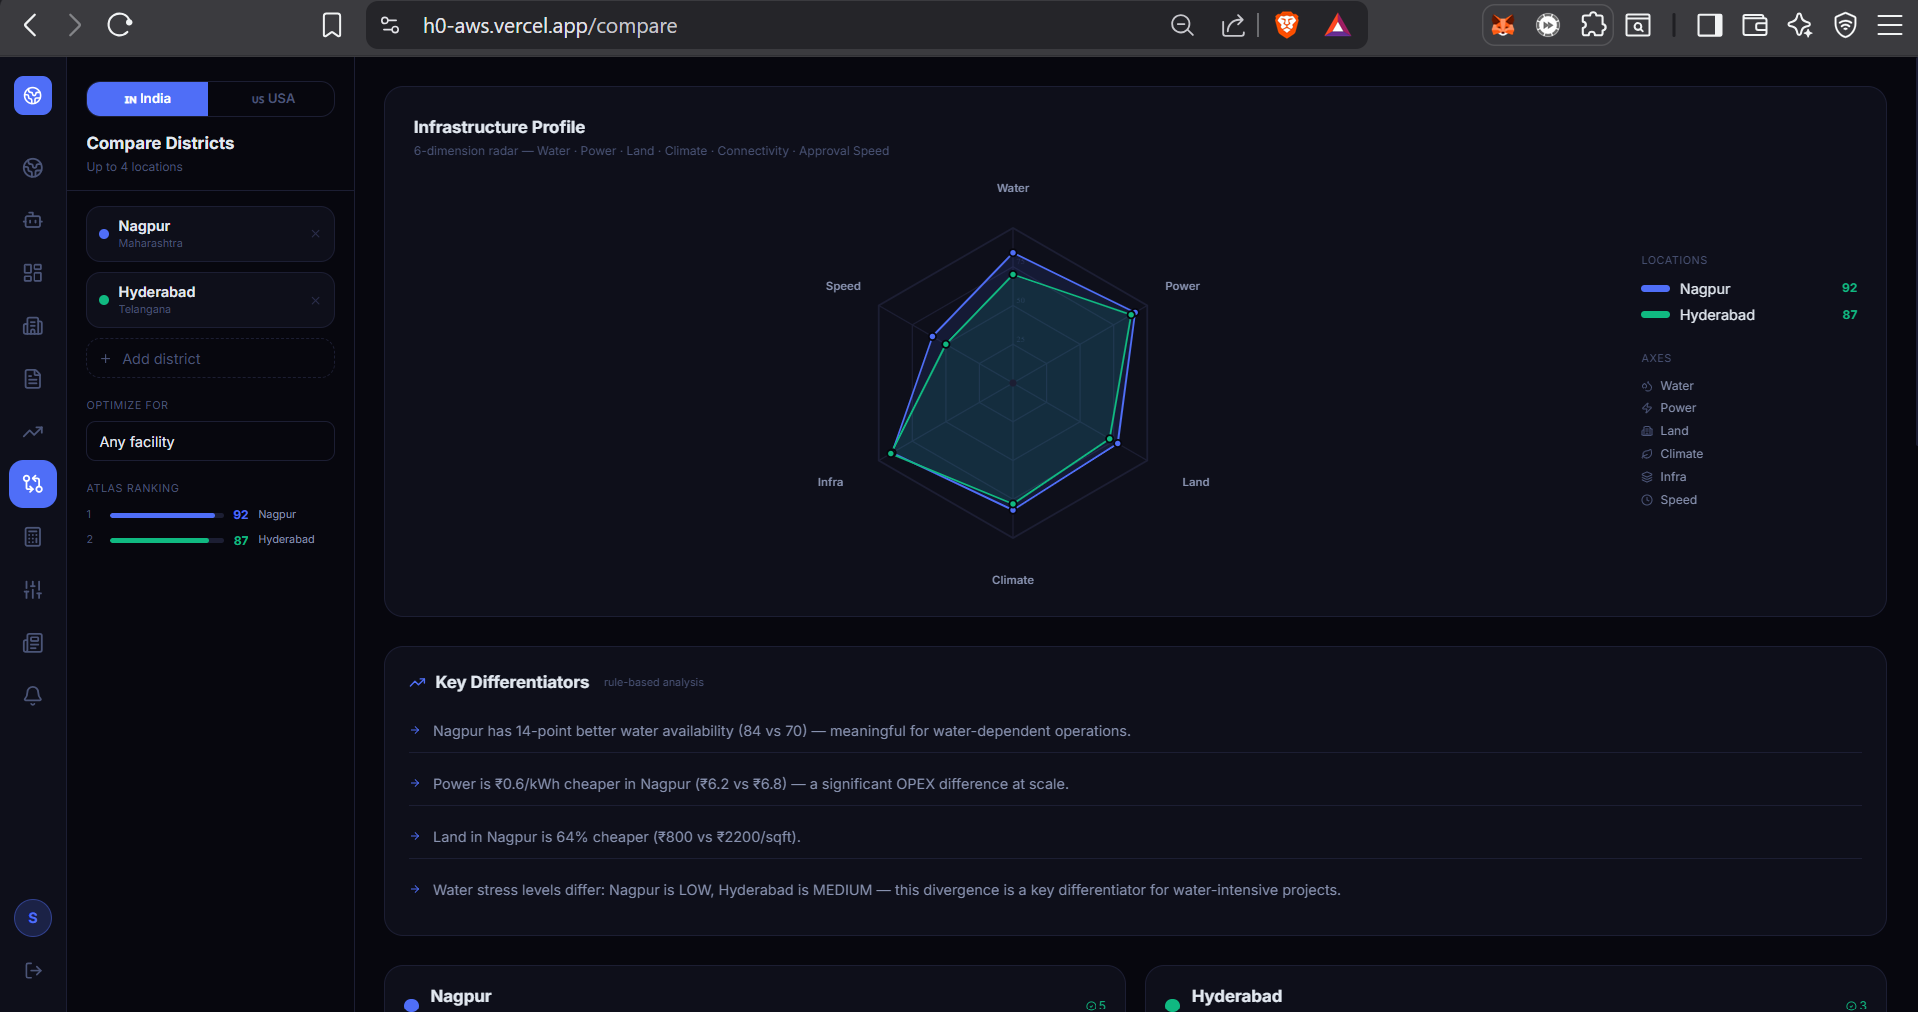
Location Comparison
-
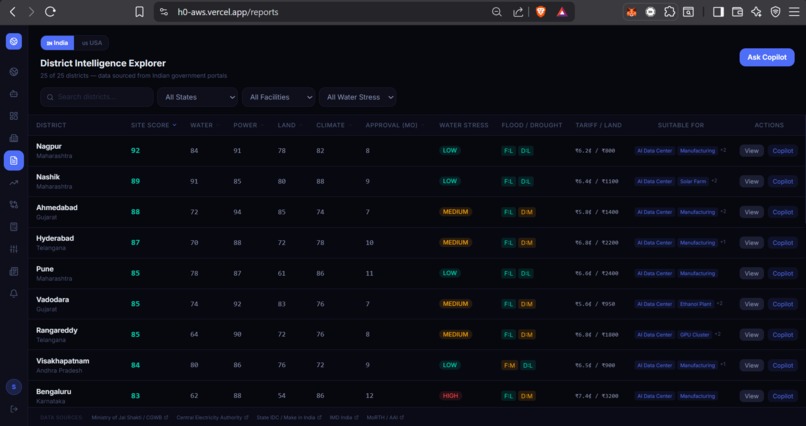
All districts vitals
-
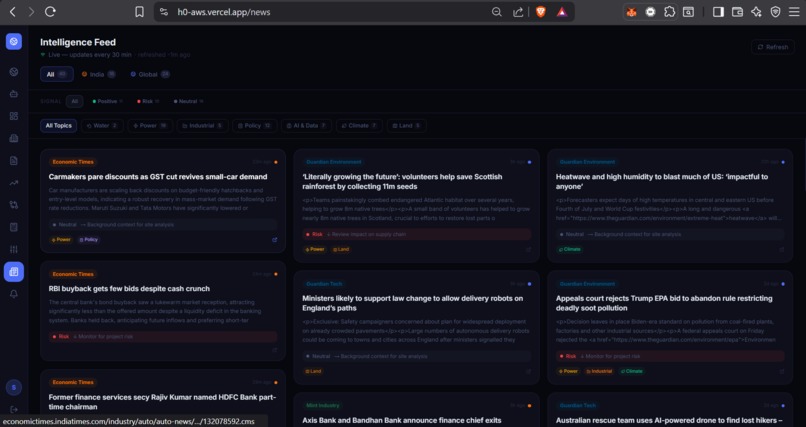
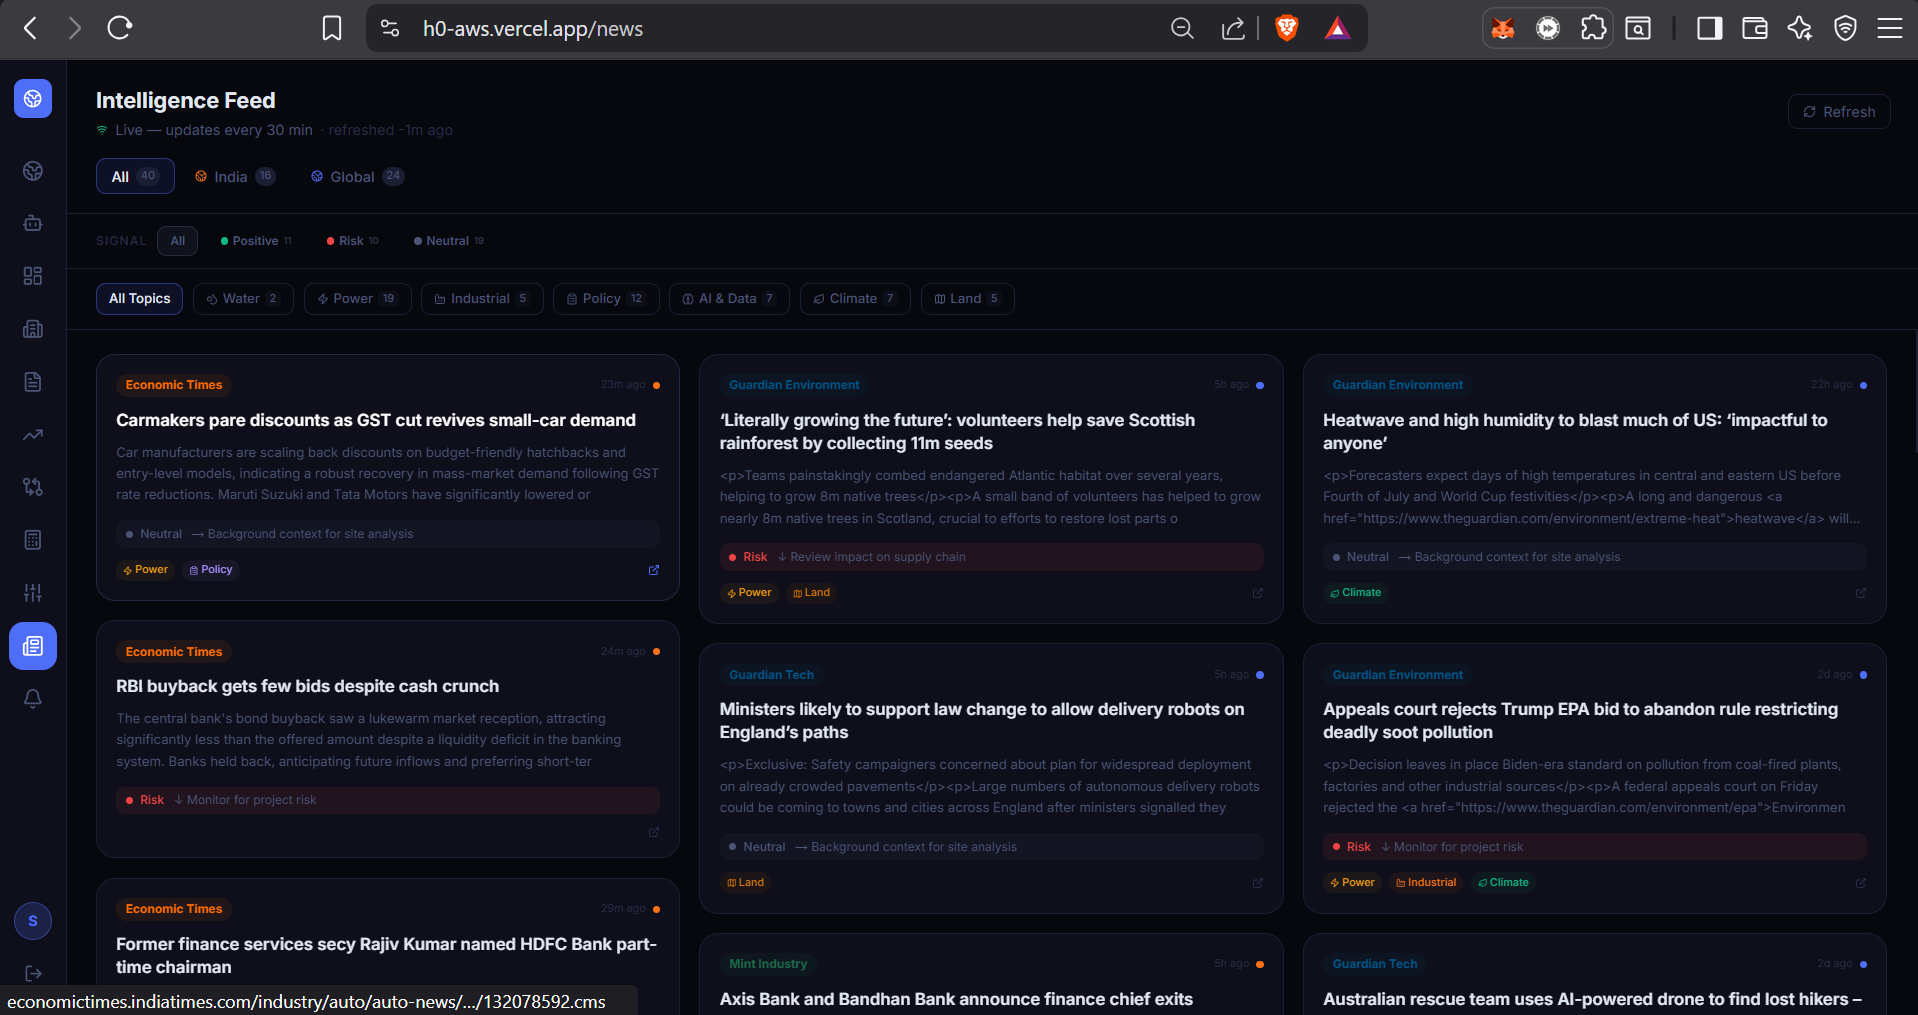
new feed for rating locations
-
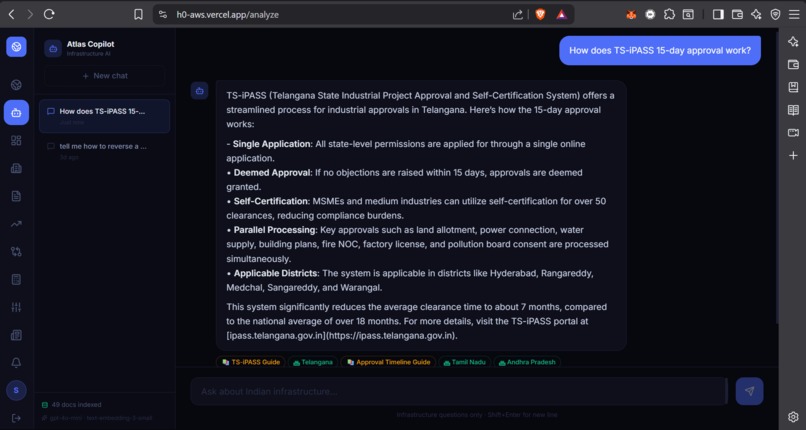
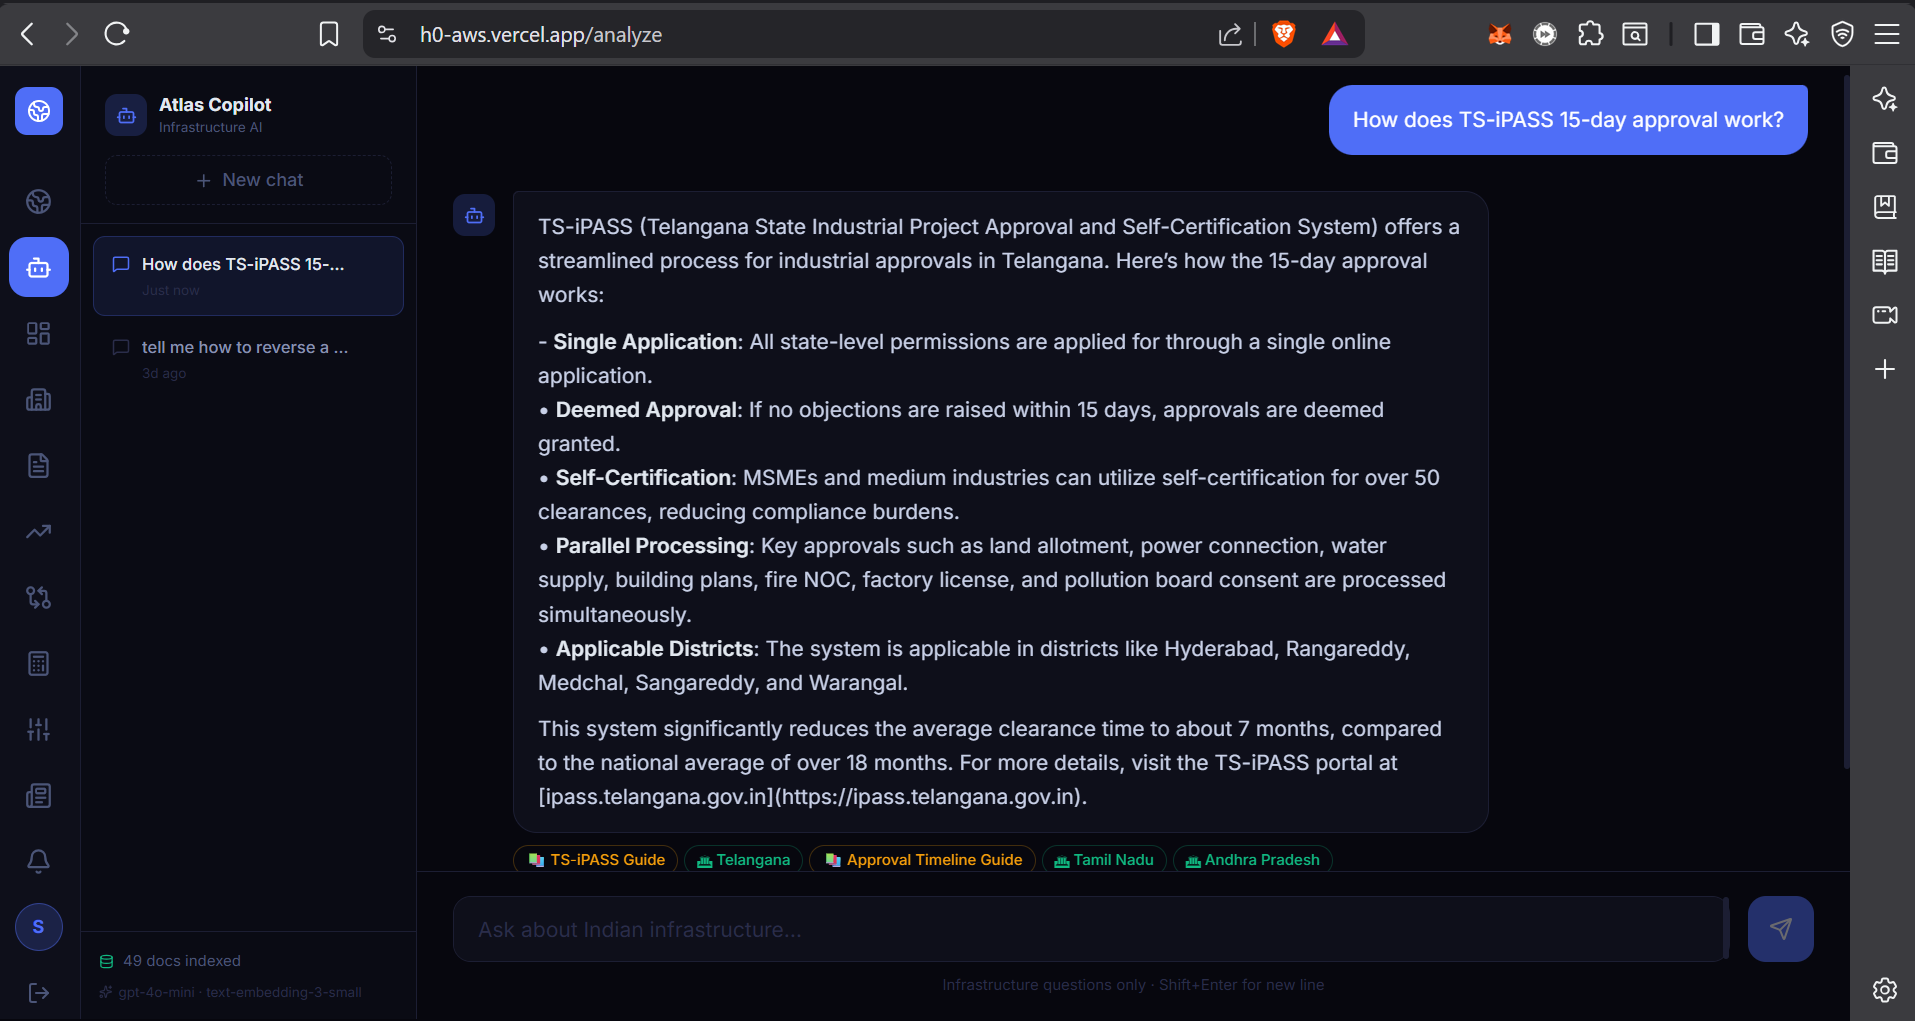
RAG and copilot for overall understandng
-
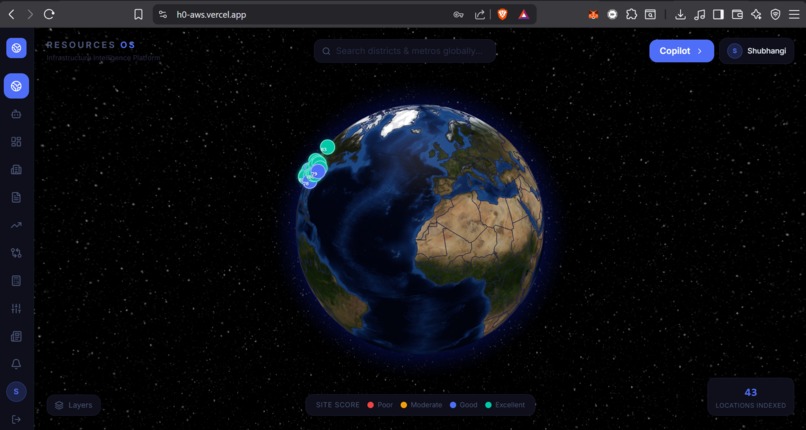
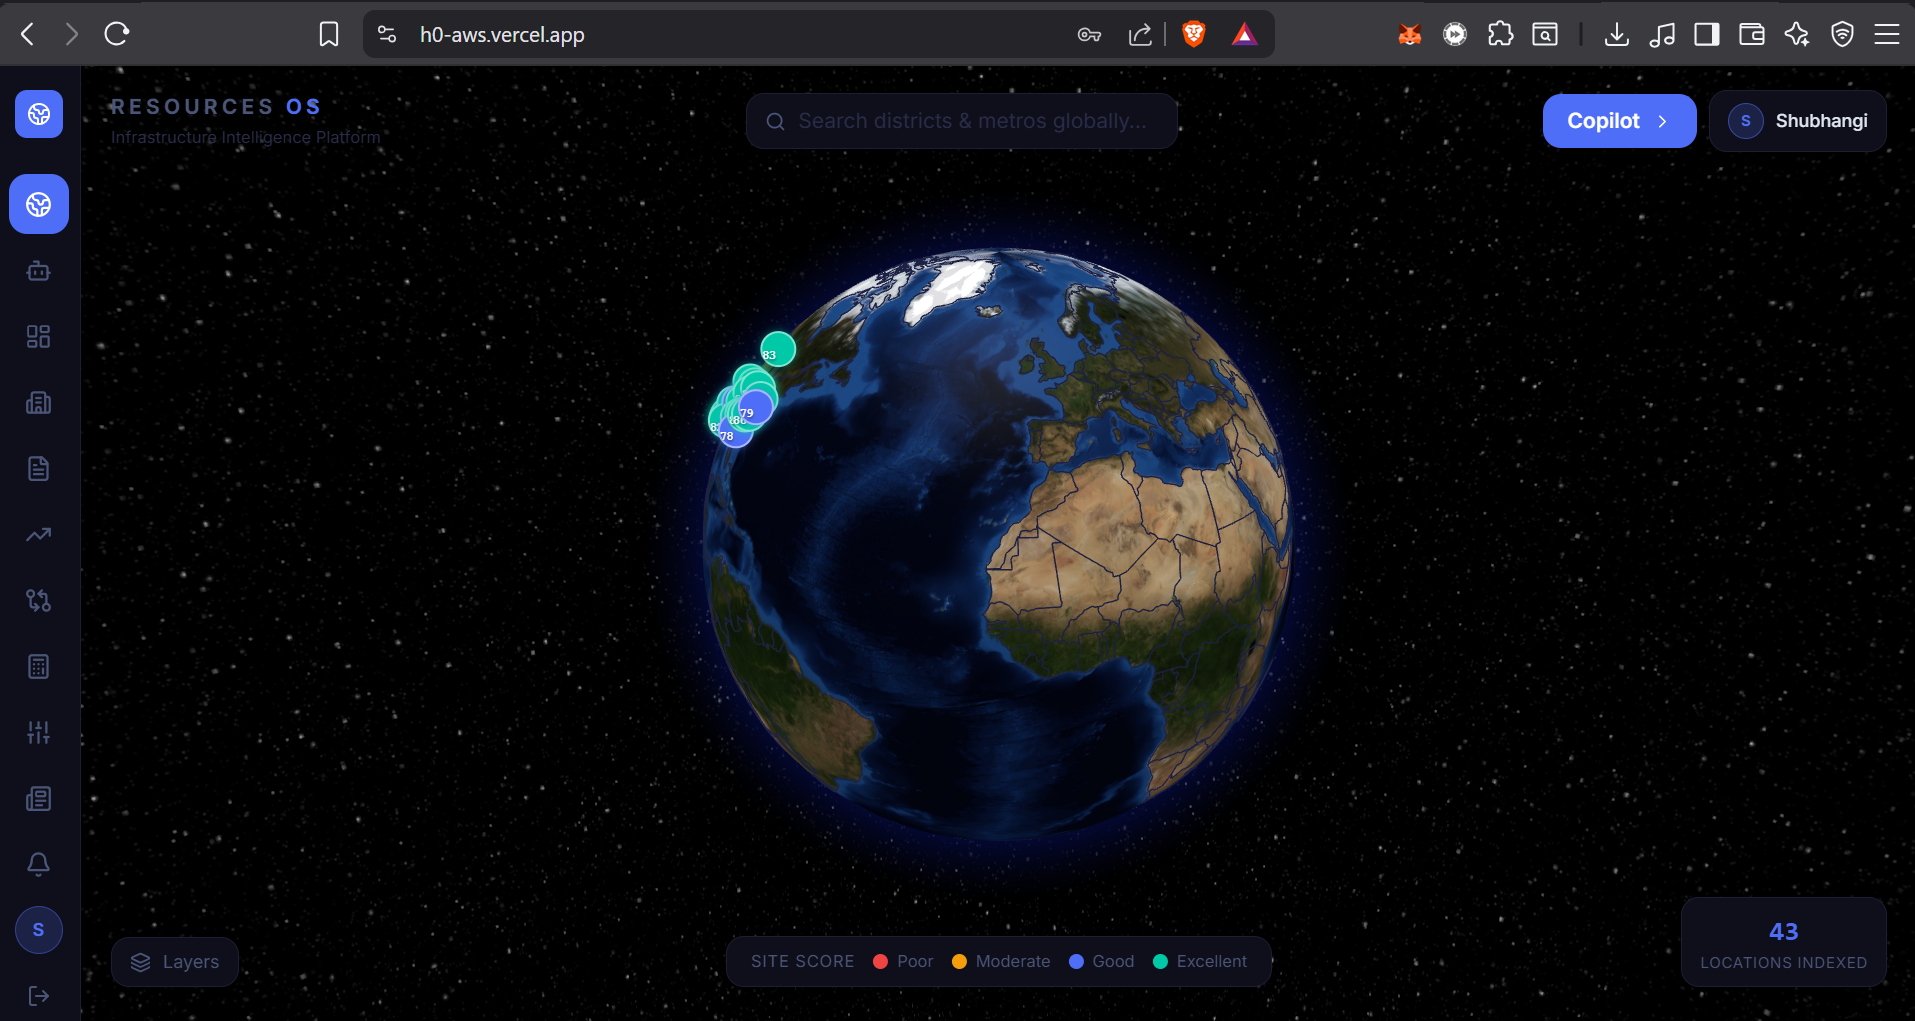
Landing page - Globe picker
Inspiration
Every year, companies spend collectively over $50 billion on infrastructure and site-selection consulting: McKinsey, BCG, Bain, and Bloomberg Terminal subscriptions, to answer one question: "Where should we build?"
A McKinsey infrastructure readiness report costs upwards of $500,000 and takes 3 months. Bloomberg Terminal costs $27,000/year and gives you raw data with zero interpretation. Neither is accessible to a mid-size manufacturer, a regional PE fund, or a startup scaling its first data center.
I asked: what if the same caliber of analysis (water stress, power grid capacity, land cost, climate risk, regulatory timelines) could be generated in under a minute, backed by a real relational database instead of a slide deck that goes stale the moment it's printed?
That's why I built Resources OS.
What it does
Resources OS is an infrastructure intelligence platform built around its core engine, Atlas, which scores 43 real locations across India and the USA on Water, Power, Land, Climate, and Infrastructure, rolled into a composite Atlas Score. Every other feature in the app is built to act on that data.
Discover and explore
- An interactive 3D globe where every pin is a real, data-backed location. Click one to open a live scores panel, or drill into a full district/metro page with score breakdowns, risk profiles, and connectivity data.
- A Government Navigator that maps each location to its actual regulatory agencies (single-window clearance bodies, DISCOMs, pollution boards, investment promotion agencies) with portal links and contact info.
- A Compare view that puts up to four locations side by side on a radar chart across water, power, land, climate, infrastructure, and approval speed.
Generate intelligence
- An AI Intelligence Report Generator: click one button on any location and watch a McKinsey-style brief stream live, executive summary, site score analysis, regulatory pathway, risk assessment, comparable-site benchmark, and investment recommendation, all grounded in the location's real database record, with a Print/PDF export.
- An Analytics Dashboard that runs live SQL aggregations against the database on every load: state rankings, water-stress hotspots, five-year rainfall trends, renewable energy leaders. Nothing here is hardcoded.
- A News Intelligence Feed that pulls live industry RSS data (Economic Times, Business Standard, BBC, The Guardian) and scores each article's sentiment for industrial investment, so a drought headline in Rajasthan surfaces as a risk signal automatically, filterable by Positive, Risk, or Neutral.
- An Alerts page that surfaces watchlist-relevant signals across water, power, policy, and climate.
Model decisions
- A CapEx Financial Modeler: pick a facility type, size, and headcount, add up to four locations, and get a real five-year cost-of-ownership comparison: land acquisition, construction, annual power, annual water, labor, and regulatory fees, with a "best value" callout.
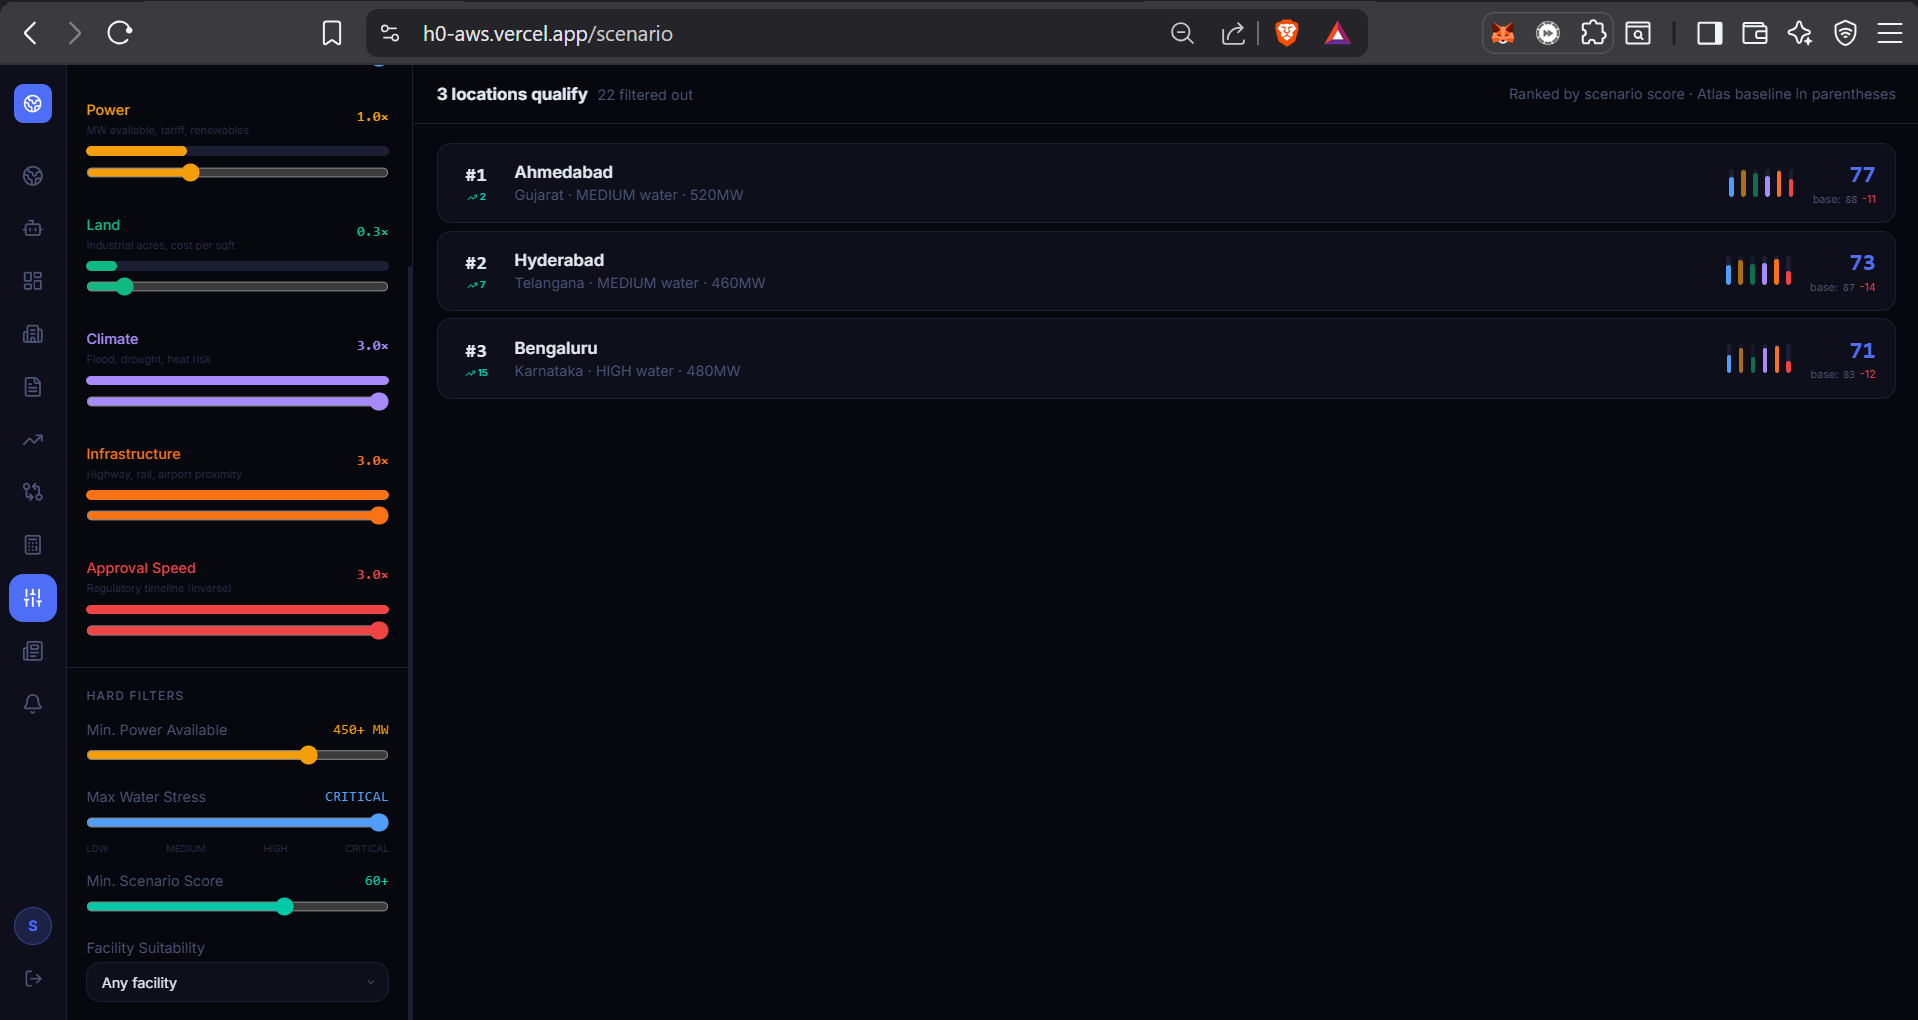
- A Scenario Analysis engine: drag sliders to re-weight Water, Power, Land, Climate, Infrastructure, and Approval Speed, and watch all 43 locations re-rank live, plus hard filters for minimum power, maximum water stress, and facility suitability. This is the "what-if" engine, the same kind of sensitivity modeling a McKinsey deck would show, except interactive.
Act on it
- A Projects workspace: create a project, build an approval checklist, add locations, track notes and regulatory contacts.
- A project-embedded Copilot: an AI assistant inside each project that already knows the project's name, type, locations, and checklist, so you can ask "what approvals do I need" without re-explaining context.
- A standalone Copilot page powered by a RAG pipeline (embedding plus similarity search) grounded strictly in Atlas's own data, with a hard guardrail that refuses off-topic questions.
- A Welcome Wizard that walks first-time users through the platform in five steps, so nobody lands on a globe full of pins with no idea what to click.
How I built it
Two AWS databases, used deliberately, not interchangeably.
- Aurora PostgreSQL holds the relational core: a
Locationtable with 30+ attributes,WaterHistory(5 years per location) andPowerHistory(12 months per location) time-series tables,GovAgencyregulatory records, andUseraccounts, connected by foreign keys. This is the layer that needs joins and aggregation, which is exactly what powers the Analytics Dashboard, the Report Generator's data grounding, and the Scenario Analysis scoring. - DynamoDB (table:
atlas-live) holds the operational layer: projects, tasks, notes, contacts, and project-locations, in a single-table design (PK: USER#<id>,SK: PROJECT#<id>#...) built for fast, high-throughput reads on a user's own workspace, no joins needed there.
Frontend: Next.js 15 App Router on Vercel, with react-globe.gl for the 3D globe, Recharts for analytics and radar charts, and Server-Sent Events for streaming both the Copilot and the Report Generator token-by-token, so the AI features feel like they're being written live rather than loading a spinner.
Auth to Aurora uses short-lived IAM tokens (15-minute TTL) generated per request rather than a static connection string, the production-correct approach for a database meant to outlive any one credential.
What I learned
The biggest thing I learned wasn't technical, it was how disorganized public infrastructure data actually is. Going into this, I assumed there'd be some baseline level of structure, maybe not a clean API, but at least consistent units, consistent naming, consistent update cycles across states. There isn't. One state publishes power tariffs as a PDF rate card updated annually, the next publishes it as an HTML table that changes mid-year with no changelog. One state's industrial land data is in acres, another's is in hectares, and a third bundles land cost into a "package incentive" that's not a number at all, it's a negotiation. Rainfall data exists at a granularity government departments are happy with for agriculture, but not at the granularity an industrial site-selection decision actually needs. None of this is documented anywhere as "here's how to use this data," because none of these portals were built for that. They were built to satisfy a disclosure requirement, not to be queried. Building Atlas meant accepting that the hard part of this product isn't the AI or the database, it's the unglamorous work of normalizing a dozen incompatible, half-maintained sources into one consistent schema that a Location table can actually hold.
That realization changed what I thought the product was. I started out thinking I was building a scoring engine. I ended up understanding I was building a translation layer between fragmented bureaucratic data and a decision someone actually needs to make, and that translation layer, not the score itself, is the real value.
A few other things I learned along the way:
- Relational vs. key-value isn't a style choice, it's an architecture decision. Once I had both Aurora and DynamoDB in the same app, it became obvious which questions belong where: "rank all locations by water stress" is a SQL query; "give me this user's project tasks" is a key-value lookup. Forcing either database to do the other's job would have meant fighting the tool.
- Streaming changes what AI features feel like. Generating a report by waiting eight seconds for one blob of text feels like a spinner. Generating it as six section headers appearing live, McKinsey-memo-style, feels like watching an analyst think. Same model call, completely different product.
Challenges I faced
The honest version of my build log, solo, end to end, and not all of it was code.
Sourcing real government data was harder than building the app. There's no unified API for Indian district-level infrastructure data. Water numbers live at CGWB, power numbers live at CEA and then again separately at each state DISCOM, land rates live at state IDC portals, rainfall lives at IMD, and approval timelines live wherever a state's investment promotion agency happened to publish them last. Every state names and structures this differently. There was no shortcut here: it meant going portal by portal and manually cross-referencing numbers before they could go anywhere near the database.
A meaningful number of official government sites are effectively non-functional. Several state single-window portals, DISCOM tariff pages, and industrial corporation sites either timed out, redirected to dead pages, or hadn't been updated in years despite being the "official" source. I had to quietly drop or substitute a few districts and data points where the primary source was unusable, and lean on secondary sources (state economic survey PDFs, RBI/NITI Aayog reports) to fill the gap, which meant tracking provenance per field instead of per source.
Truthfulness and freshness of data is a real, unresolved tension. Government-published tariffs, approval timelines, and incentive schemes change, sometimes mid-year, and the published number isn't always the operational reality on the ground. I made a deliberate choice to treat every value in Atlas as a researched estimate compiled from official sources, not a live feed, and to say so explicitly in the product rather than imply a real-time government API that doesn't exist for this data. That's also why the Atlas Score is positioned as a proprietary composite index, the synthesis is the product, not a claim that every underlying number is current to the day.
Wiring the project-embedded Copilot meant solving context, not just chat. A generic chatbot is easy. Making it answer "what approvals do I need" correctly for one specific project meant building a system prompt at request time from the project's name, type, locations, and live checklist state, every single message, not just on session start.
The unglamorous reality of working with public infrastructure data: it's scattered, inconsistently maintained, and sometimes simply offline, and a big part of what Resources OS does is impose order on that mess so the person using it doesn't have to repeat the same research.
Built With
- ai-generated-intelligence-reports
- amazon-web-services
- analytics-dynamodb-?-single-table-design-for-projects
- aurora
- bbc
- business-standard
- contacts-cloud-/-infrastructure-aws-rds-(aurora-postgresql)-aws-iam-(short-lived-auth-tokens-for-database-access)-aws-dynamodb-vercel-(deployment
- css
- dynamodb
- edge-cdn)-ai-/-apis-openai-api-(gpt-4o-mini)-?-copilot-chat
- et-energy
- framer
- government-agency-data
- gpt-4o-mini
- iam
- jwt
- lucide
- mint
- motion
- next.js
- node.js
- notes
- openai
- postgresql
- prisma
- rag
- rag-embeddings-rss-feed-parsing-(economic-times
- react
- react-globe.gl
- recharts
- server-sent-events
- serverless-functions
- sql
- tailwind
- tasks
- three.js
- typescript
- vercel
- water/power-history


Log in or sign up for Devpost to join the conversation.