-
-
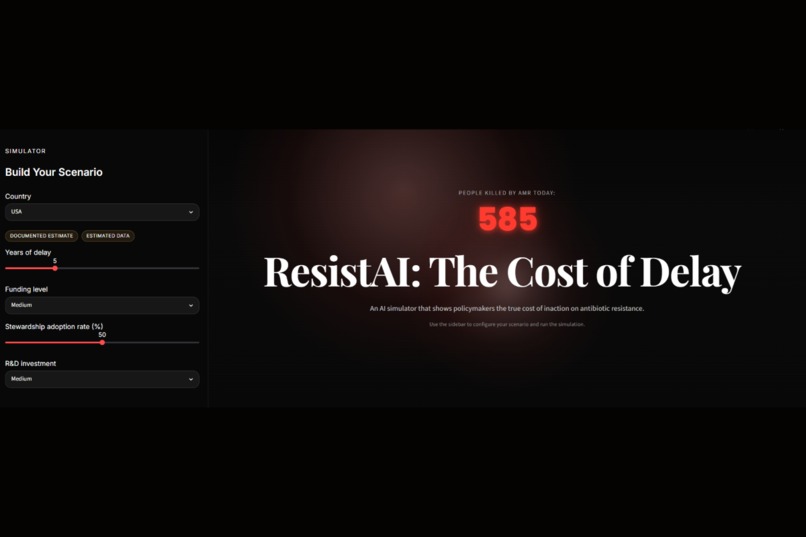
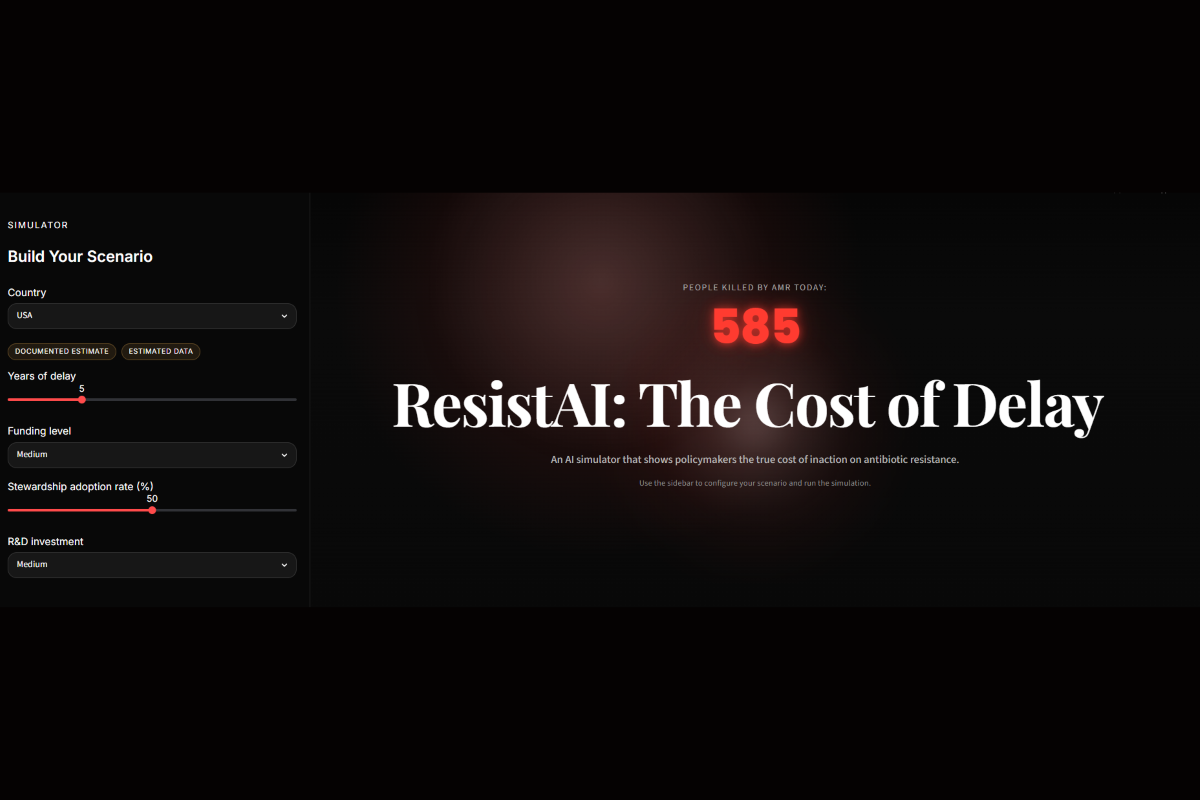
ResistAI Home Screen:The entry dashboard with sidebars to set country parameters, delay years, and funding levels.
-
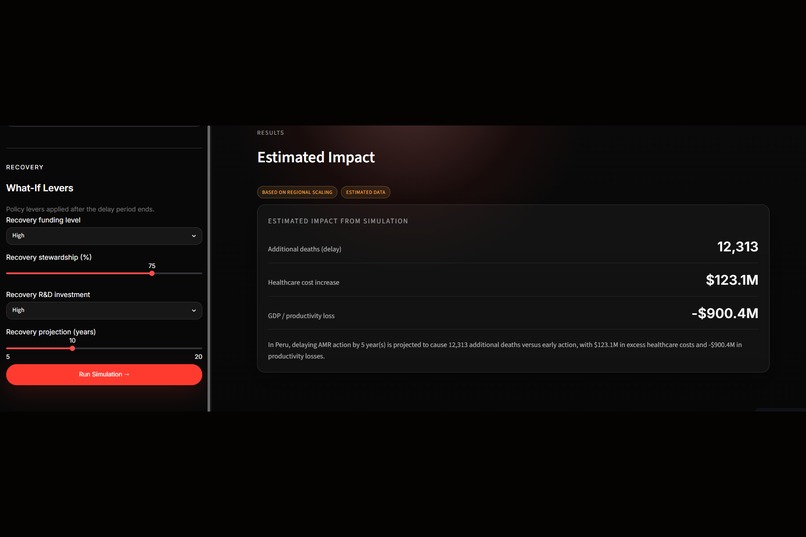
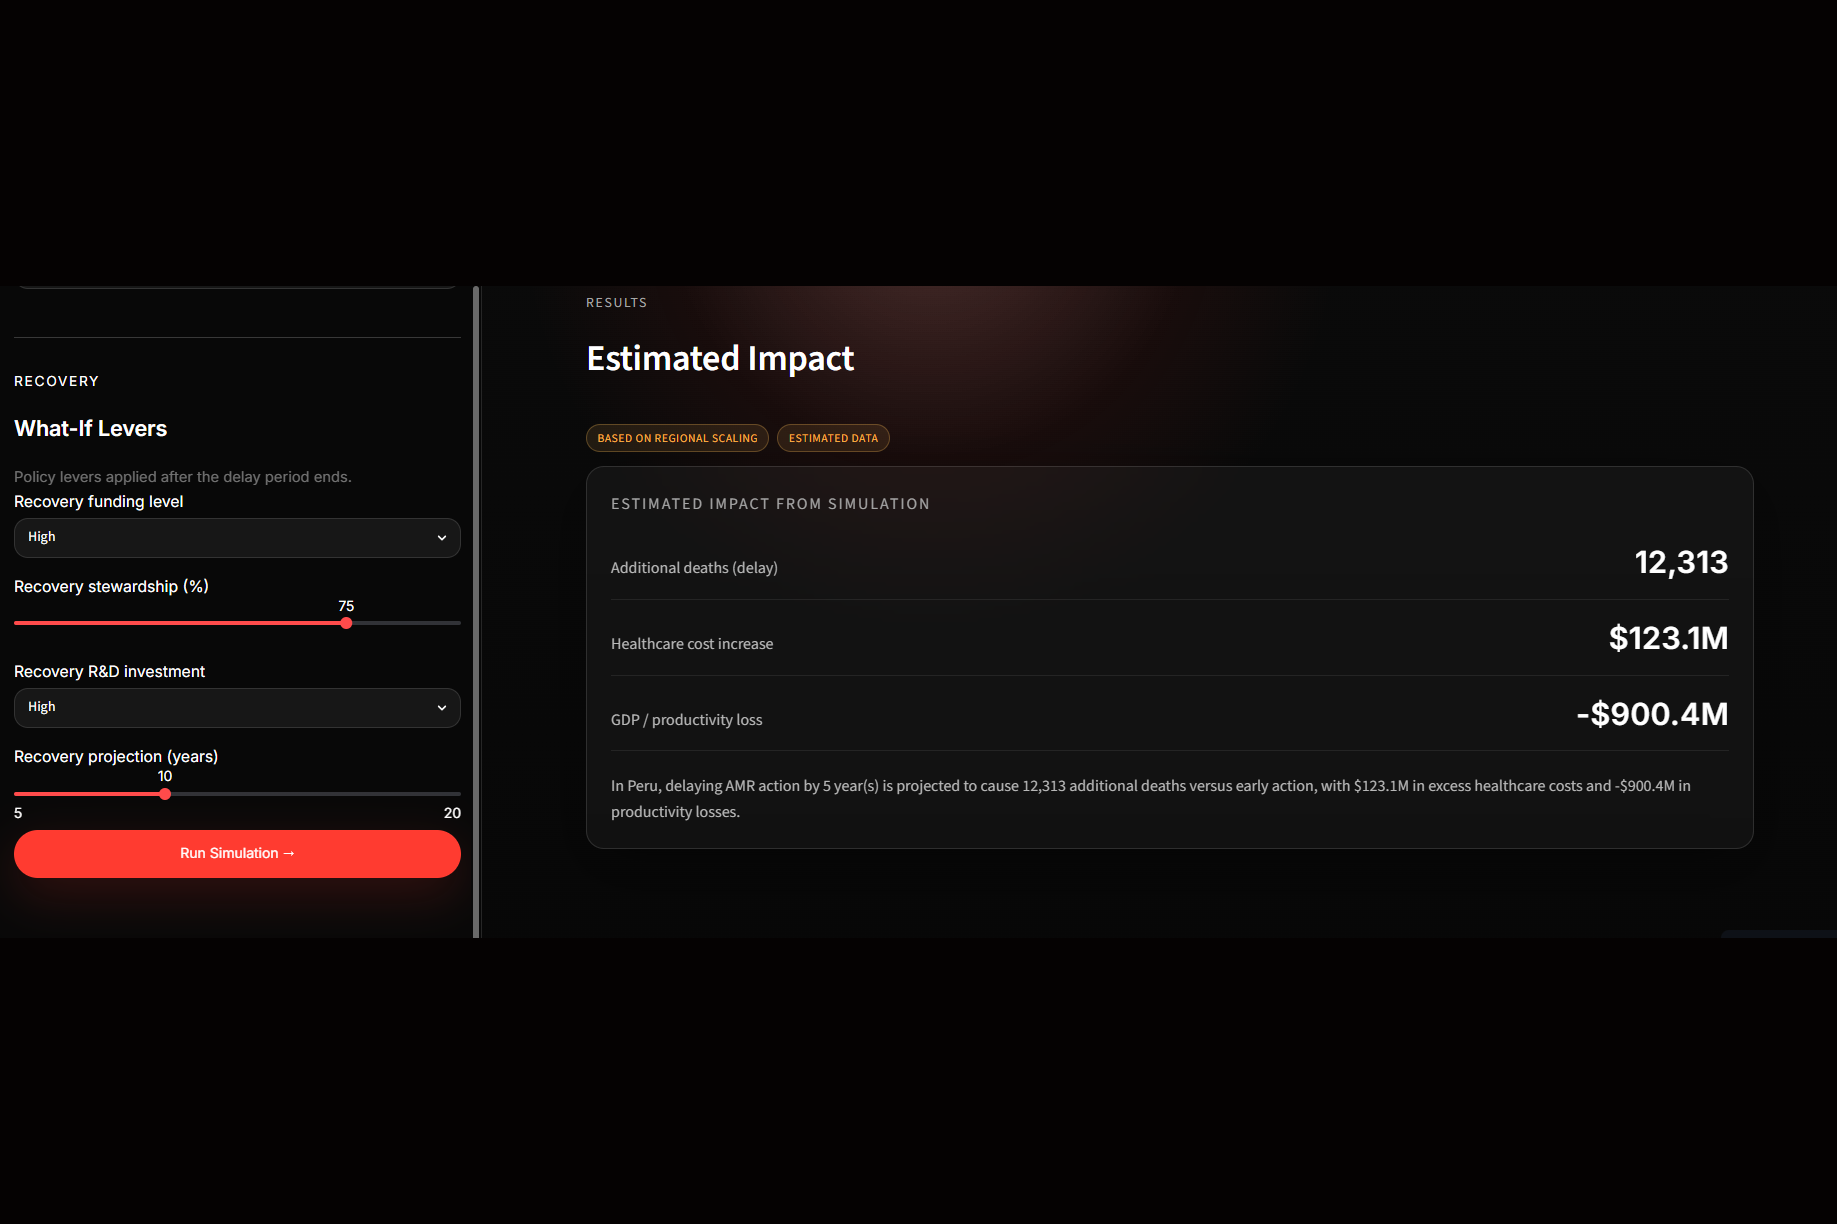
recovery: The estimated impact panel showing simulated mortality metrics and economic losses for USA.
-

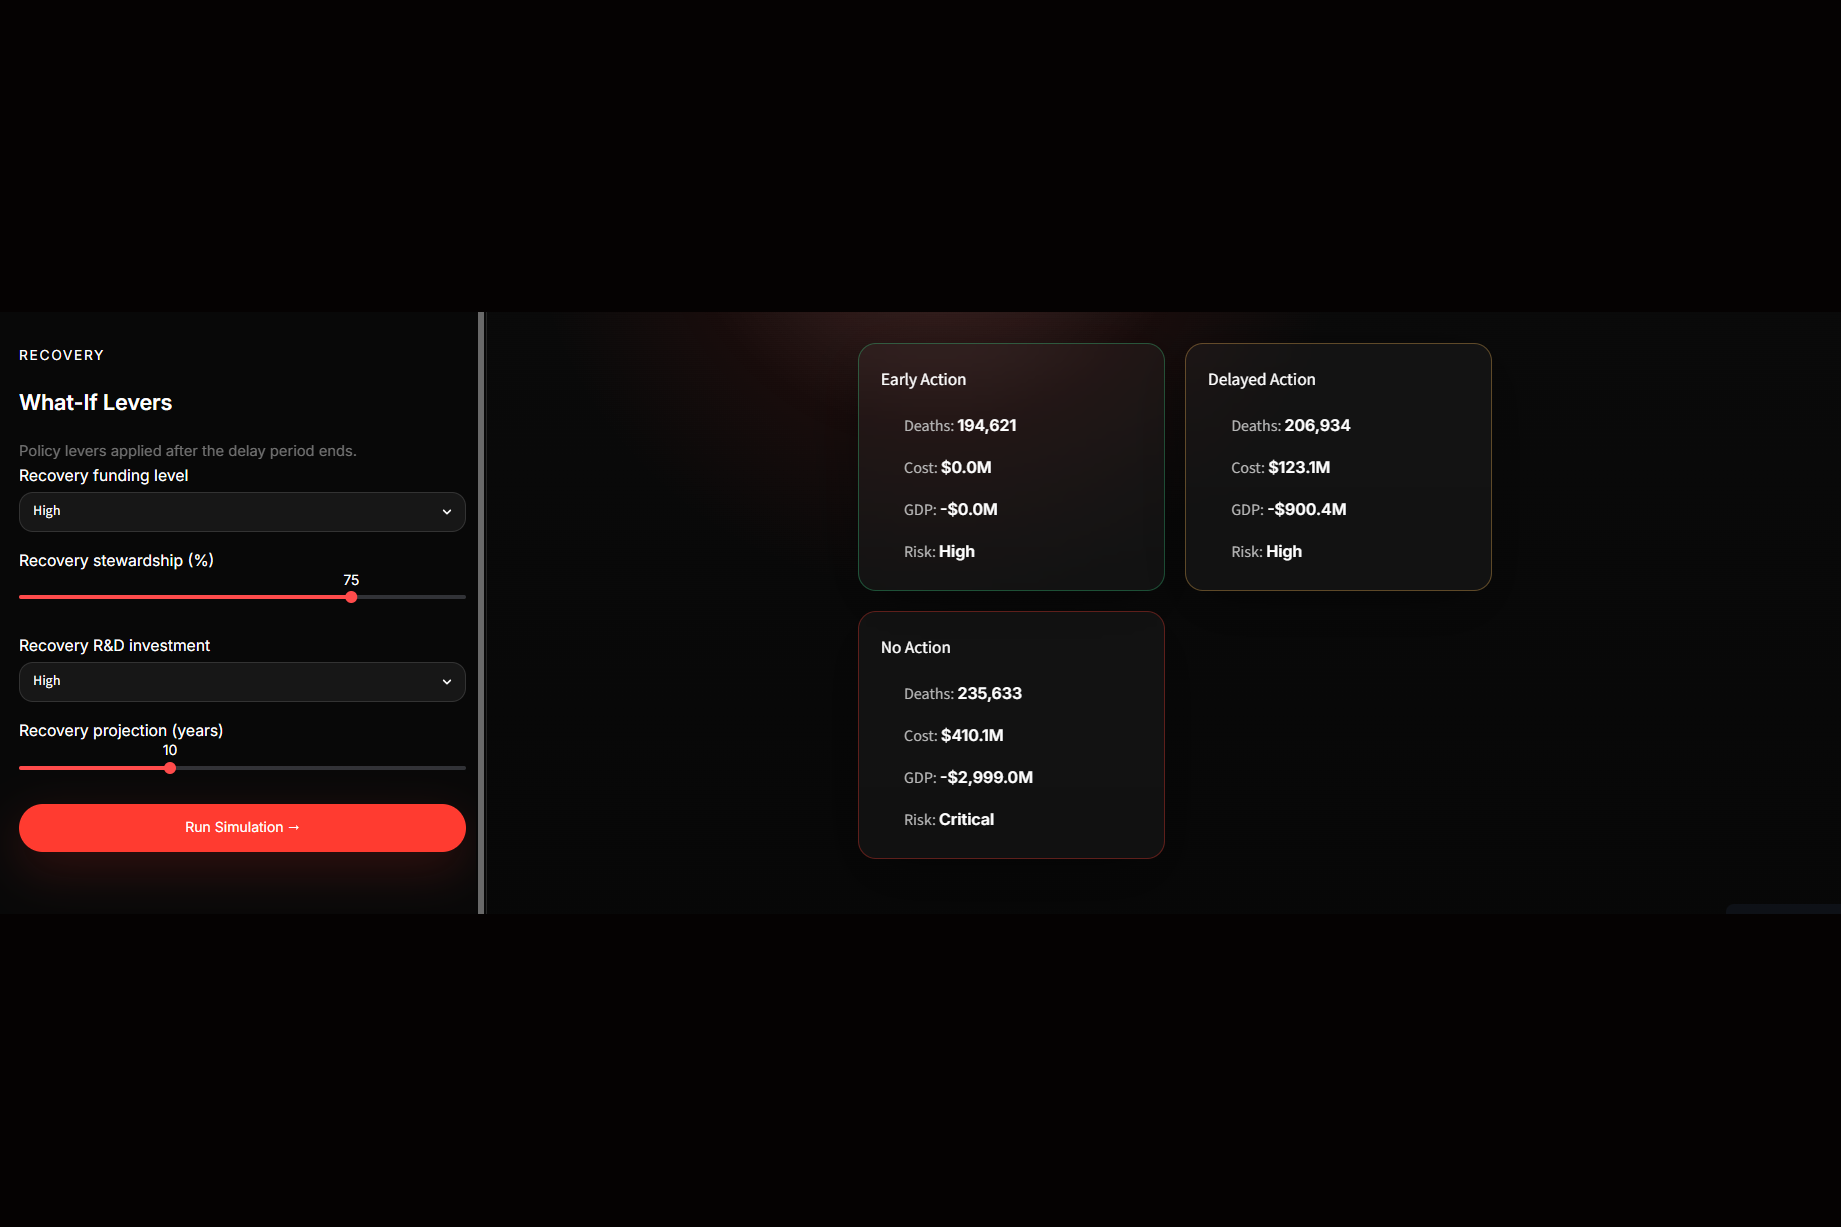
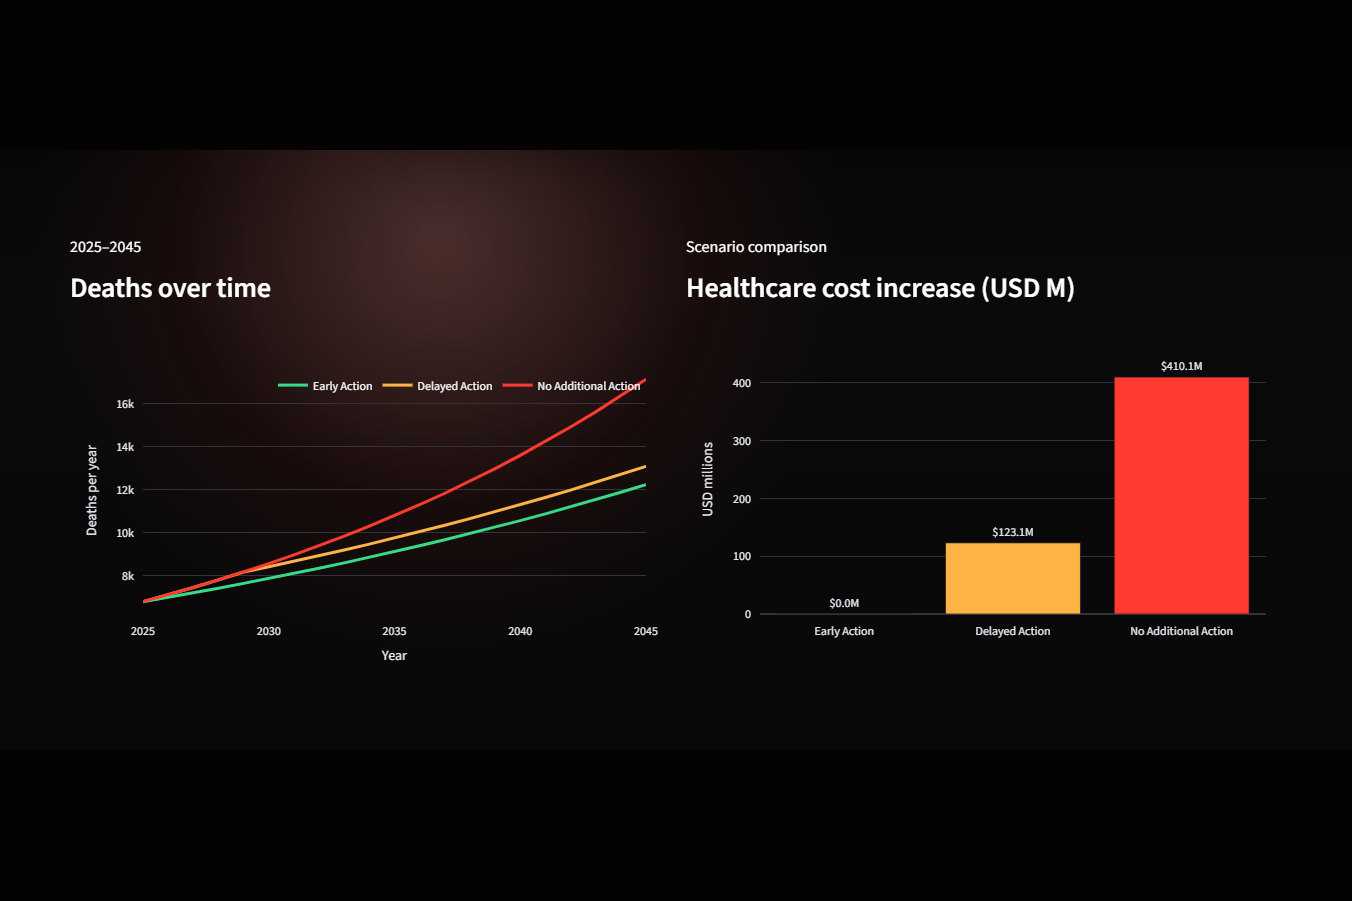
scenarios: A live matrix comparing three pathways: Early Action, Delayed Action, and No Action.
-

charts: Longitudinal bar and line visualizations mapping long-term healthcare expenditure increases out to 2045.
-
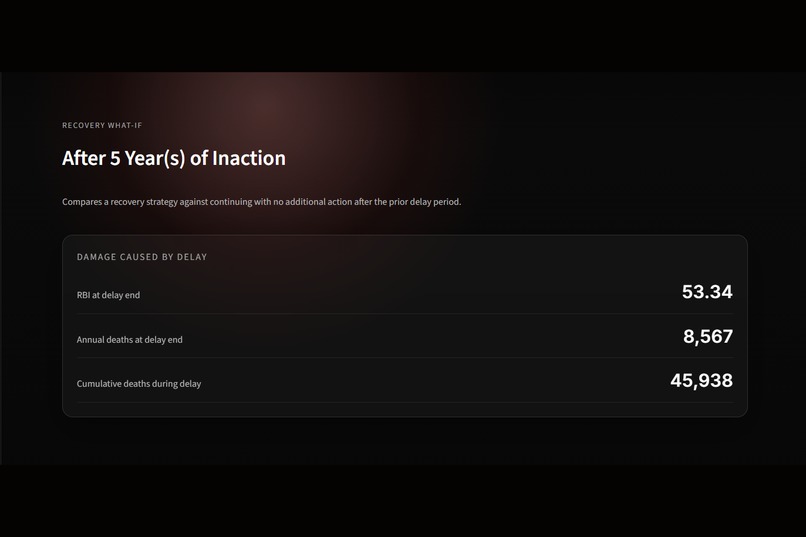
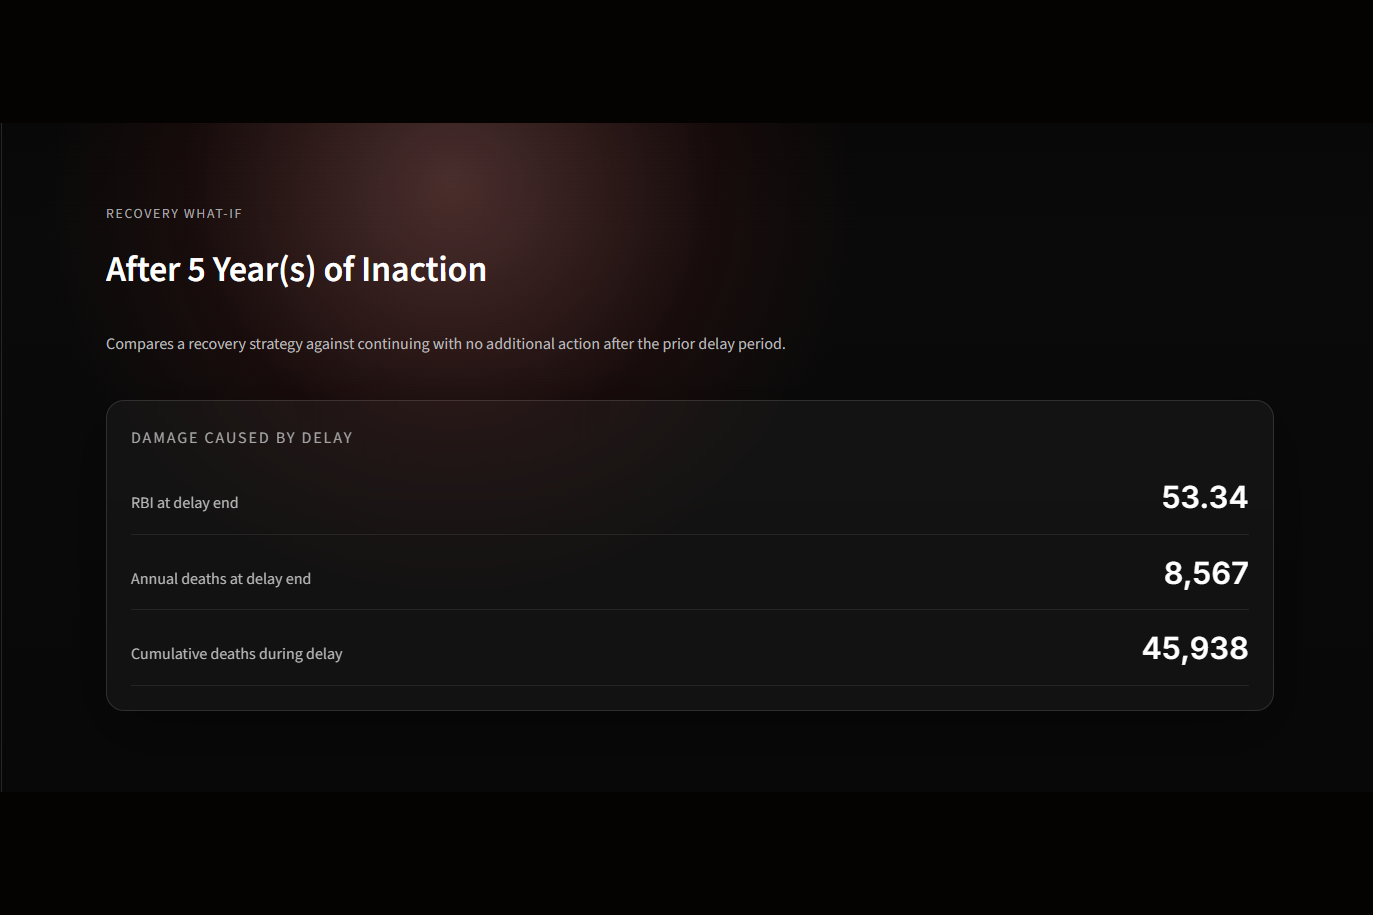
recovery-summary: A snapshot card detailing compounding system damage at the final year of policy inaction.
-
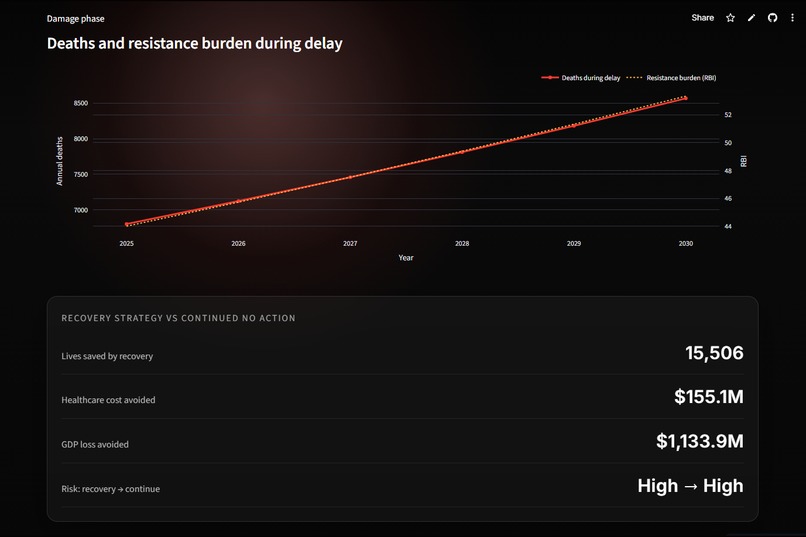
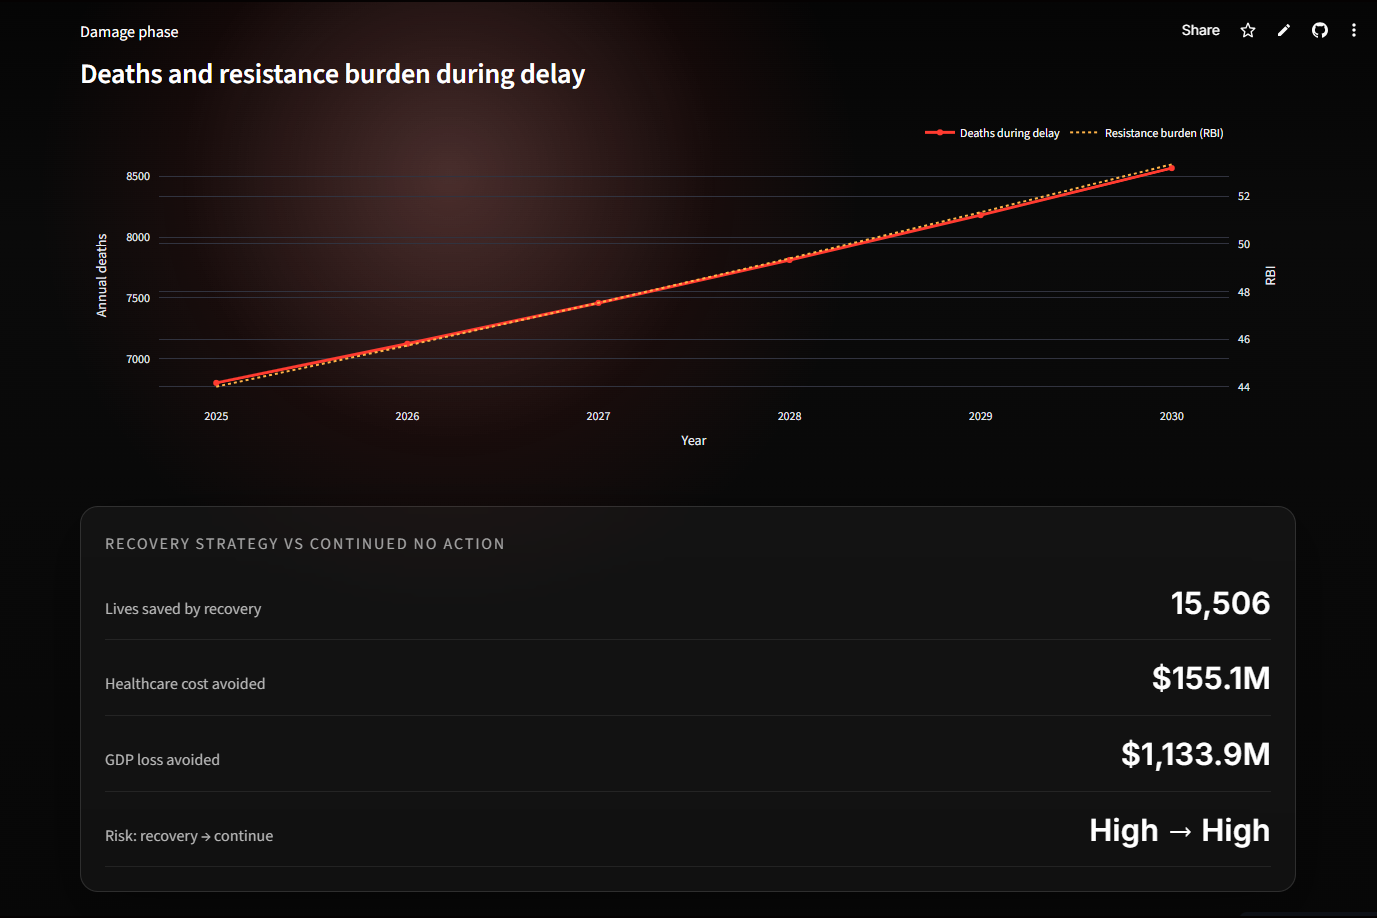
deaths-resistance-chart: A line graph mapping ascending annual deaths against the baseline Resistance Burden Index.
-
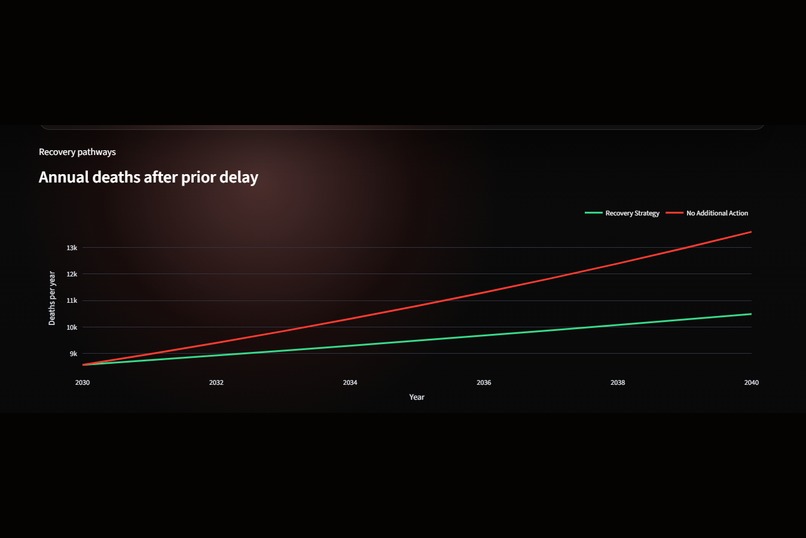
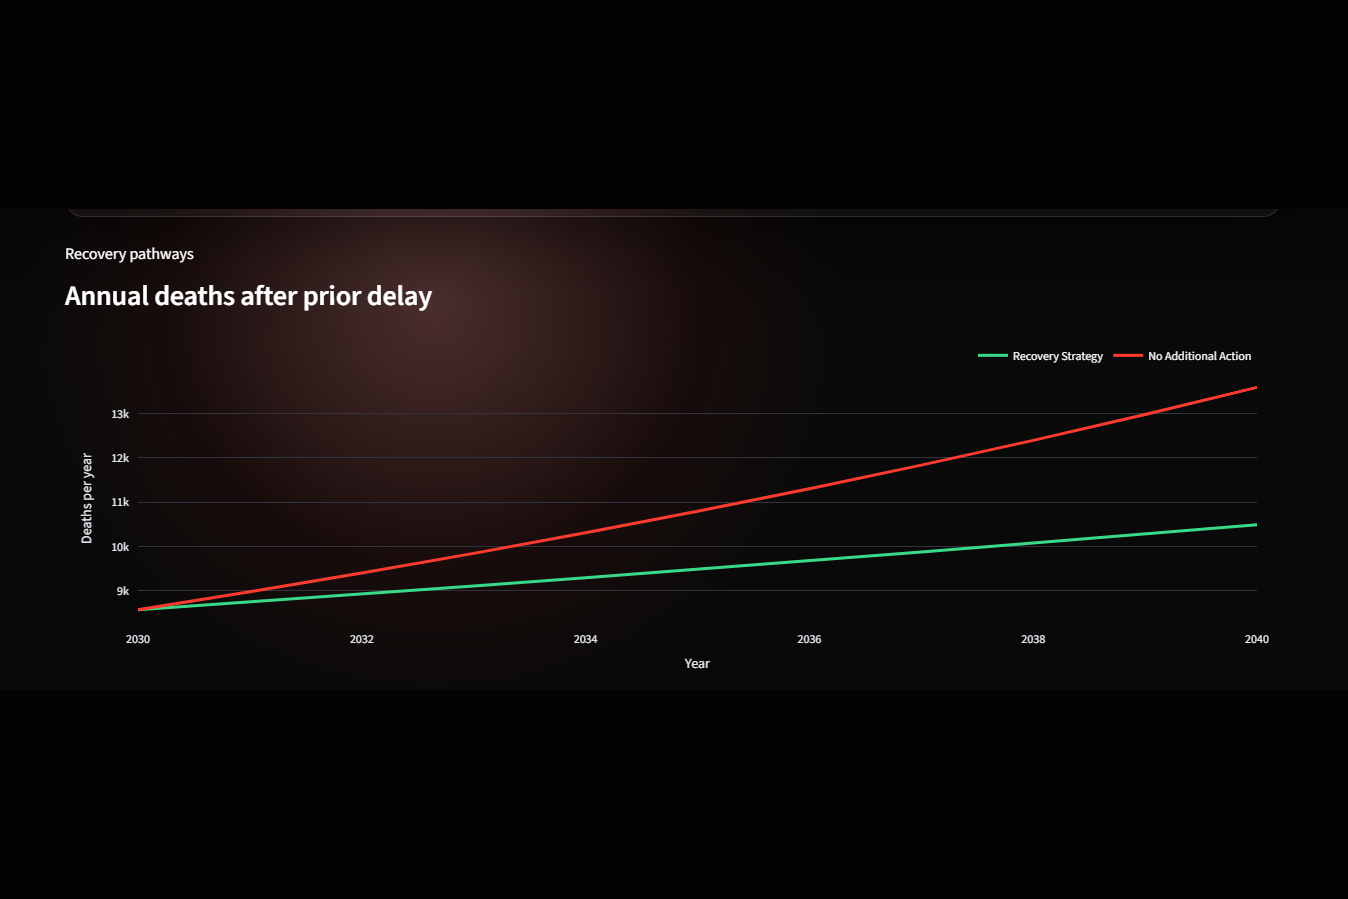
recovery-pathways: Projections contrasting an assertive recovery path against a continuation of non-action.
-
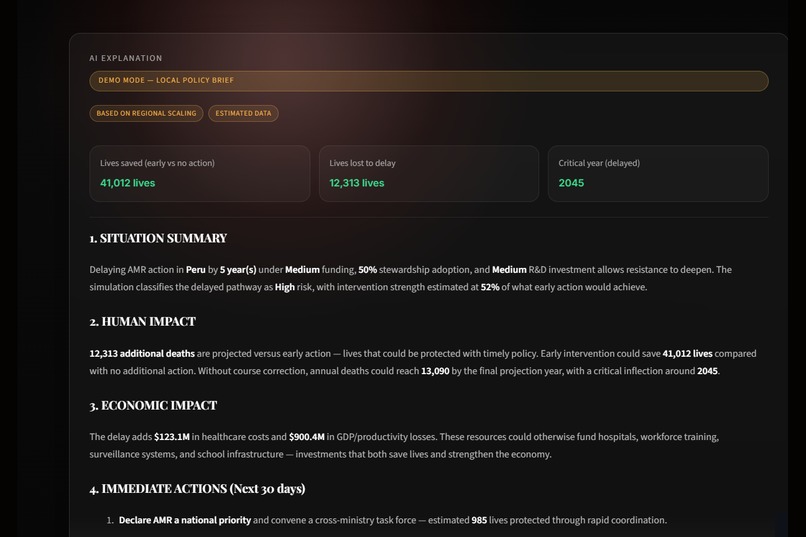
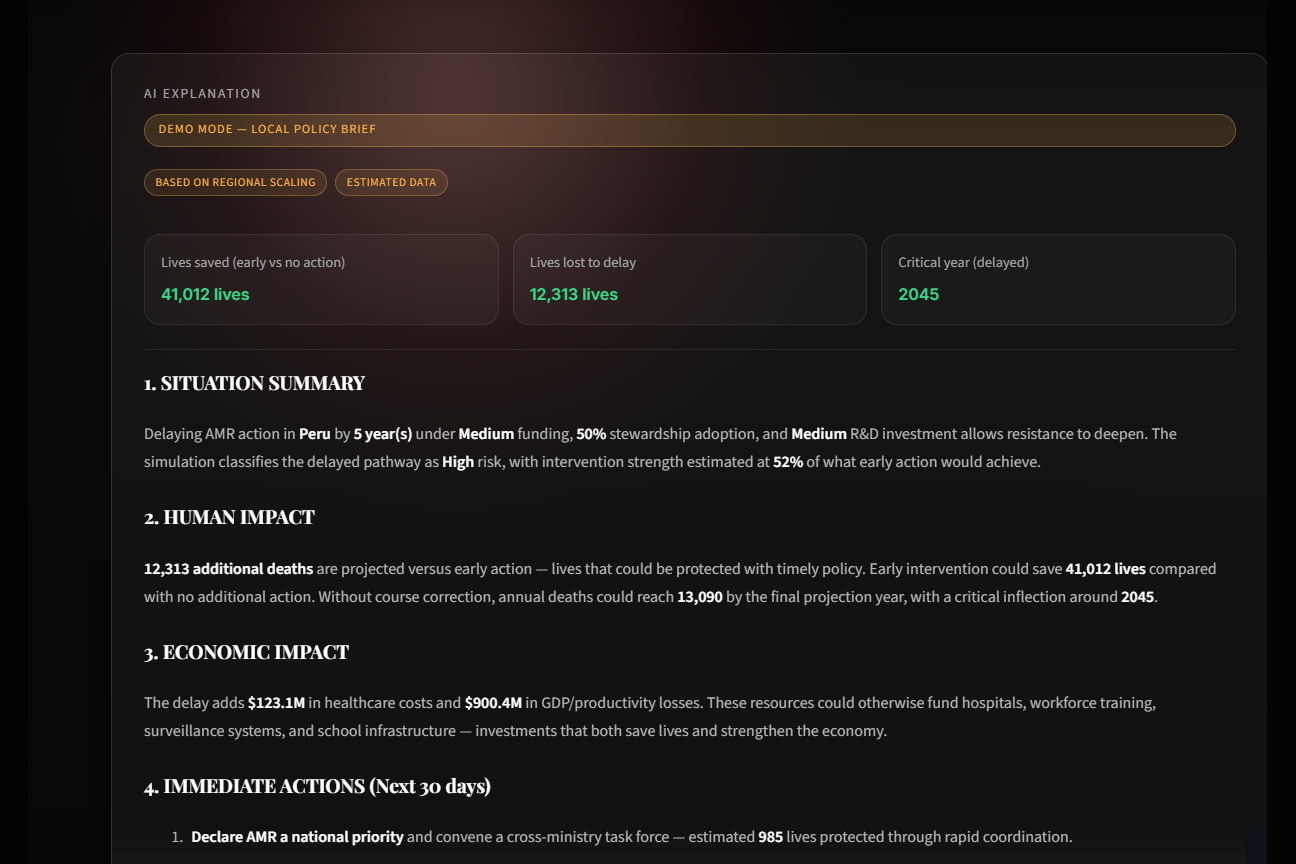
ai-explanation-1: An automated, context-hydrated executive summary detailing regional healthcare impacts.
-
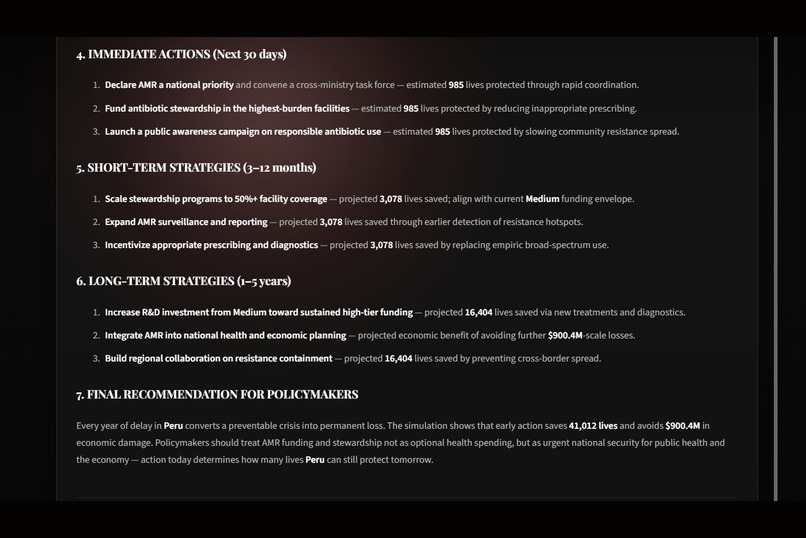
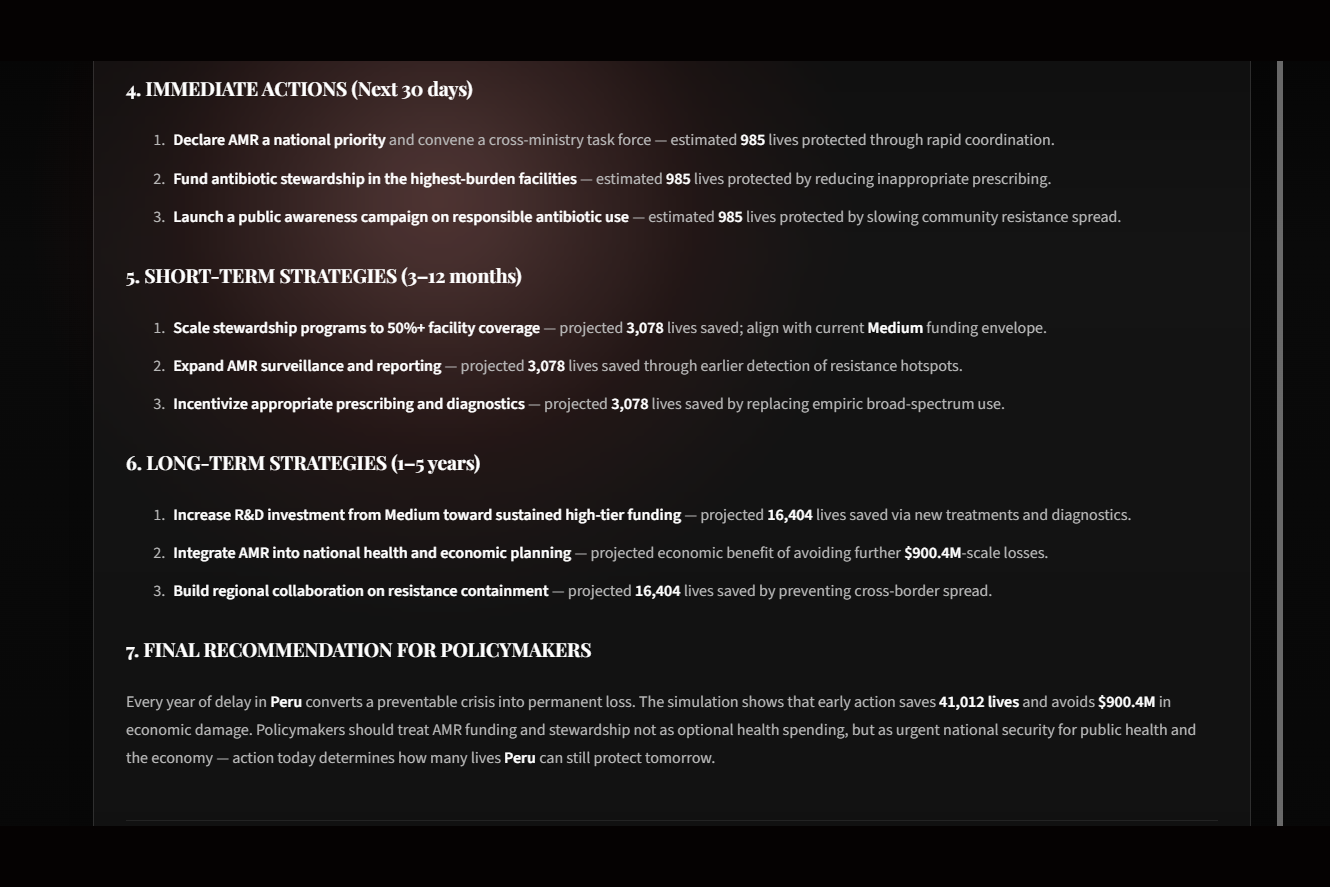
ai-explanation-2: A milestone-based policy roadmap splitting recommendations into clear 30-day, short-term, and long-term actions.
-
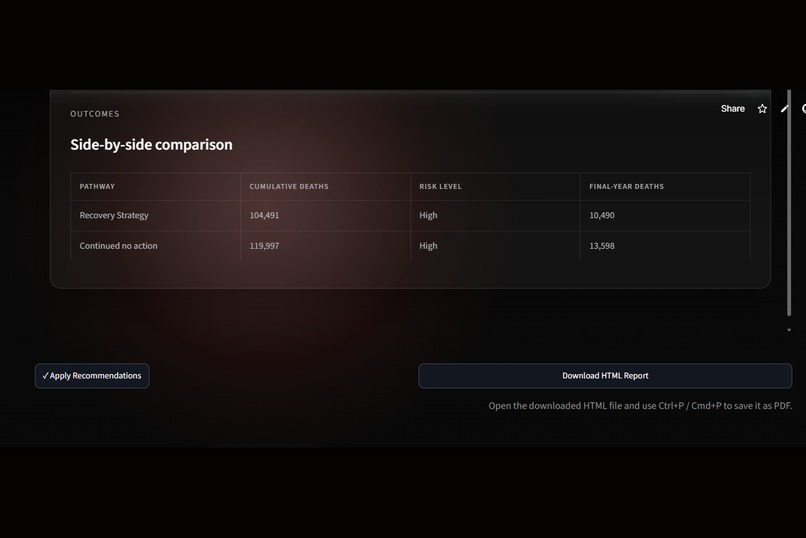
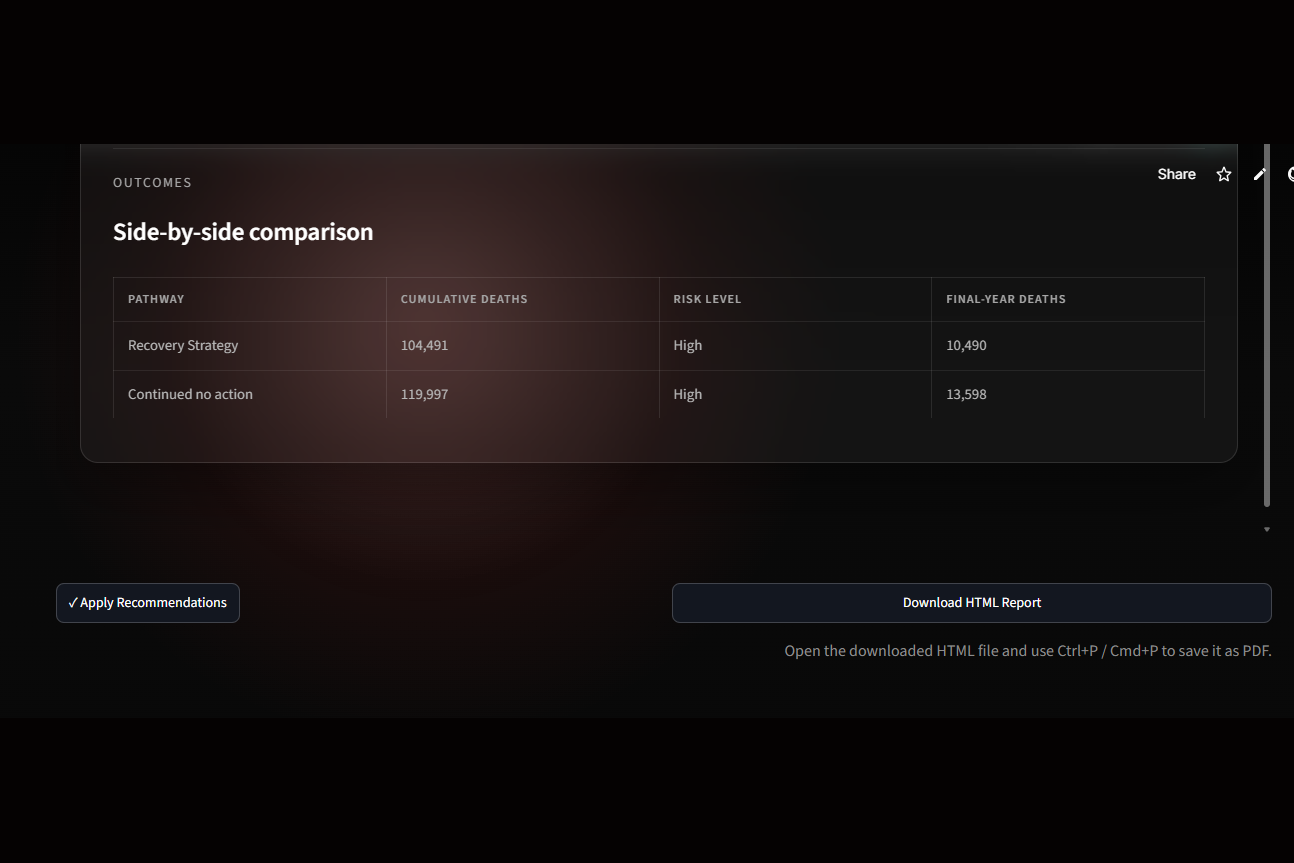
side-by-side-comparison: Matrix contrasting recovery against continued inaction on mortality, featuring an HTML report export tool.
-
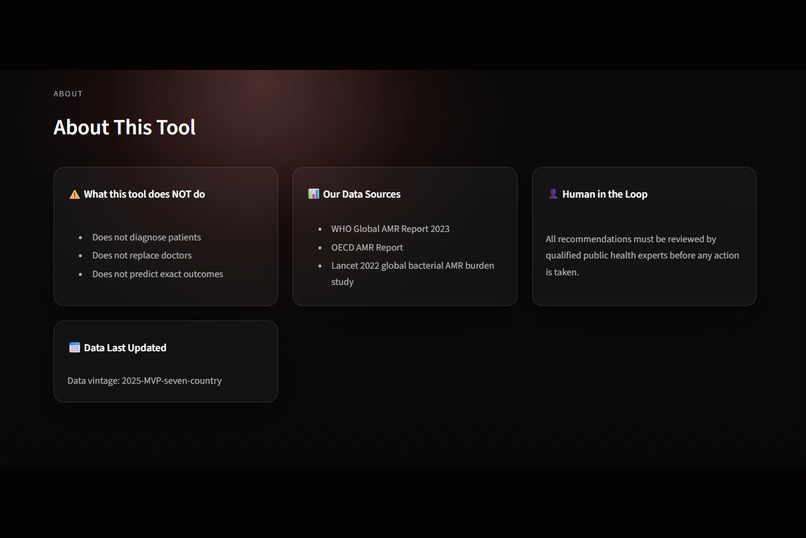
about-tool: The safety board displaying negative constraints, data source vintages, and human-in-the-loop mandates.

Inspiration
Antimicrobial Resistance (AMR) is often called the "silent pandemic." Unlike a sudden viral outbreak, AMR is a slow-burning systemic threat that compounds quietly over decades. While developing our strategy for the Public Systems & Policy challenge lane, we realized that the biggest bottleneck in combating AMR isn't a lack of clinical data—it’s a communication chasm.
Policymakers and ministries operate on fiscal budgets, electoral cycles, and explicit KPIs, whereas global health tracking is frequently published in dense, abstract epidemiological language. We were inspired to build a bridge between these two worlds. We wanted to create a tool that answers a definitive, urgent question for any leader: "If we delay investing in healthcare infrastructure or drug stewardship by just a few years, what will it actually cost our country in lives and gross domestic product (GDP)?"
What it does
ResistAI is an interactive, policy-driven simulation platform designed to model the long-term socioeconomic and human penalties of delayed action against AMR.
By inputting localized variables—such as a specific target country (e.g., Peru), years of policy inaction, initial funding baselines, and targeted stewardship adoption rates—the user can run real-time comparative projections across a 20-year horizon (2025–2045).
The platform splits the future into three distinct trajectories:
- Early Action: Proactive implementation of high-tier funding and strict stewardship.
- Delayed Action: A critical window of minimal intervention followed by an intensive recovery effort.
- No Action: A baseline decay scenario leading to catastrophic system failure.
The application instantly exposes the Cost of Inaction by quantifying the exact human toll (additional preventable deaths), healthcare system strain (excess fiscal spending), and macroeconomic damage (GDP and productivity drops), concluding with an automated, highly tailored, local policy roadmap broken down into immediate, short-term, and long-term milestones.
- Interactive "What-If" Scenario Testing: Instead of looking at a static graph, users can actively manipulate policy parameters across the timeline. By adjusting sliders for recovery funding levels, drug stewardship deployment, and localized healthcare infrastructure investments, stakeholders can immediately simulate alternative intervention strategies to see exactly how changing a public policy decision today alters their community's trajectory.
How we built it
We built ResistAI using a modular pythonic architecture that unifies deterministic forward-modeling with generative language models:
- The Predictive Engine: Built using
Pandas,NumPy, andSciPy, the analytical backend computes non-linear epidemiological trajectories and compounding economic decay. It models the Resistance Burden Index, denoted as ( RBI(t) ), as a function of time, funding baseline ( F ), and stewardship adoption rate ( S ), mapping the exact growth curve during the designated "delay phase":
$$RBI(t) = RBI_0 \cdot e^{\alpha \cdot t} \cdot (1 - \beta \cdot S)$$
- The Risk Classifier Module: A rule-based system that monitors terminal thresholds to automatically map the state of the public health infrastructure into explicit hazard bands (High or Critical).
- The Conversational NLP Layer: We designed custom prompt templates that programmatically digest the raw, multi-column simulation arrays and feed them into a generative text pipeline as context. This allows the system to auto-generate an aligned narrative executive summary where every statistical claim perfectly matches the data on the charts.
- The Interface: The entire platform is encapsulated in a responsive
Streamlitlayout, creating a scannable dashboard featuring clean sidebar inputs, side-by-side comparative matrices, dynamic trend lines, and an option to instantly download an exportable HTML brief.
Challenges we ran into
Integrating two entirely different computing models—a deterministic mathematical simulator and a generative language framework—presented a major synchronization challenge.
Initially, the text generation engine would occasionally hallucinate numbers or cite marginal metrics that drifted slightly from the raw values calculated by our mathematical arrays (for instance, citing a mismatched GDP drop compared to the visual trend line). To fix this, we strictly bound the NLP layer using tightly constrained formatting templates. We isolated the numerical variables into structured contextual injections, forcing the AI to act as a linguistic translator of the exact math arrays rather than allowing it to guess or infer statistics independently.
Accomplishments that we're proud of
- Quantifying the Invisible: We successfully turned abstract epidemiological risk curves into concrete fiscal and human metrics. Seeing our simulation cleanly demonstrate that a 5-year delay in a target country can result in thousands of additional preventable deaths and millions in economic damage makes the problem feel immediate and actionable.
- Actionable UX: We moved past the concept of a passive dashboard by implementing an interactive "Apply Recommendations" loop and data exporting feature, creating a functional, decision-ready workspace suitable for real-world government presentation.
What we learned
We learned that building impactful AI for society requires explicit boundary enforcement. Our deep dive into global datasets from the WHO, OECD, and The Lancet highlighted that global healthcare models inherently contain regional data gaps, particularly in low-income zones.
This taught us the importance of modeling responsibly. Rather than building a black box that claims to predict the definitive future, we learned to treat our system as a "What-If" scenario framework. We learned that AI's best role in public infrastructure is to accelerate human analysis, not replace human accountability.
What's next for RESIST AI
- Sub-National Granularity: Moving beyond country-wide aggregates to model localized regional risk zones, accounting for urban density variations and localized hospital supply chains.
- Interactive Multi-Lever Timelines: Allowing users to change policy intensities mid-simulation (e.g., adding a second funding boost in 2038) rather than setting fixed parameters for the entire recovery window.
- Live Policy Feed Integrations: Syncing the initial baselines with real-world, active policy database trackers to continuously update the model's underlying data vintage automatically.


Log in or sign up for Devpost to join the conversation.