-
-
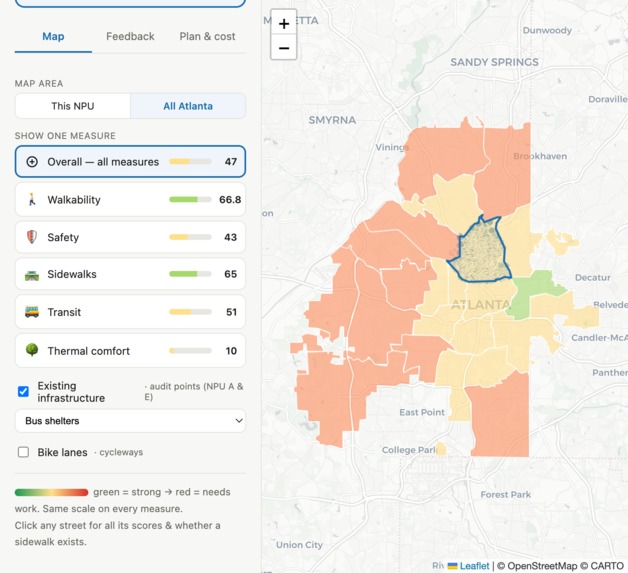
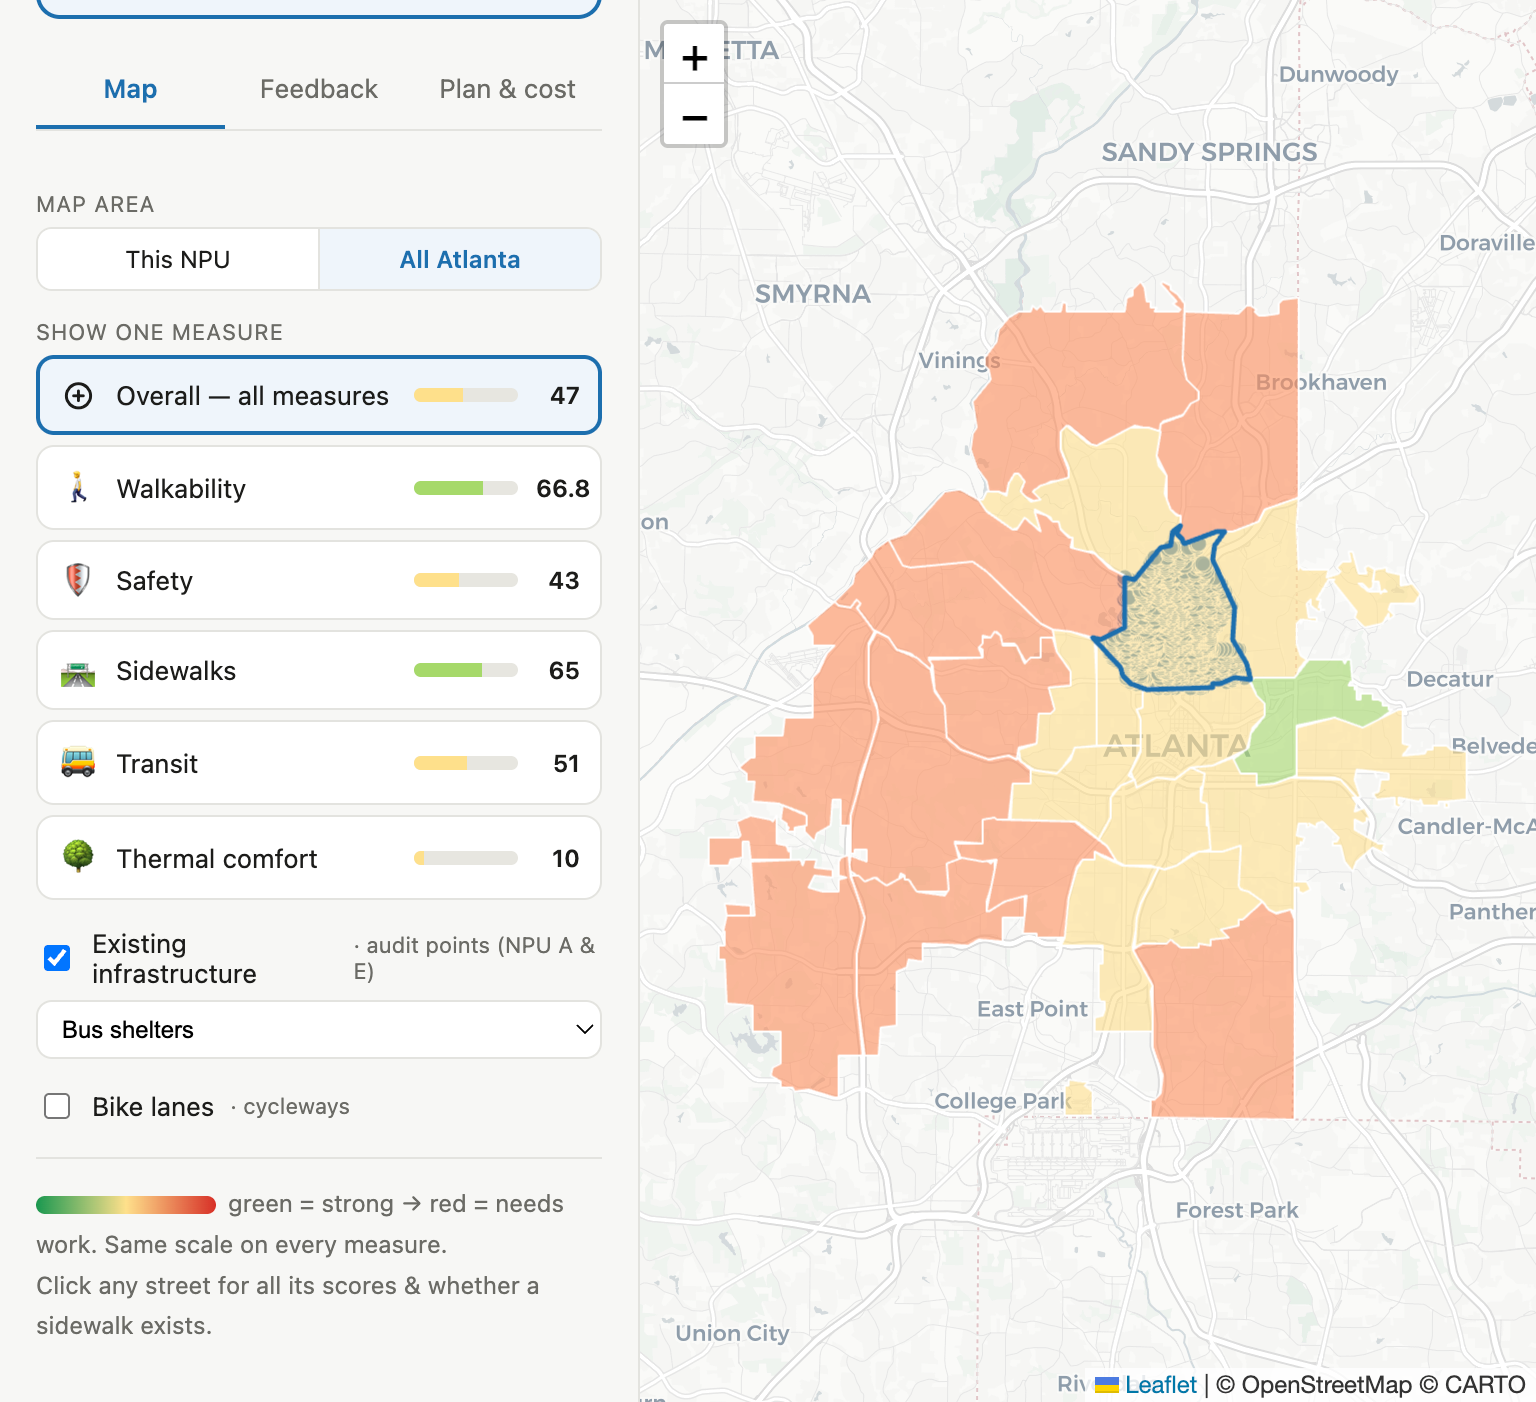
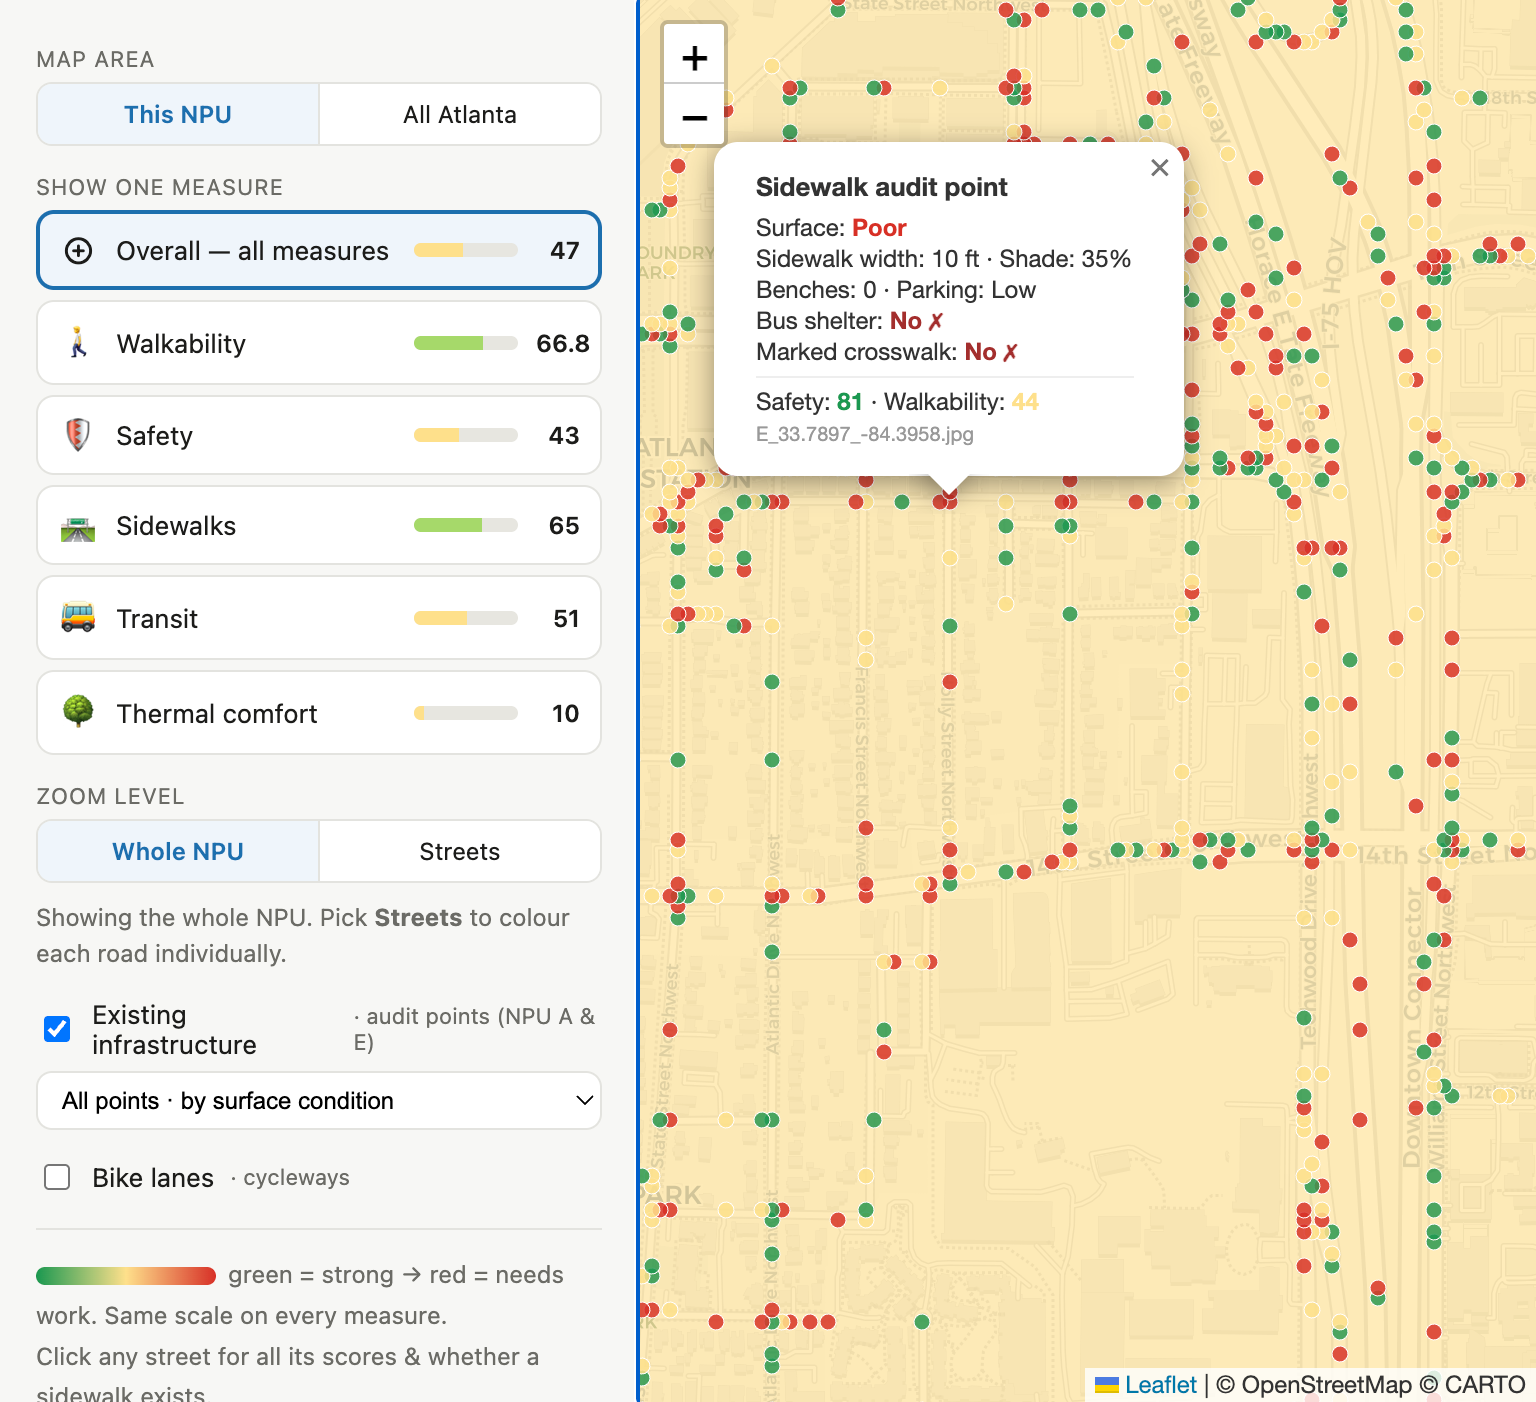
Walk It ATL Dashboard - NPU Walkability Score
-
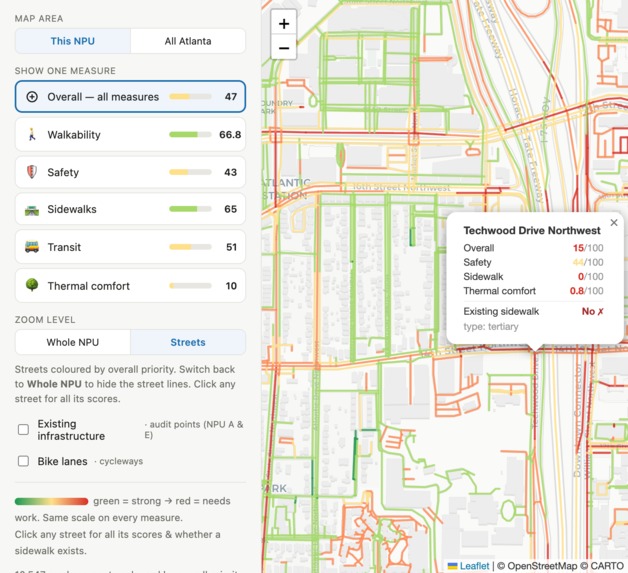
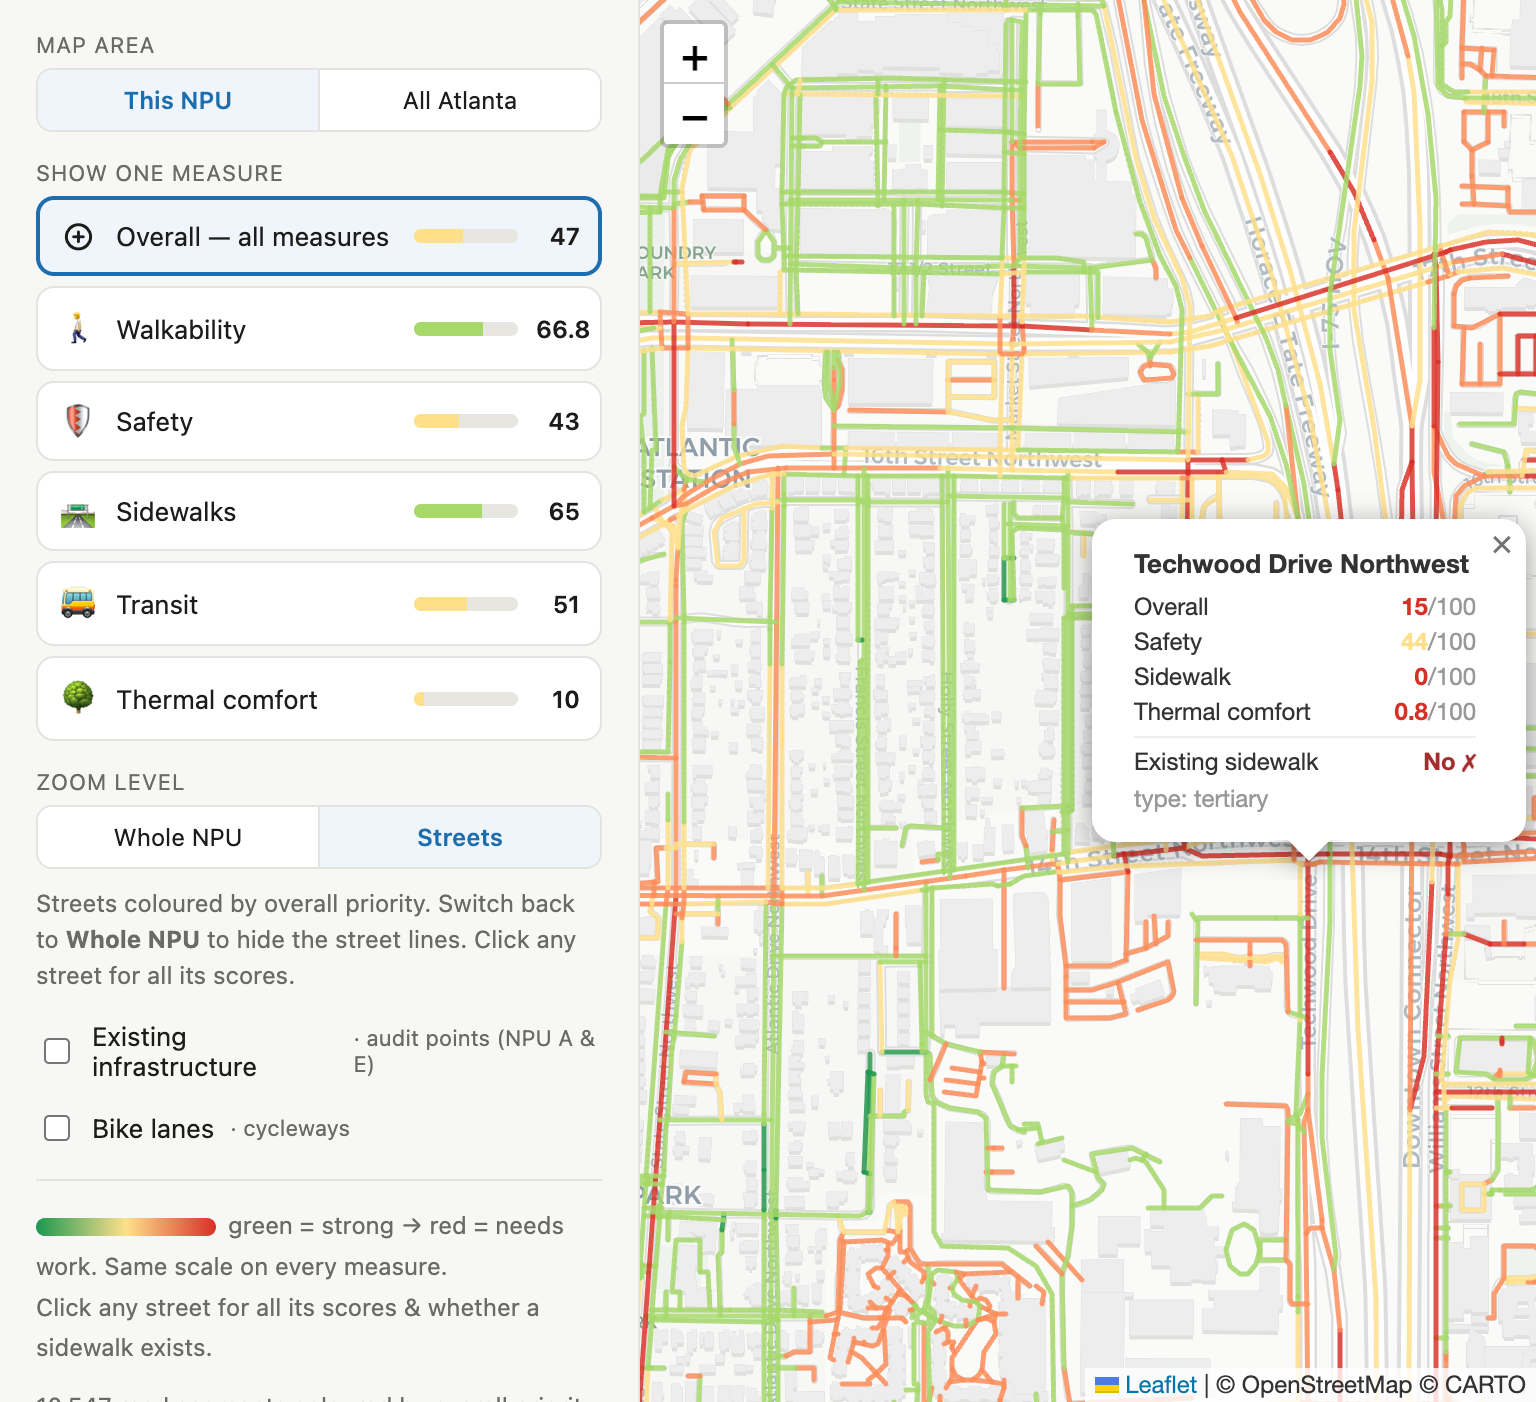
Walk It ATL Dashboard - Street Segment Walkability Score
-
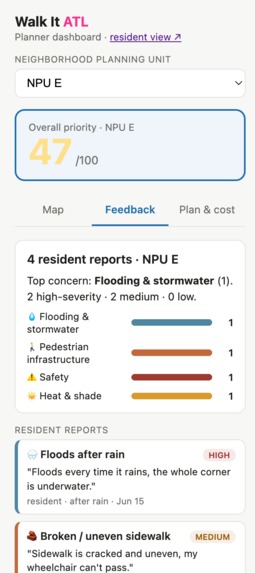
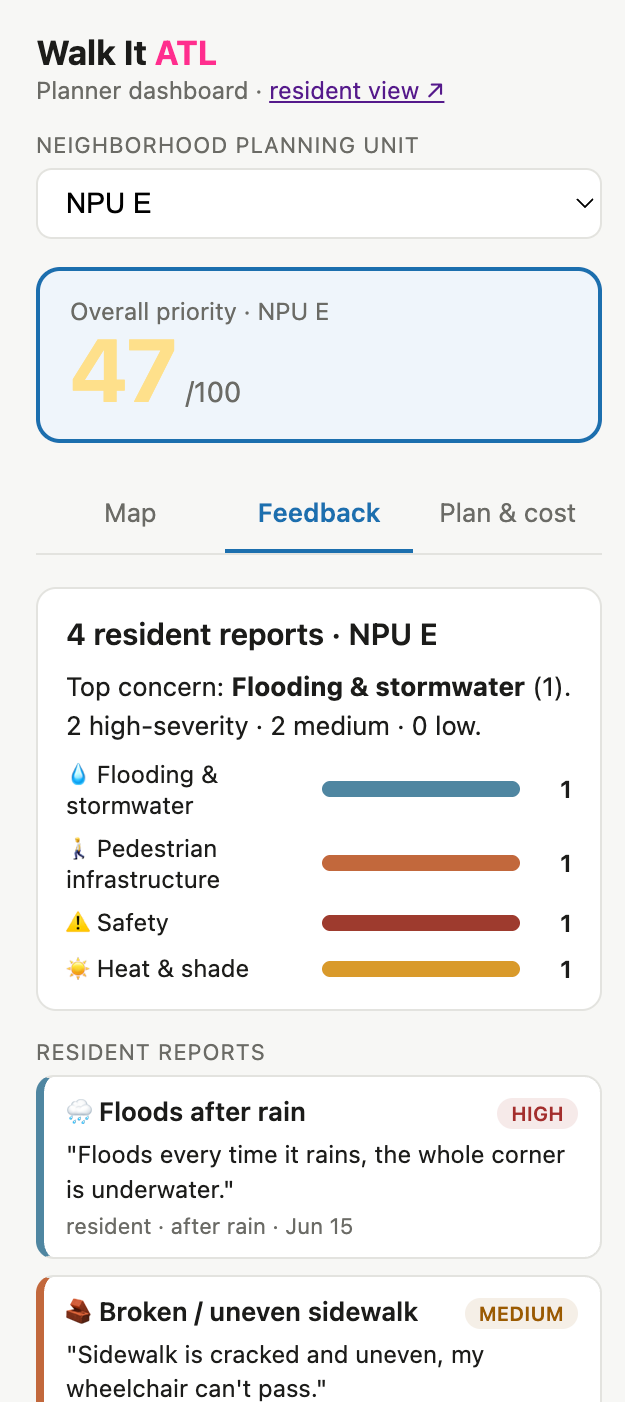
Walk It ATL Dashboard - Community Feedback
-
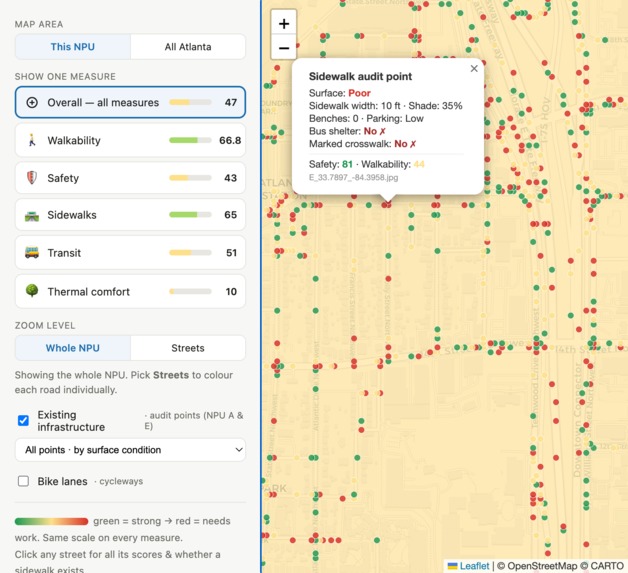
Walk It ATL Dashboard - Existing Infrastructure
-
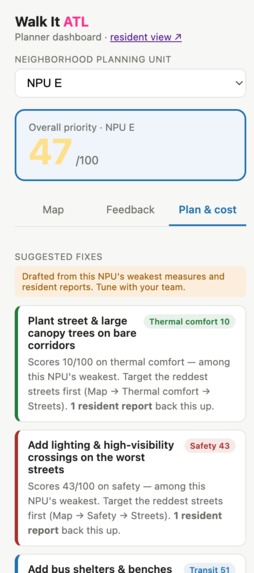
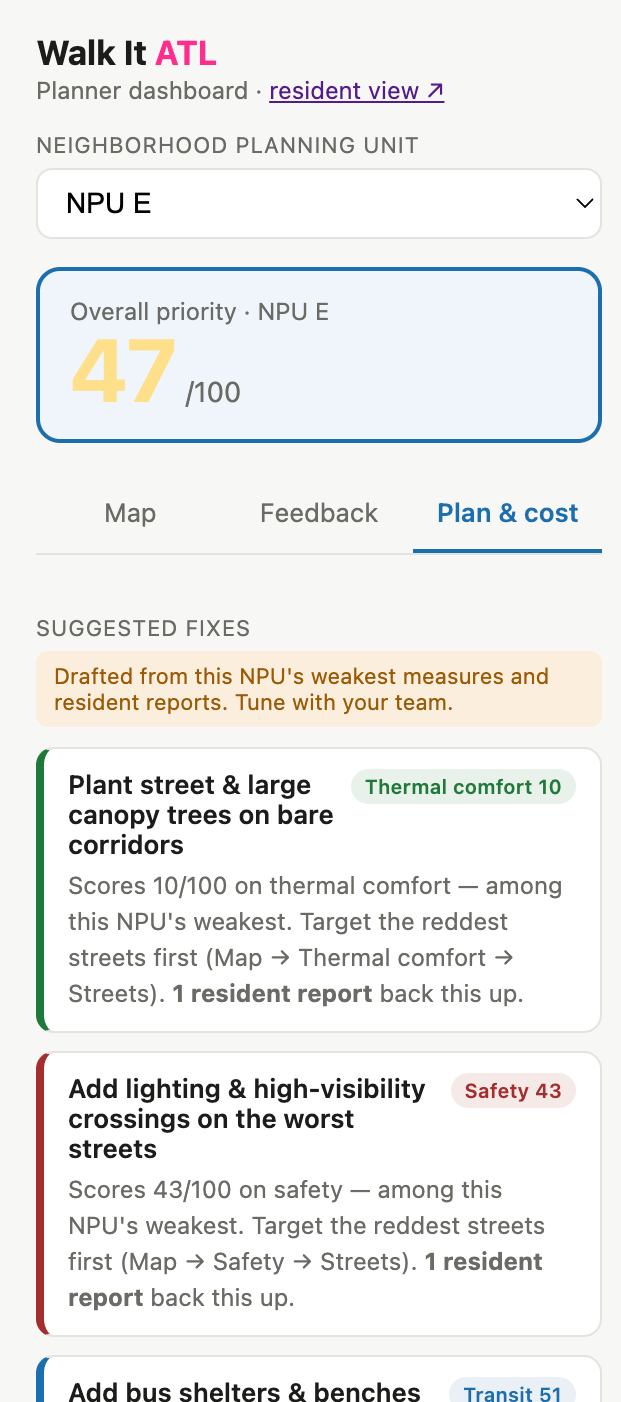
Walk It ATL Dashboard - Recommendations
-
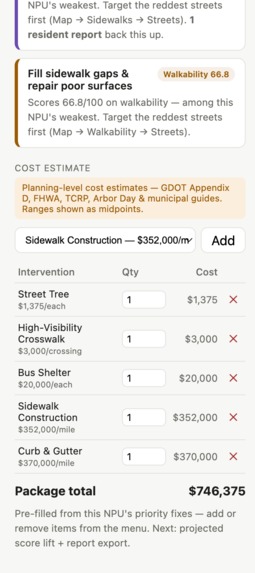
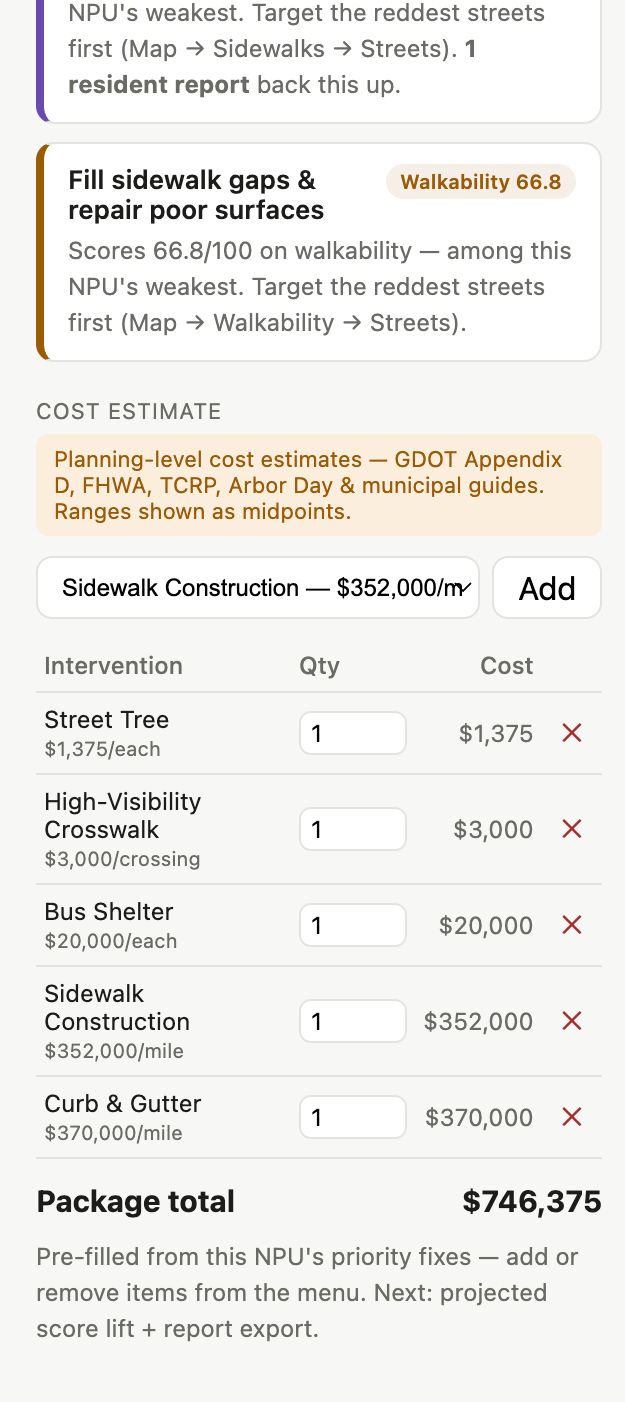
Walk It ATL Dashboard - Cost Estimates
-
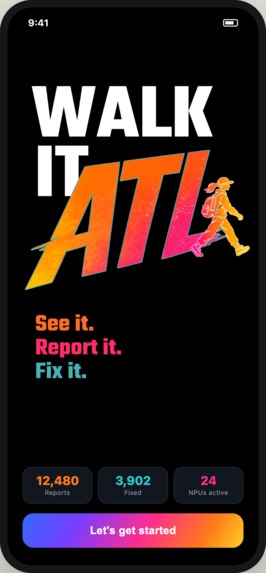
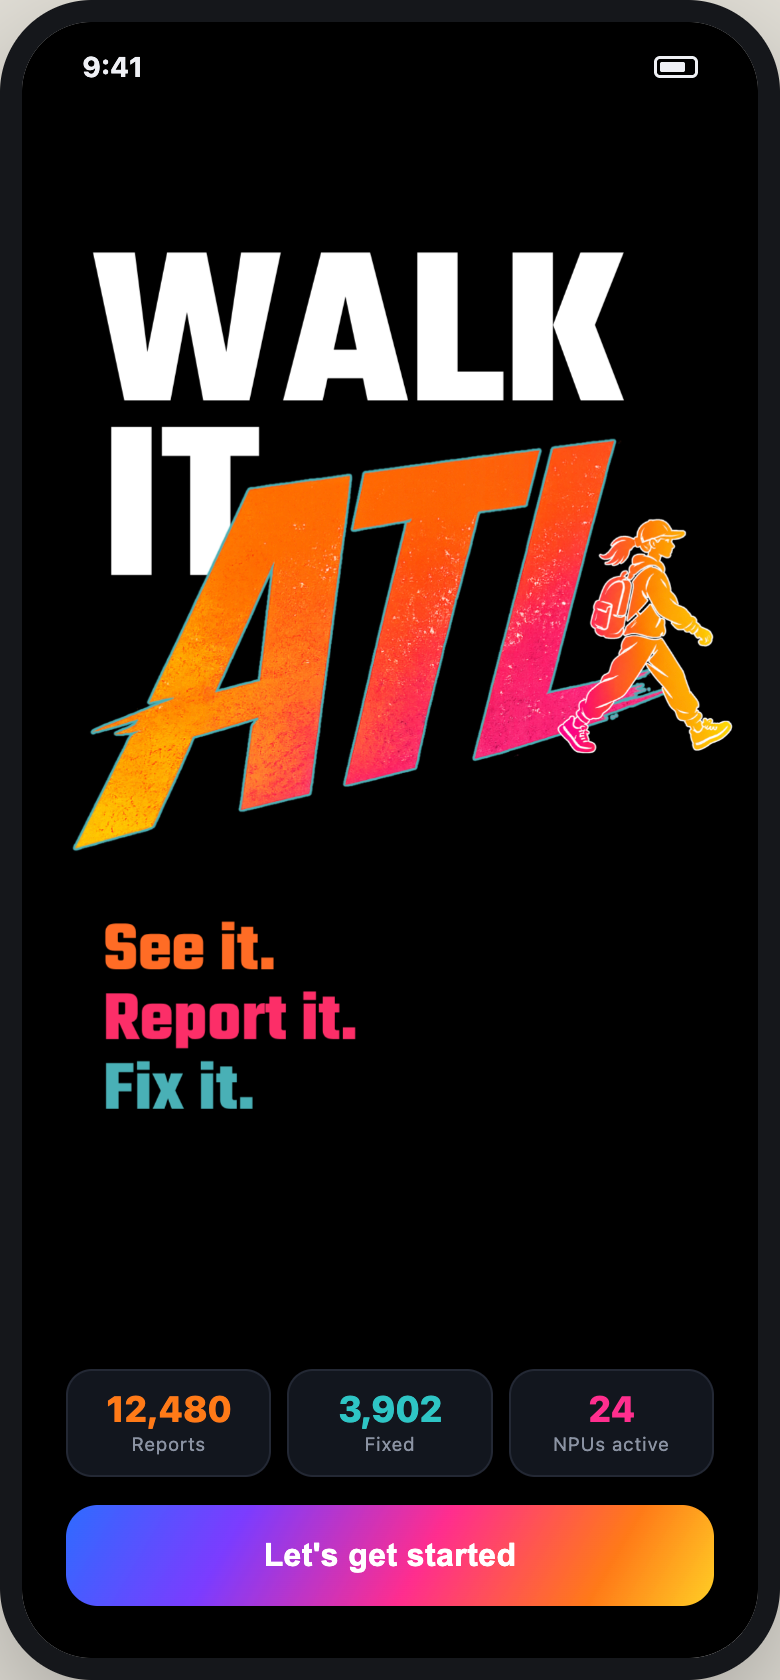
Walk It ATL App - Landing Page
-
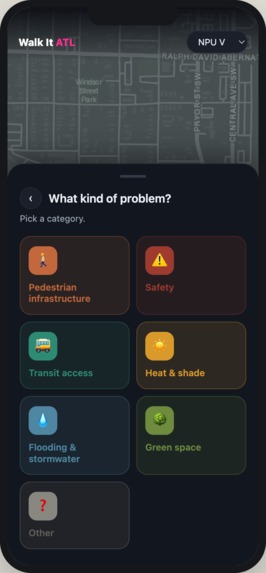
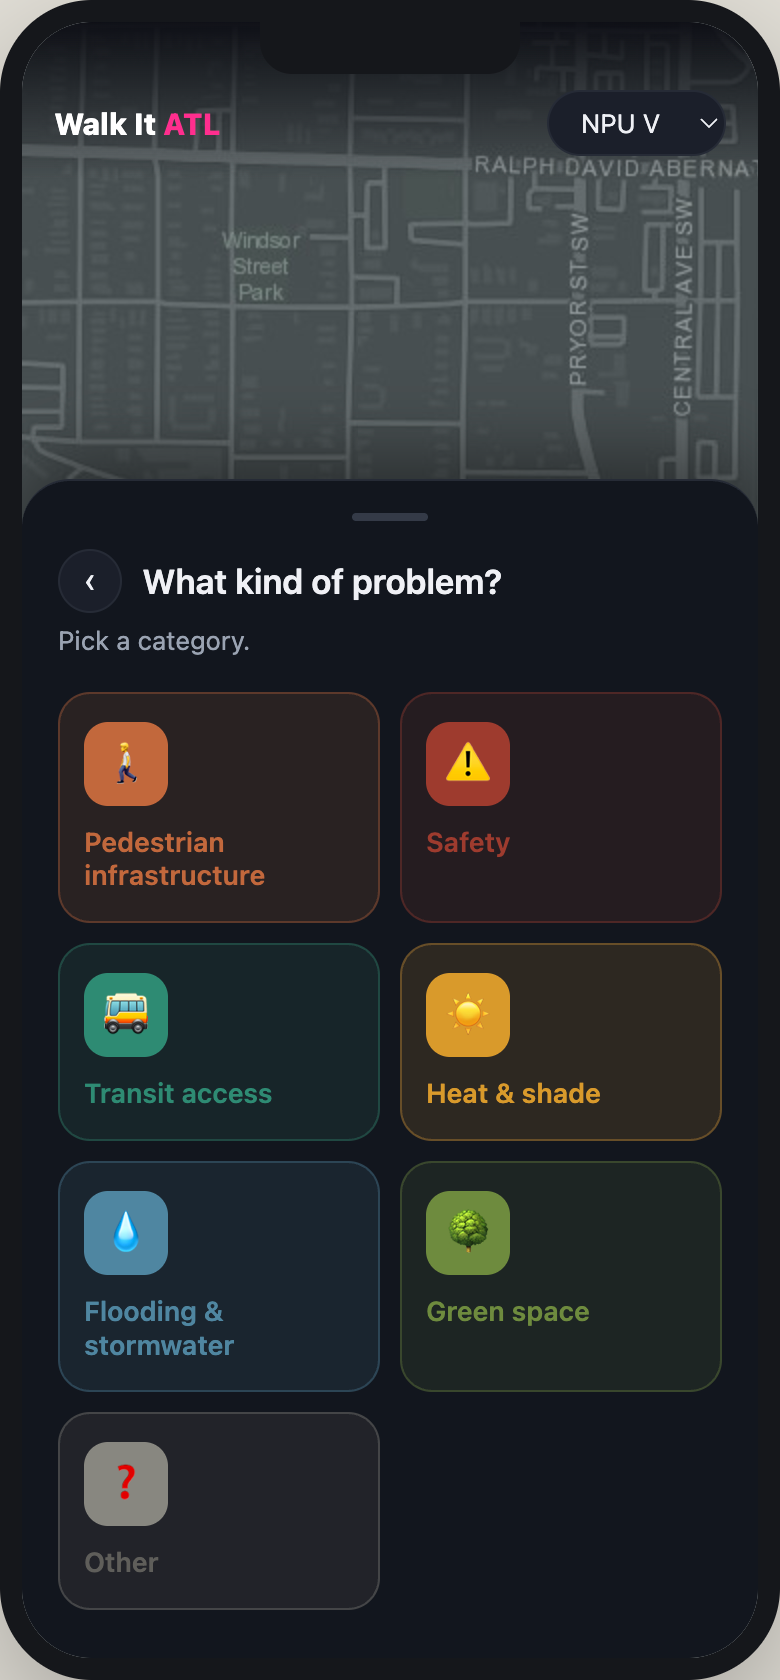
Walk It ATL App - Reporting an Issue
-
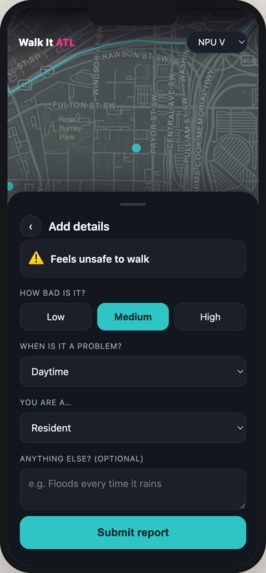
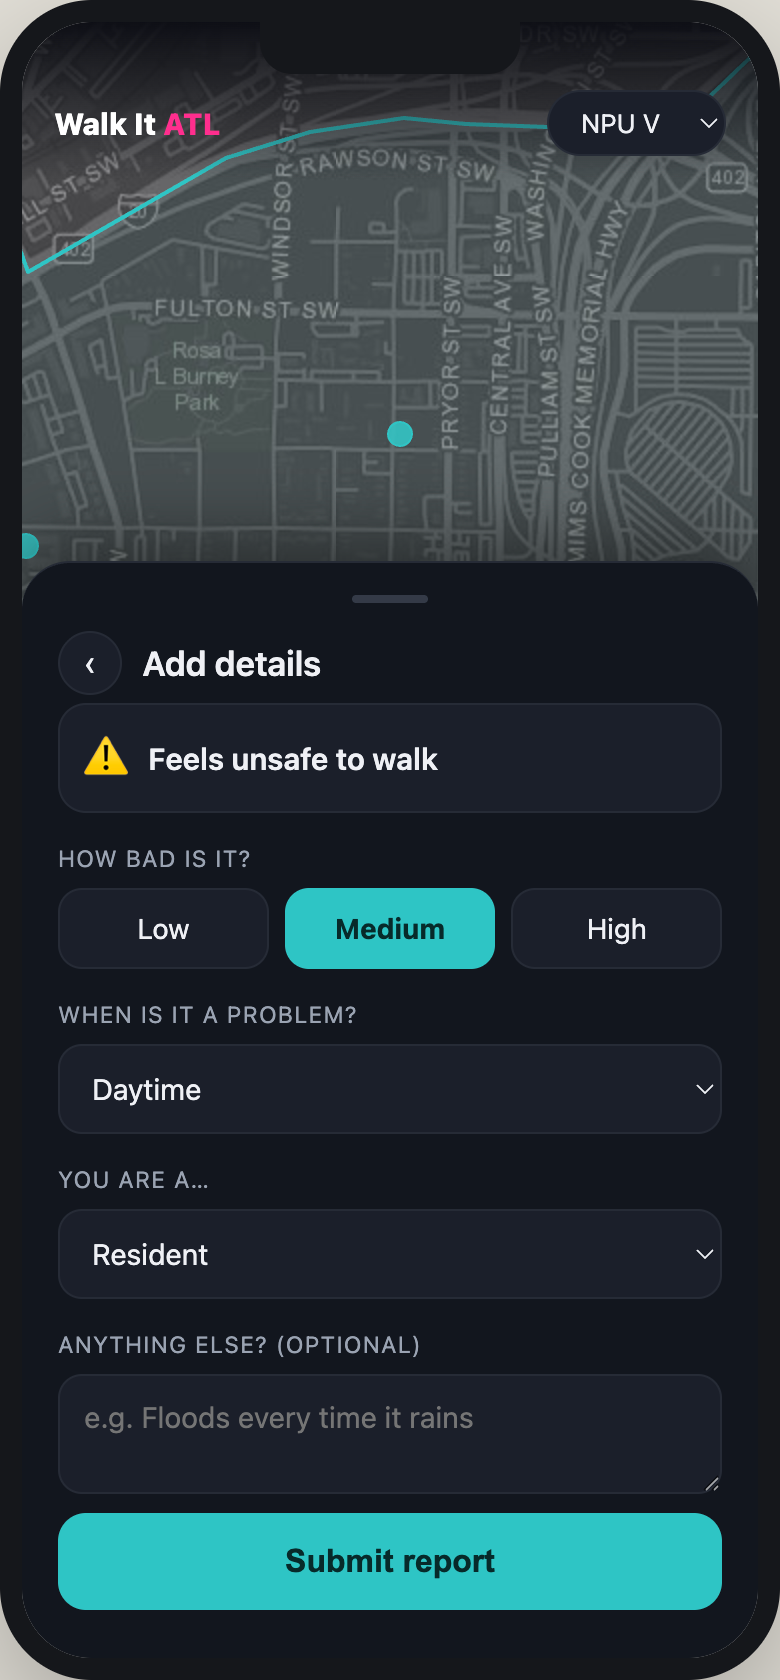
Walk It ATL App - Details for Issue
What it does
Walk It ATL is a decision-support platform that helps planners identify where pedestrian and micromobility investments will have the greatest impact. The platform analyzes sidewalk infrastructure, pedestrian safety conditions, tree canopy coverage, transit accessibility, and resident-reported concerns across Atlanta's Neighborhood Planning Units (NPUs) to generate walkability scores and identify priority areas for improvement. Users can explore conditions at both the neighborhood scale through NPU-level scores and the street scale through detailed segment-level analysis.
Residents can report issues they encounter during everyday trips, such as missing sidewalks, unsafe crossings, lack of shade, or inadequate transit amenities, through the companion Walk It ATL mobile app. These community-reported concerns are combined with objective spatial data and AI-powered infrastructure analysis to create a more comprehensive picture of neighborhood walkability and help planners identify priority areas for improvement.
The platform then generates targeted recommendations and planning-level cost estimates set by GDOT , helping cities move from identifying problems to implementing optimal solutions. The dashboard also displays existing infrastructure and amenities, allowing planners to identify service gaps, avoid duplicative investments, and prioritize improvements where they are needed most. The dashboard ensures to do a scenario assessment of the added infrastructure on the overall score for the street as well as the NPU level score.
How we built it
Walk It ATL was developed as a full-stack decision-support platform consisting of a resident-facing mobile application and a planner-facing analytics dashboard.
We began by assembling and integrating multiple geospatial datasets from sources including ArcGIS Living Atlas for Land surface twmprature, Atlanta Regional Commission, OpenStreetMap, Georgia DOT cost data , Atlanta Police Department crime and traffic crash data, publicly available transit and environmental datasets like the tree canopy, air temprature fpr afternoon. These datasets were processed using ArcGIS Pro, Python, and GIS workflows to create neighborhood-level and street-level indicators related to walkability, safety, comfort, transit accessibility, and infrastructure quality.
For the safety component, we generated high-density street analysis points and linked them with crime and crash records using spatial joins and severity-weighted scoring methods for each crime type. To better understand on-the-ground conditions, we built an automated Google Street View image collection pipeline and used computer vision techniques to identify pedestrian infrastructure characteristics such as sidewalks, crossings, shade coverage, and streetscape features as well as rated them on their present condition using Machine learning techniques.
For the comfort analysis, we integrated environmental datasets including land surface temperature, air temperature, heat severity, tree canopy coverage, and sidewalk accessibility. Raster layers were clipped, normalized, and assigned to street segments using spatial analysis techniques to create a Pedestrian Comfort Index that identifies corridors experiencing elevated thermal stress.
These indicators were aggregated into neighborhood-level and street-level scores that power the planner dashboard. The dashboard enables users to explore conditions across Atlanta's Neighborhood Planning Units (NPUs), identify infrastructure gaps, compare conditions across neighborhoods, and visualize resident-reported concerns.
To move beyond problem identification, we developed a recommendation and scenario-planning module that generates infrastructure improvement strategies and planning-level cost estimates. This allows planners to compare alternatives, evaluate trade-offs, and prioritize investments based on both impact and budget constraints.
The resident-facing mobile application serves as a community engagement tool, allowing users to report walkability concerns encountered during daily trips. These reports are integrated directly into the planner dashboard, creating a continuous feedback loop between residents and decision-makers.
Challenges we ran into
One of our biggest challenges was obtaining and integrating pedestrian infrastructure data at a consistent level of detail. Sidewalks, crossings, pedestrian amenities, transit infrastructure, and streetscape features often exist across different agencies, formats, and levels of completeness, making it difficult to create a unified citywide framework.
Another challenge was translating environmental raster datasets, such as land surface temperature, heat severity, and tree canopy coverage, into meaningful street-level metrics. Since many environmental datasets are available at coarser spatial resolutions than individual road segments, we had to develop methods to assign environmental conditions to pedestrian corridors while maintaining spatial accuracy.
Building the Street View and infrastructure assessment workflow also presented challenges. Automating image collection, linking images to geographic locations, and extracting meaningful infrastructure characteristics required careful coordination between geospatial analysis and computer vision workflows.
From a planning perspective, balancing objective data with community experiences was equally challenging. Many barriers to walking, such as perceived safety, comfort, or accessibility concerns, are difficult to capture through traditional datasets alone. Designing a platform that meaningfully combines resident feedback with spatial analytics required continuous iteration throughout development.
Finally, one of the most difficult challenges was moving beyond identifying problems to recommending actionable solutions. We wanted Walk It ATL to function as a decision-support platform rather than simply another mapping dashboard, which led us to develop the recommendation engine, cost estimation framework, and scenario-planning capabilities.
Accomplishments that we're proud of
1) Developed both a resident-facing mobile app and a planner-facing dashboard, creating a direct connection between community experiences and planning decisions.
2) Built a walkability framework that combines pedestrian infrastructure, safety, tree canopy coverage, and transit access into a single decision-support tool.
3) Created neighborhood-level (NPU) and street-segment level analyses, allowing users to identify both broad trends and localized barriers.
4) Developed an automated recommendation system that generates targeted infrastructure improvements and planning-level cost estimates, helping planners move from identifying problems to implementing solutions.
What we learned
This project highlighted the challenges of measuring walkability using real-world infrastructure data. We learned that datasets such as sidewalks, pedestrian amenities, and street-level conditions are often incomplete, fragmented, or inconsistently mapped.
We also learned that community knowledge is just as important as traditional datasets. Many barriers to walking, such as feeling unsafe crossing a street, lack of shade, or poor sidewalk conditions, are difficult to capture through data alone. Combining resident feedback with objective analysis creates a more complete understanding of neighbourhood conditions.
From a technical perspective, we gained experience working with GIS analysis, geospatial data processing, infrastructure scoring, spatial joins, dashboard development, and integrating AI-powered approaches into planning workflows.
What's next for Walk It ATL
Future versions of Walk It ATL will incorporate climate resilience and equity considerations into the decision-making process. In addition to evaluating pedestrian infrastructure, safety, tree canopy, and transit access, the platform could integrate environmental risk indicators such as flood exposure, extreme heat vulnerability, stormwater flooding, and air quality.
We also plan to develop an equity multiplier that prioritizes investments in neighbourhoods facing greater social and environmental challenges. By incorporating measures of socioeconomic vulnerability, transportation disadvantage, age, disability, and environmental justice indicators, the platform could help ensure that limited public resources are directed toward communities with the greatest need.
Built With
- adobe-creative-sdk
- arcgisonlineatlas
- esri
- geopandas
- googlestreetviewimages
- machine-learning
- osm
- overpassturbo
- pandas
- python
- pytorch
- usgsdata
- webscrapping

Log in or sign up for Devpost to join the conversation.