
Resilience Rewired
Tagline: A household is only as safe as its buffer. We show which accounts would last less than 3 months if their income dropped, why that happens, and how to fix it.
Built with: Snowflake, Snowpark, Streamlit in Snowflake, Snowflake ML Top Insights, Cortex, Python, SQL
Inspiration
Banks look at income and credit scores. But a job loss, a car repair or a jump in bills hits the buffer: how many months of savings someone has. We wanted to measure that "runway" for every customer and test it against the challenge scenarios.
What it does
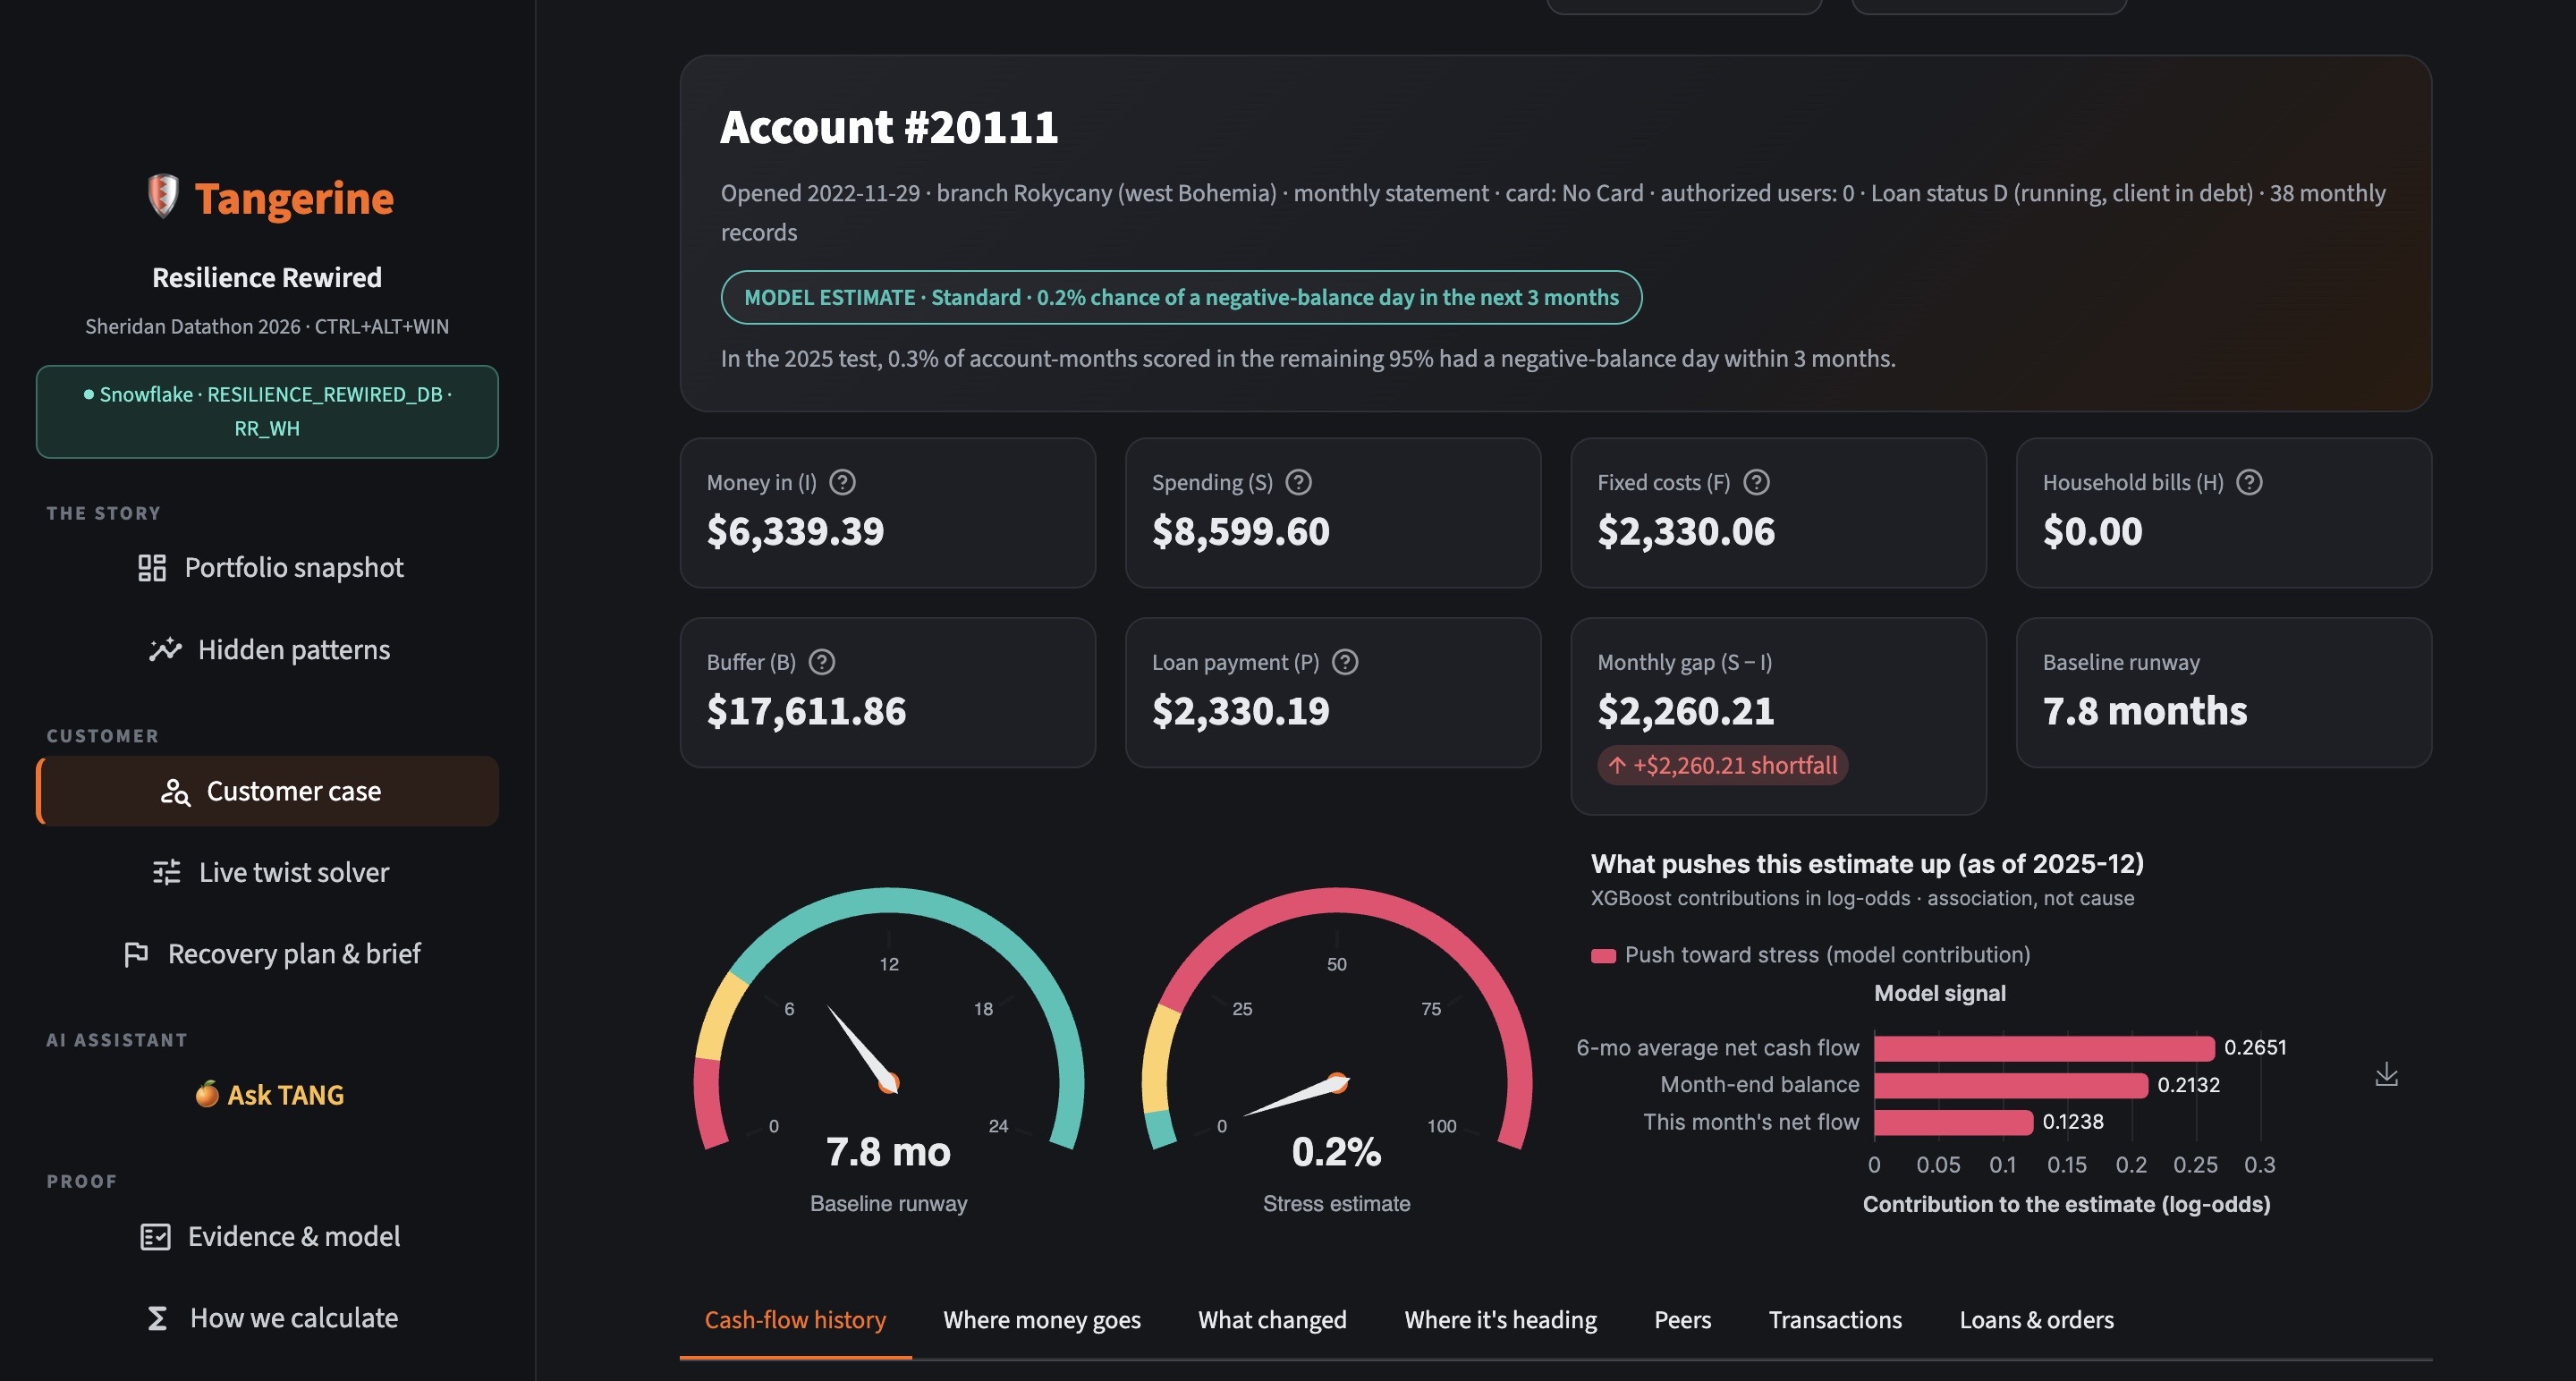
- Runway for 4,500 accounts. Built from money in (I), spending (S), buffer (B) and fixed costs (F).
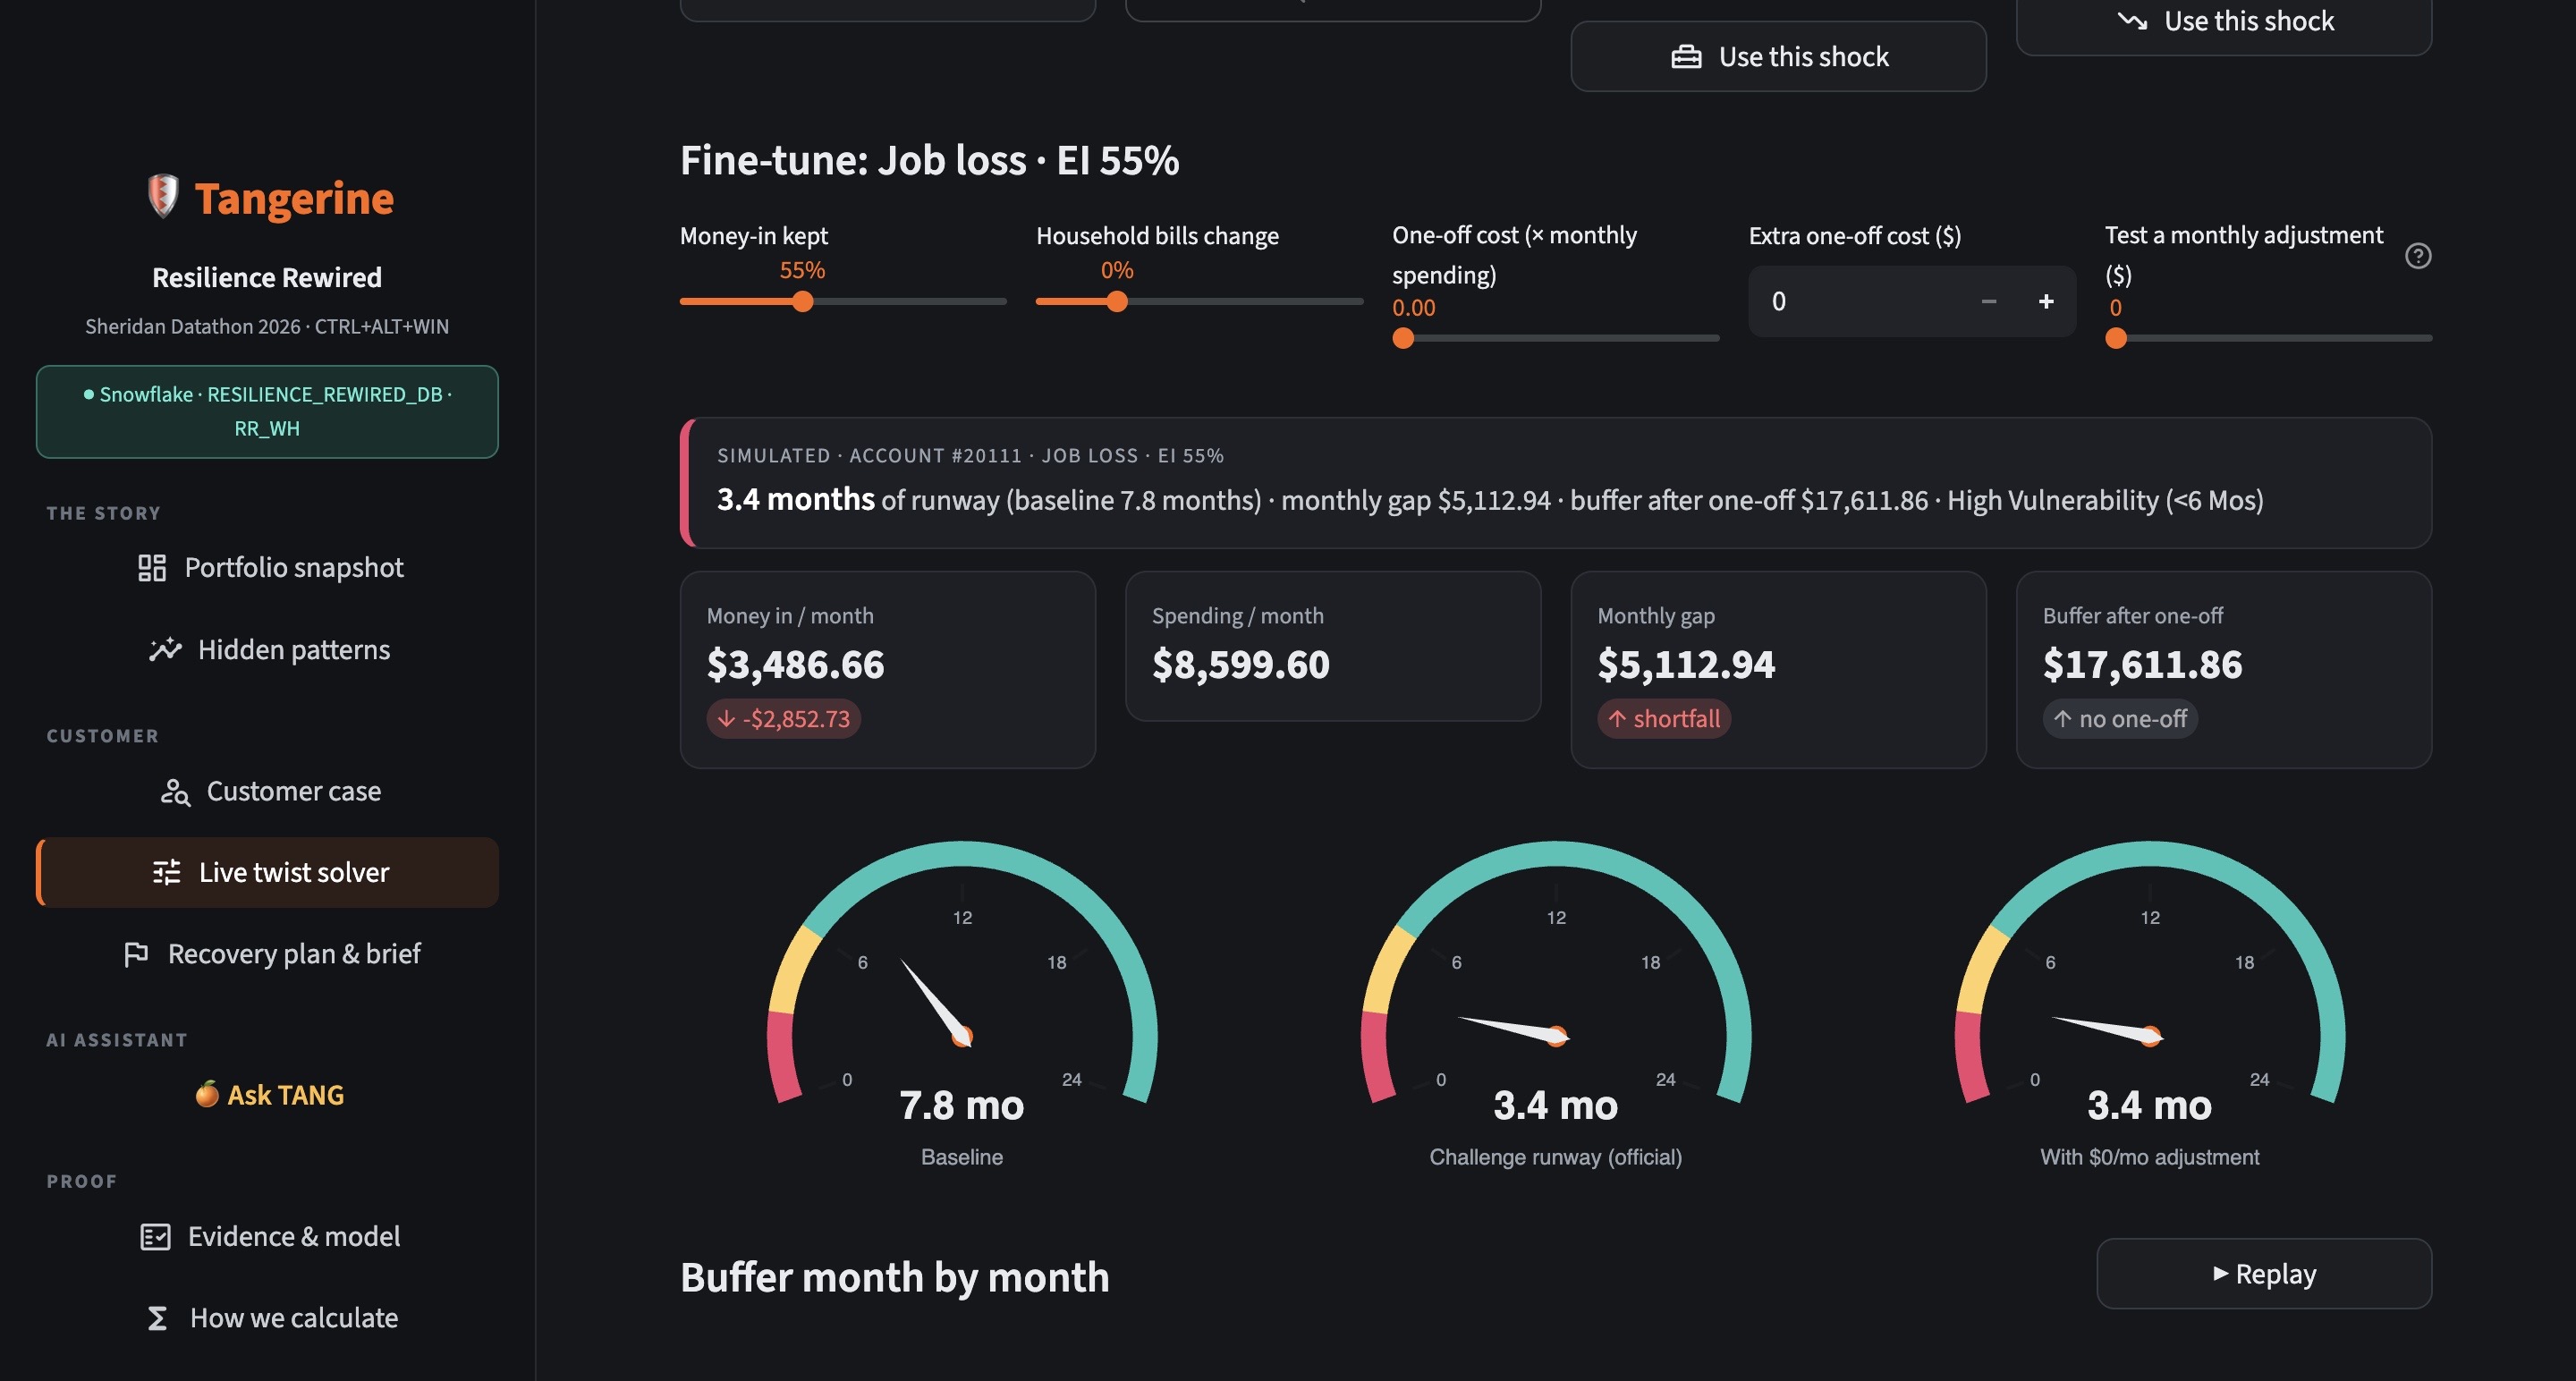
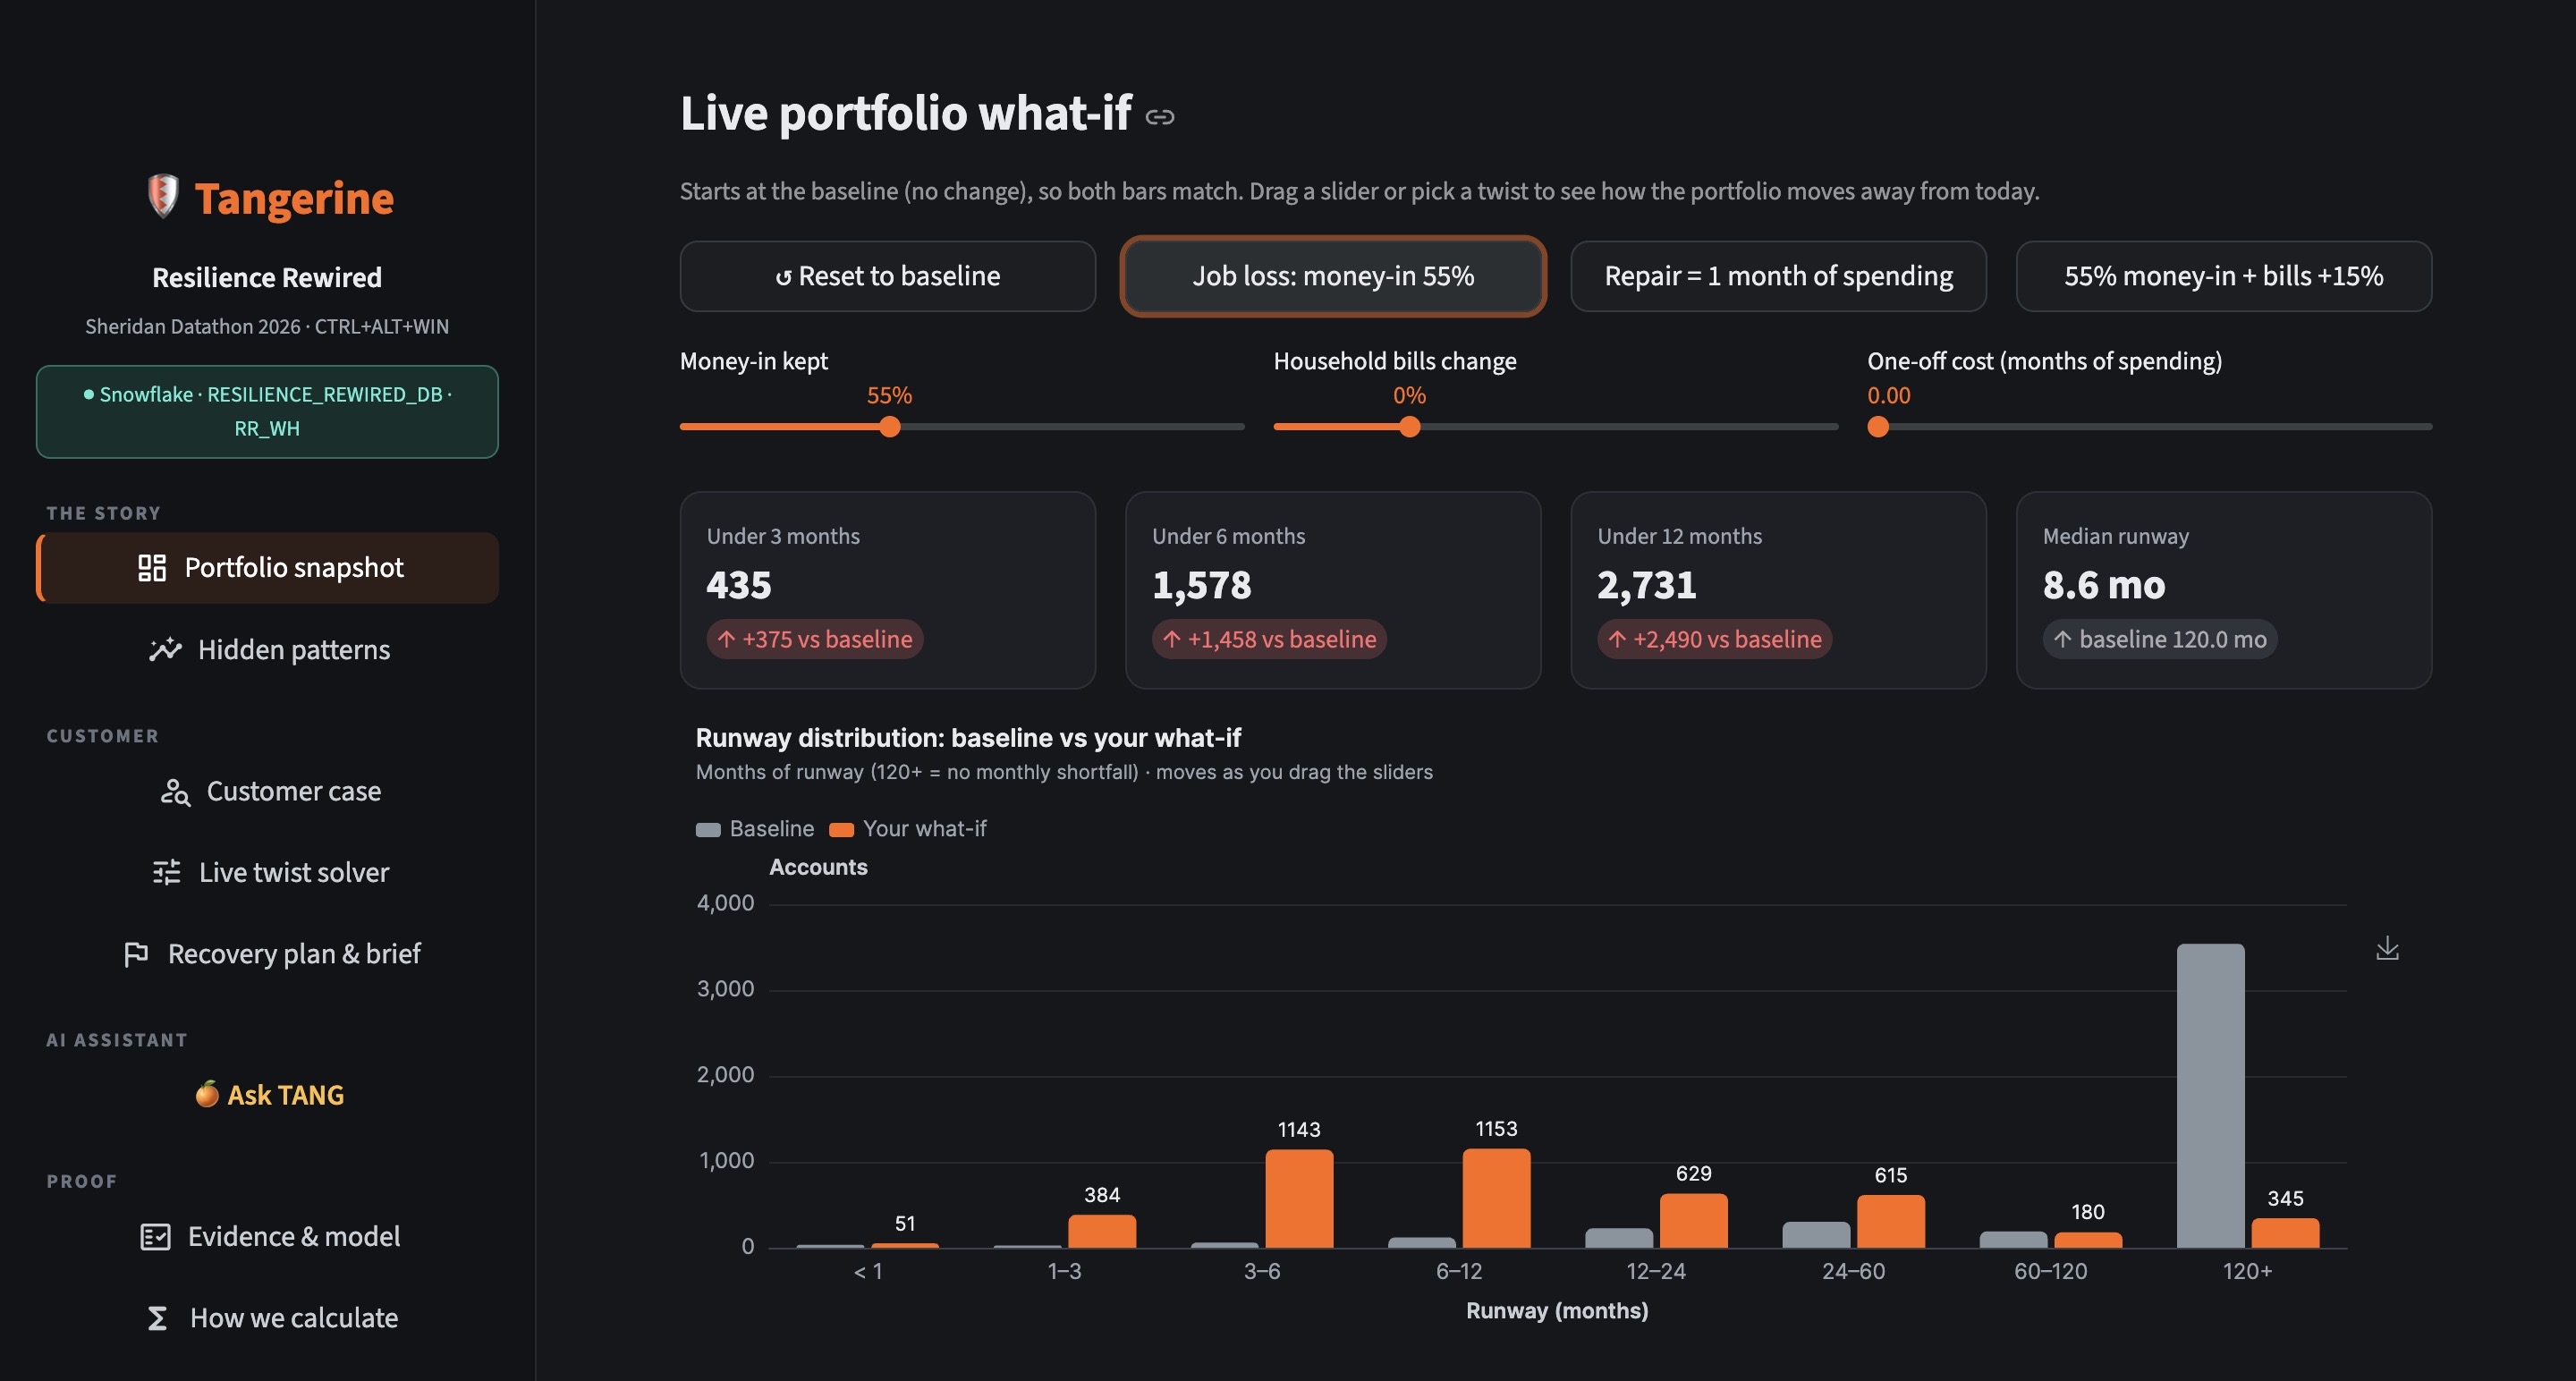
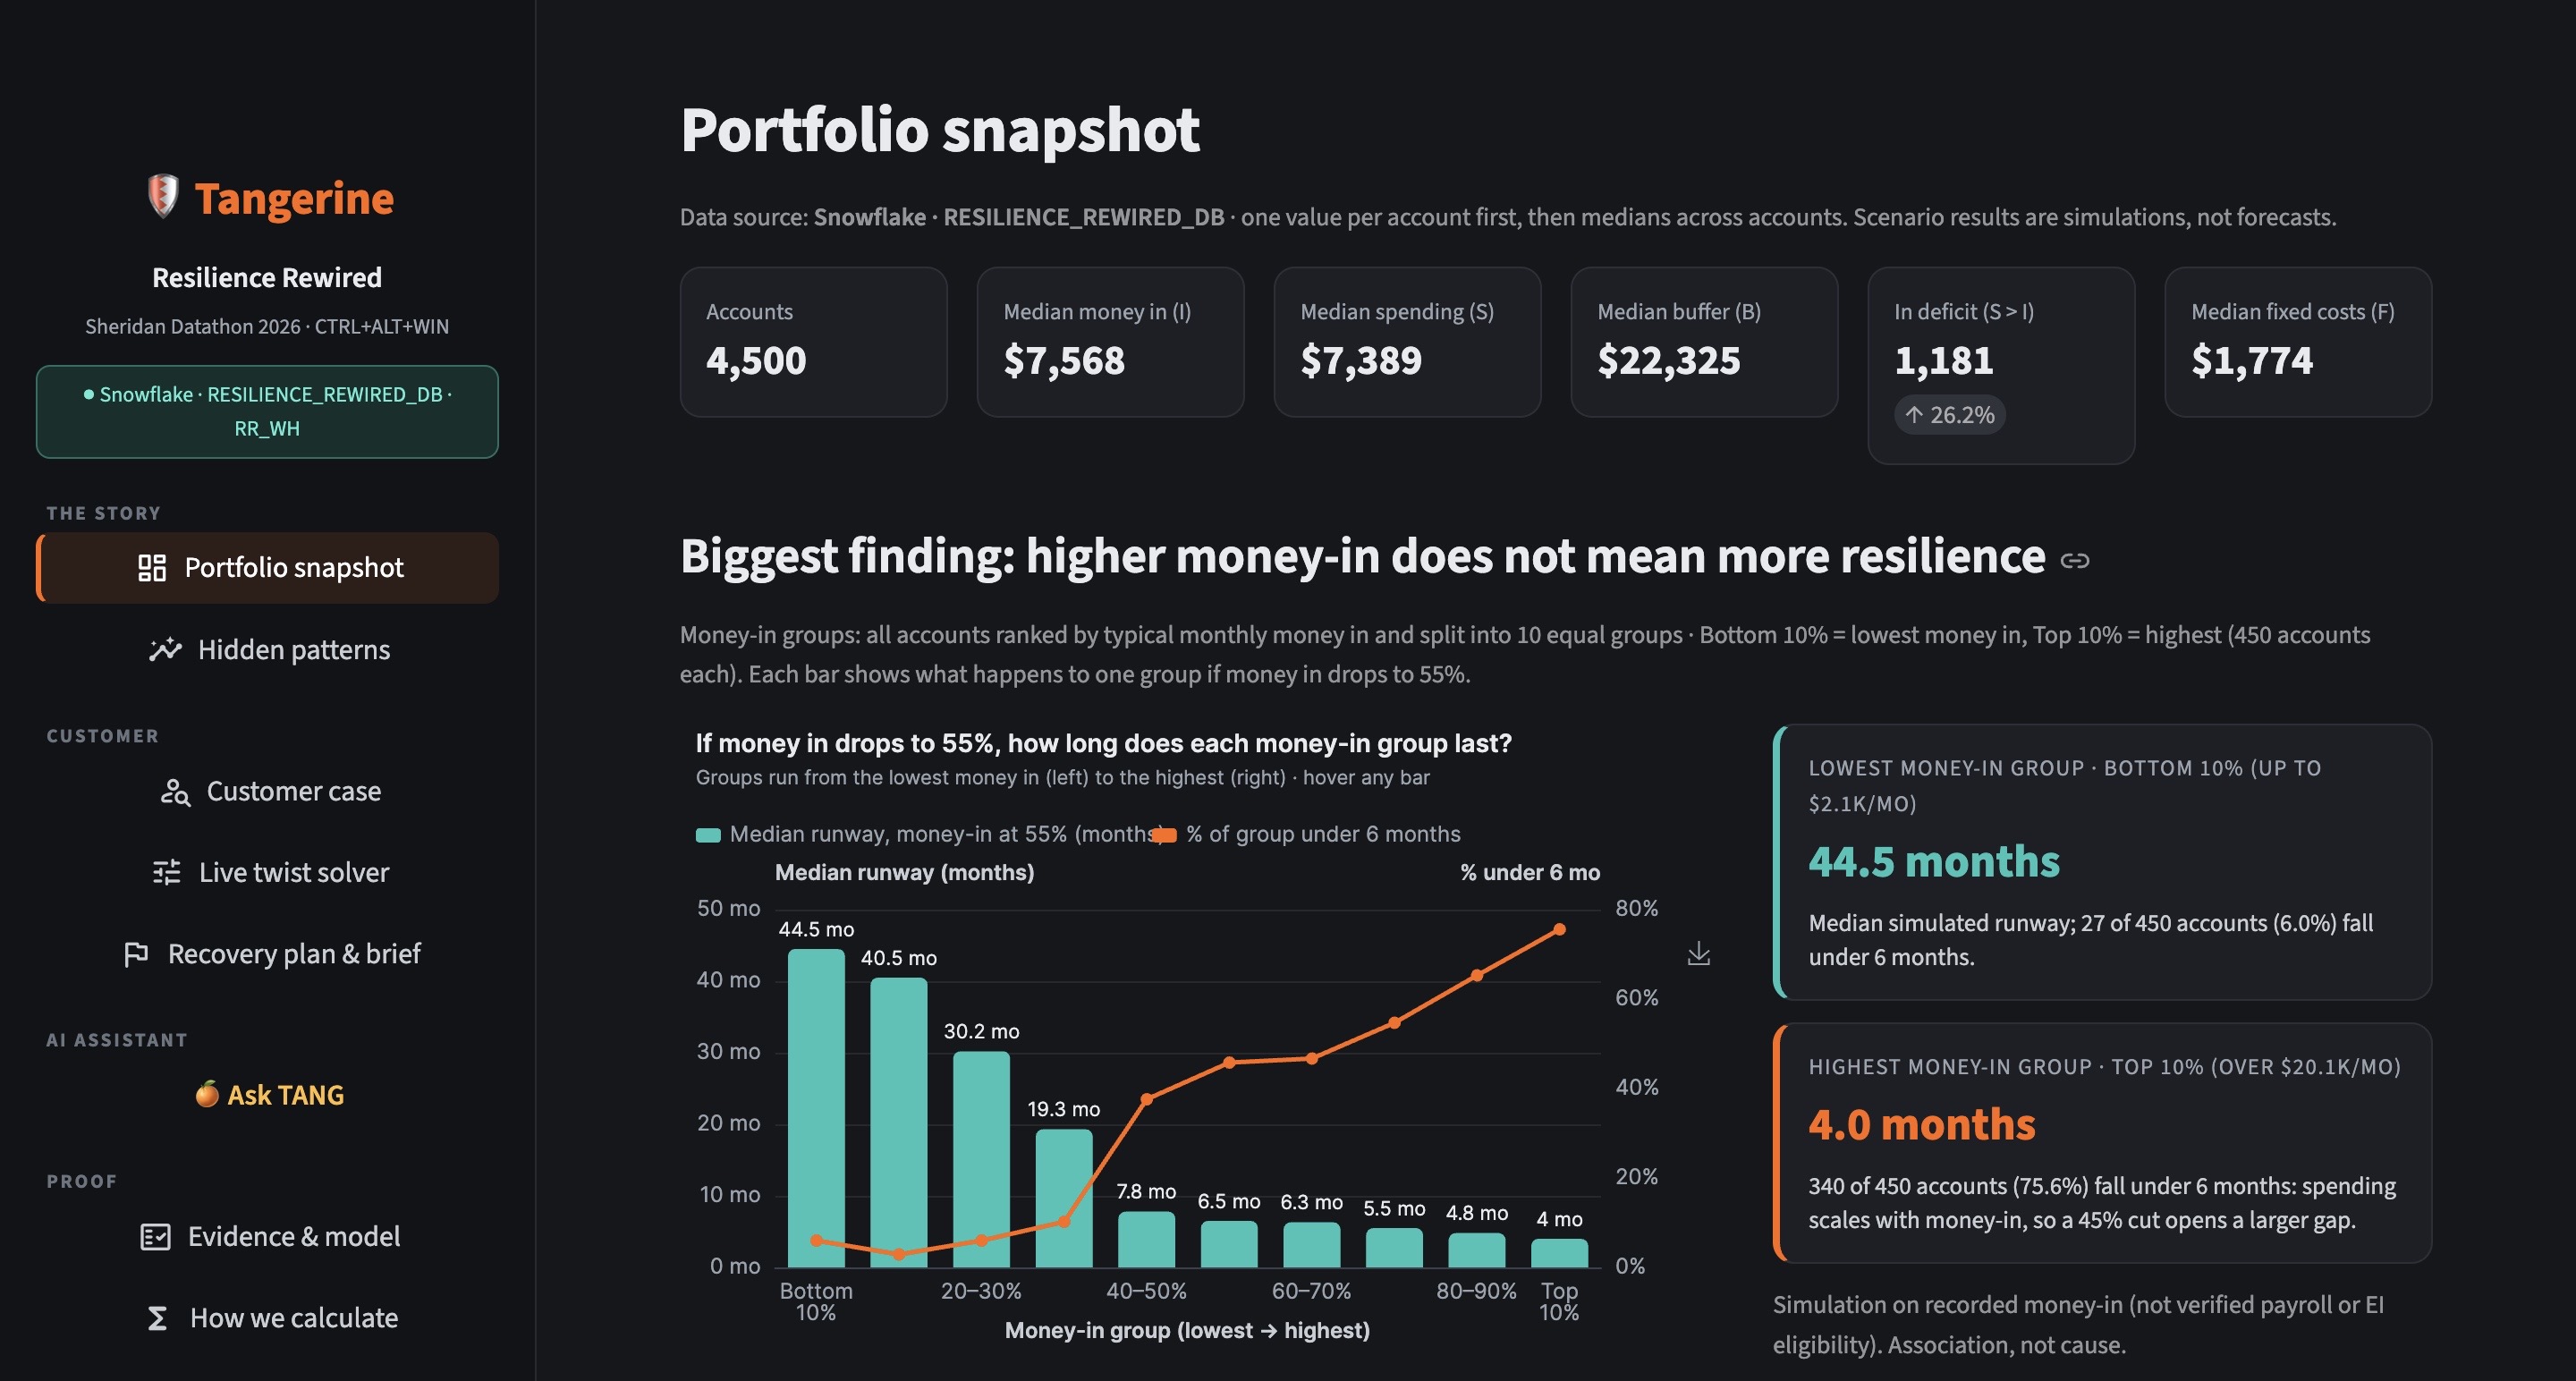
- Stress tests the challenge scenarios. Accounts under 3 months go from 60 (1.3%) at baseline to 435 (9.7%) at 55% money-in, 284 (6.3%) when a one-month repair hits, and 504 (11.2%) at 55% money-in with bills up 15%.
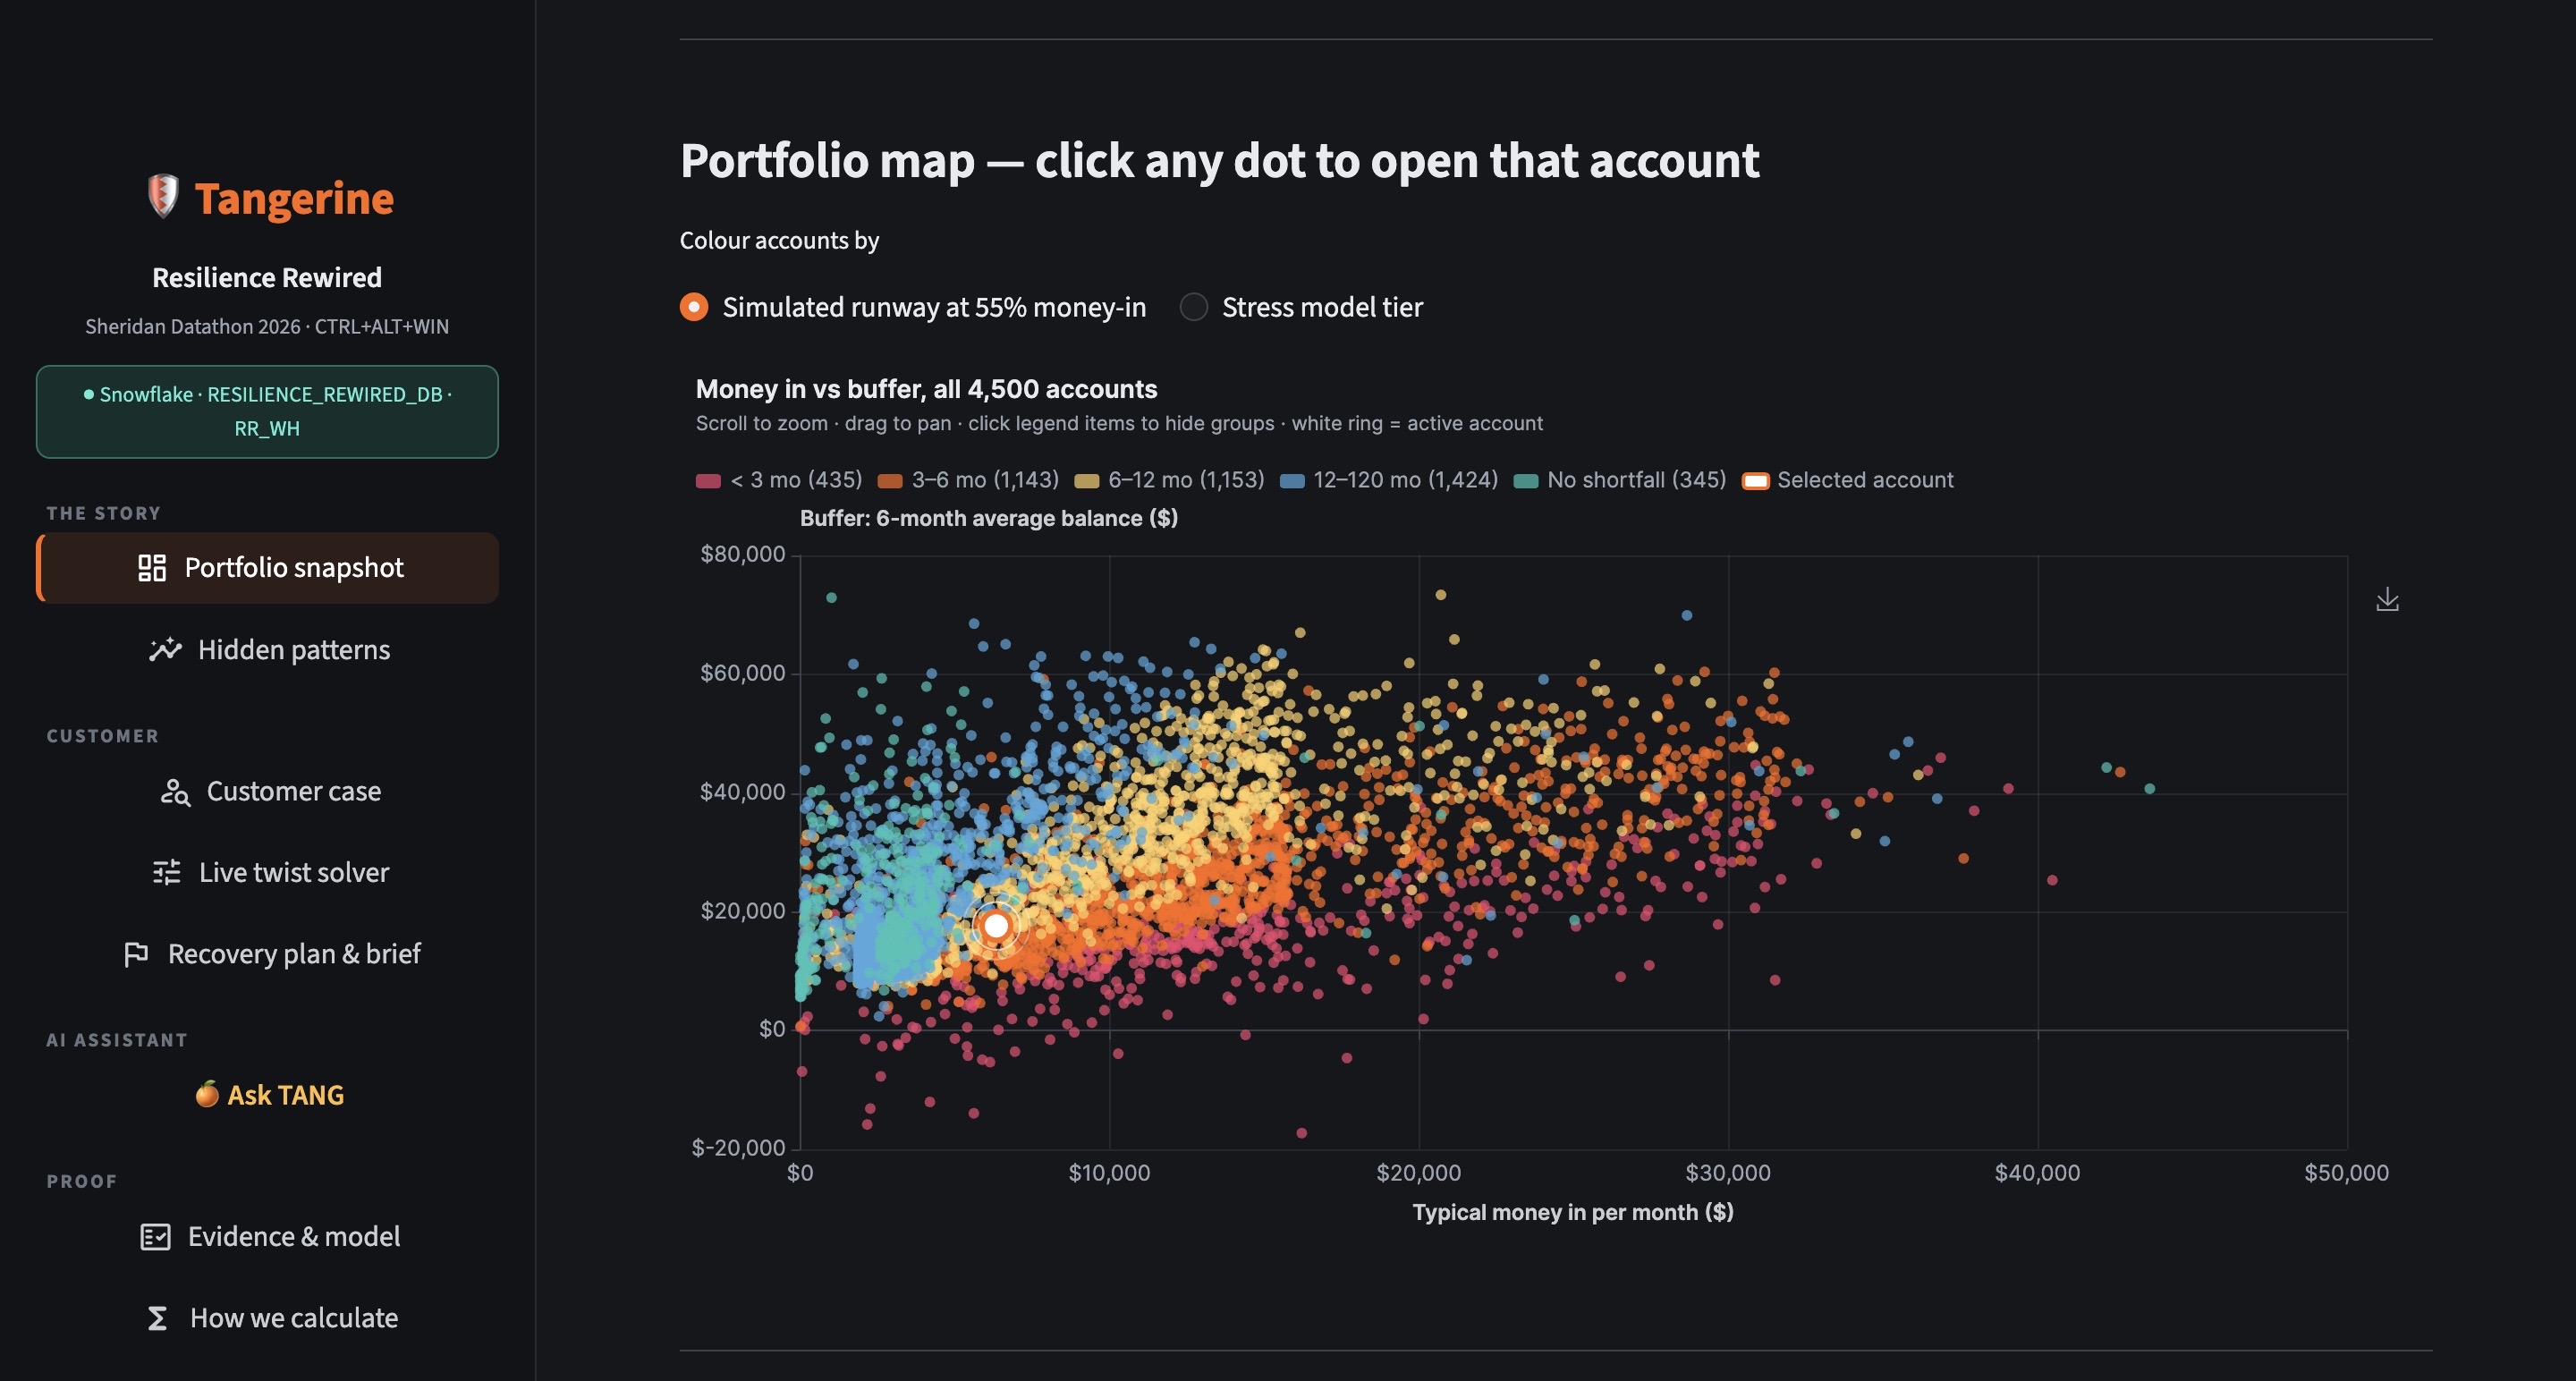
- Finds a result you wouldn't guess. The highest earners are the most fragile. At 55% money-in, the top 10% have a median runway of 4.0 months, and 75.6% of them drop under 6 months. The bottom 10% have a median runway of 44.5 months.
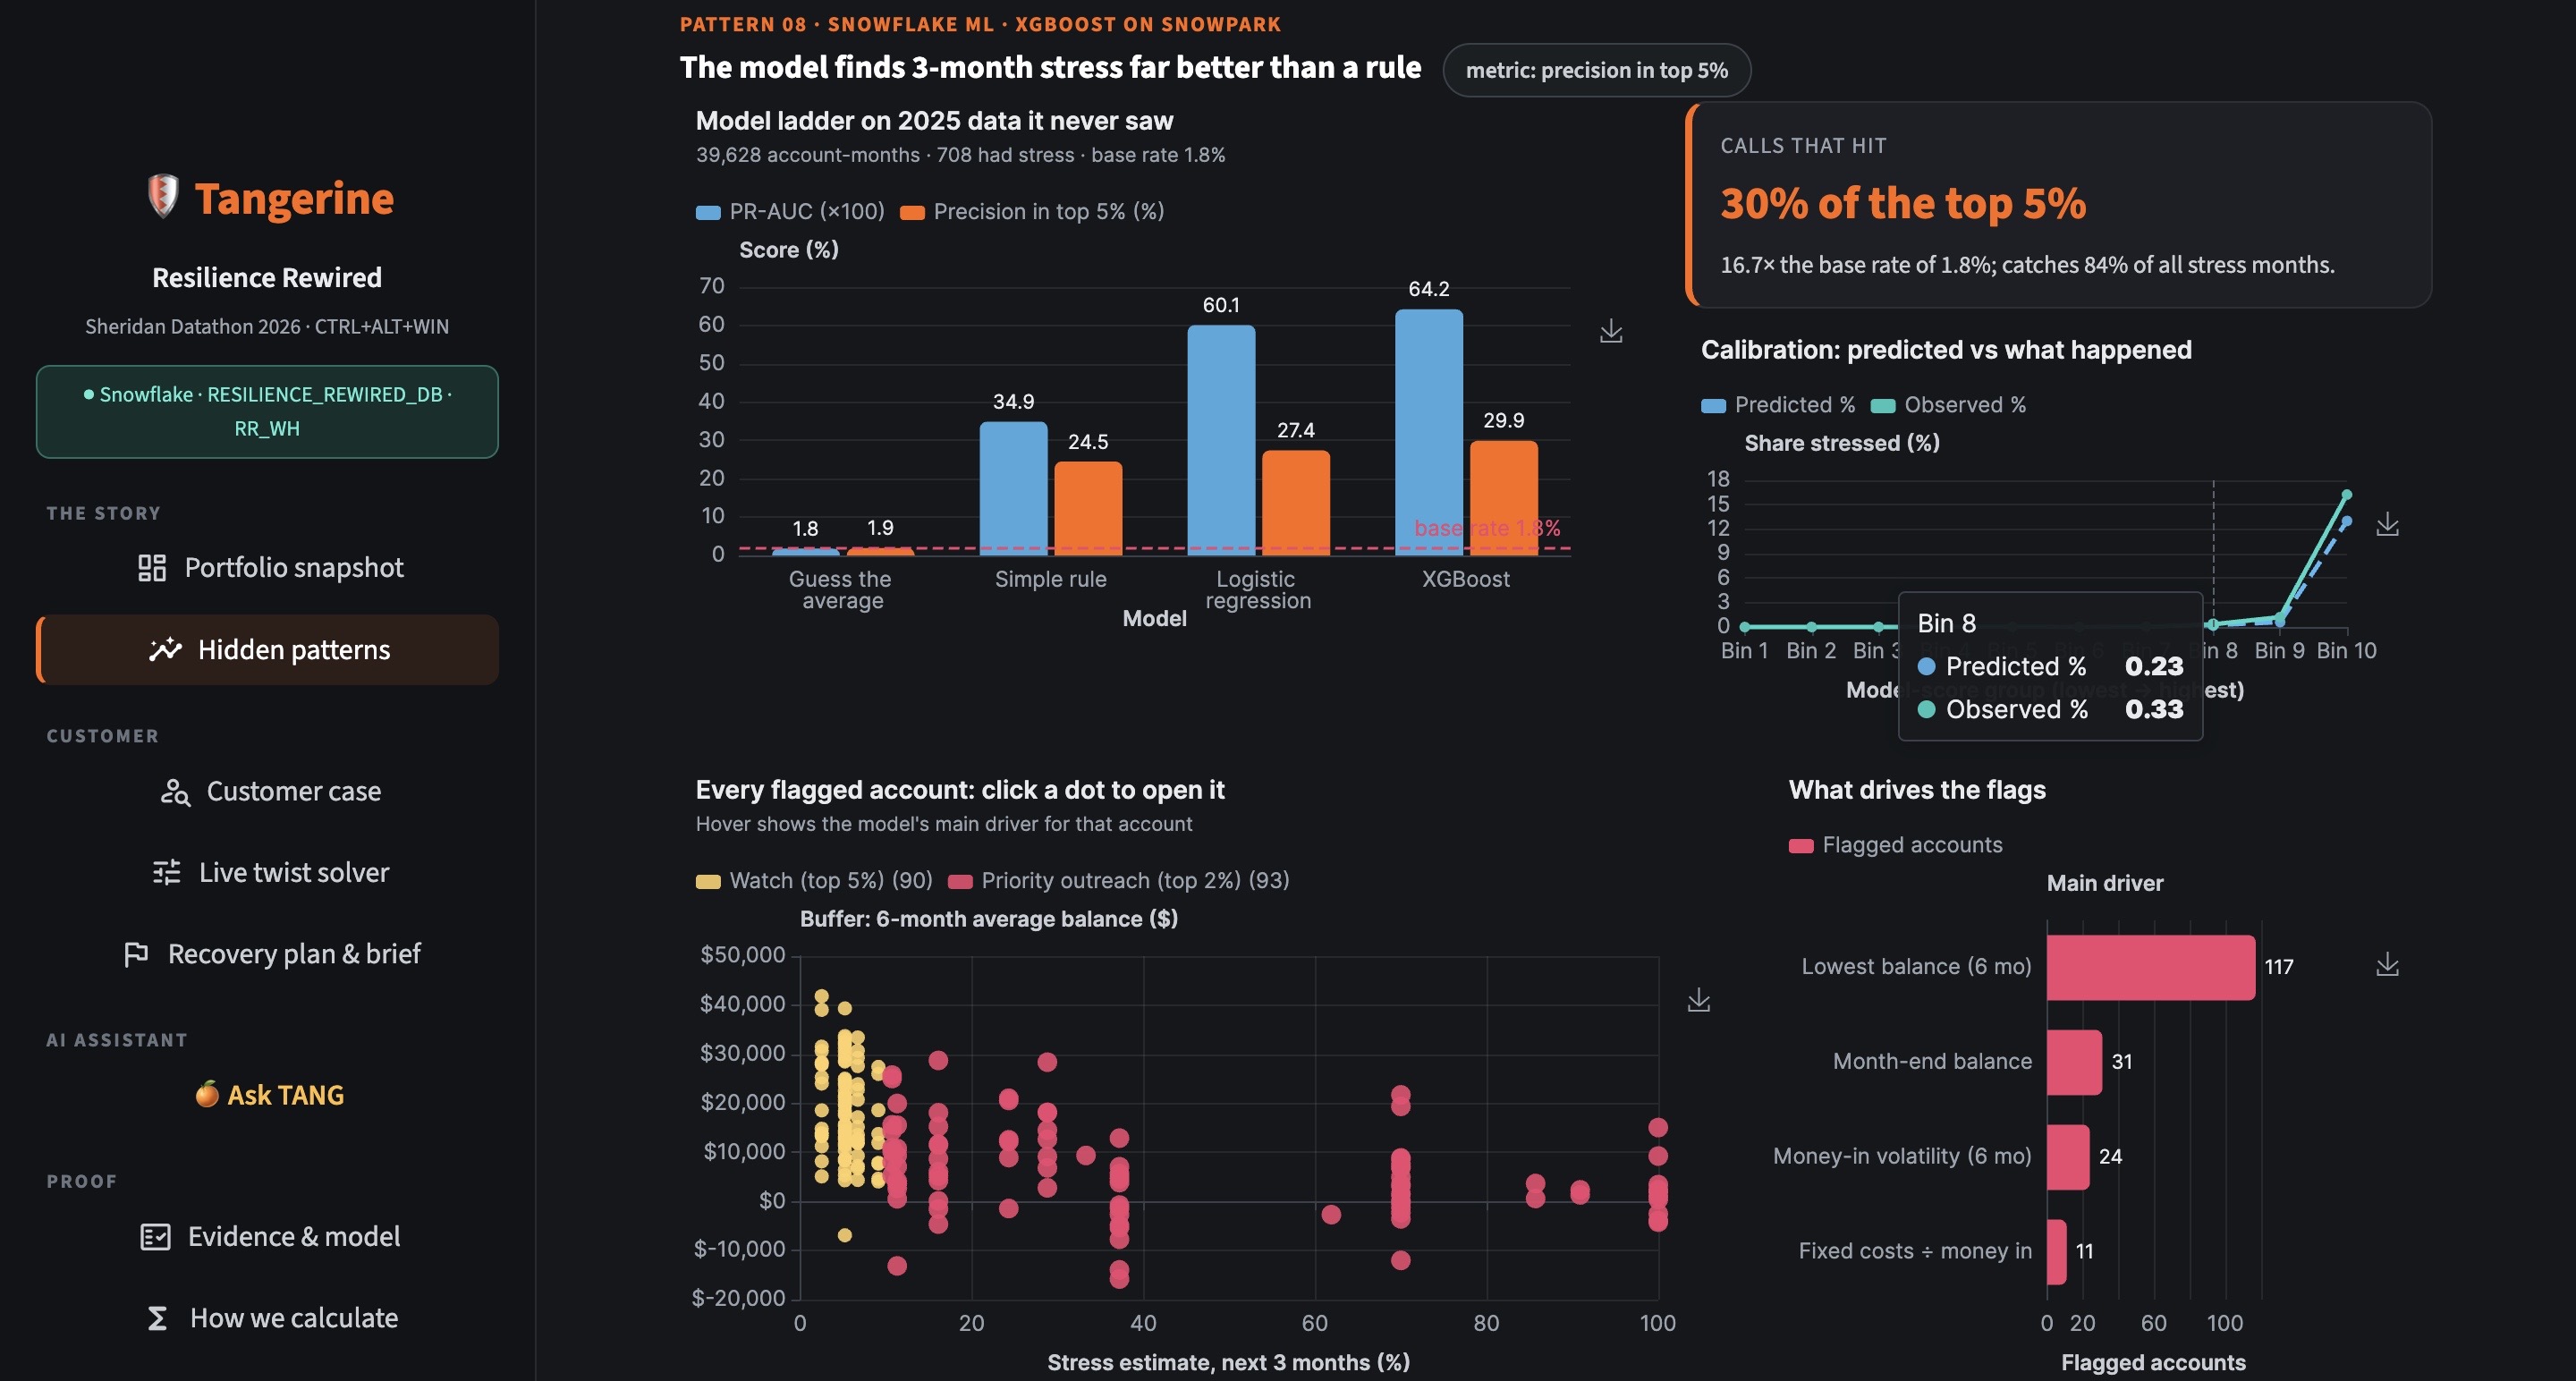
- Explains why with Snowflake ML Top Insights. People who spend 90%+ of their income account for 90% of the jump (120 → 1,438 accounts under 6 months). It also flags 175 hidden-risk accounts: top earners spending 90–100% who are fine today but exposed after an income drop.
- Checks the buffer against real loan outcomes. Loans in the lowest 25% by pre-loan buffer defaulted at 22.7%, against 5.2% for the highest 25%. All 21 of 21 loans with a negative-balance day in the six months before the loan defaulted.
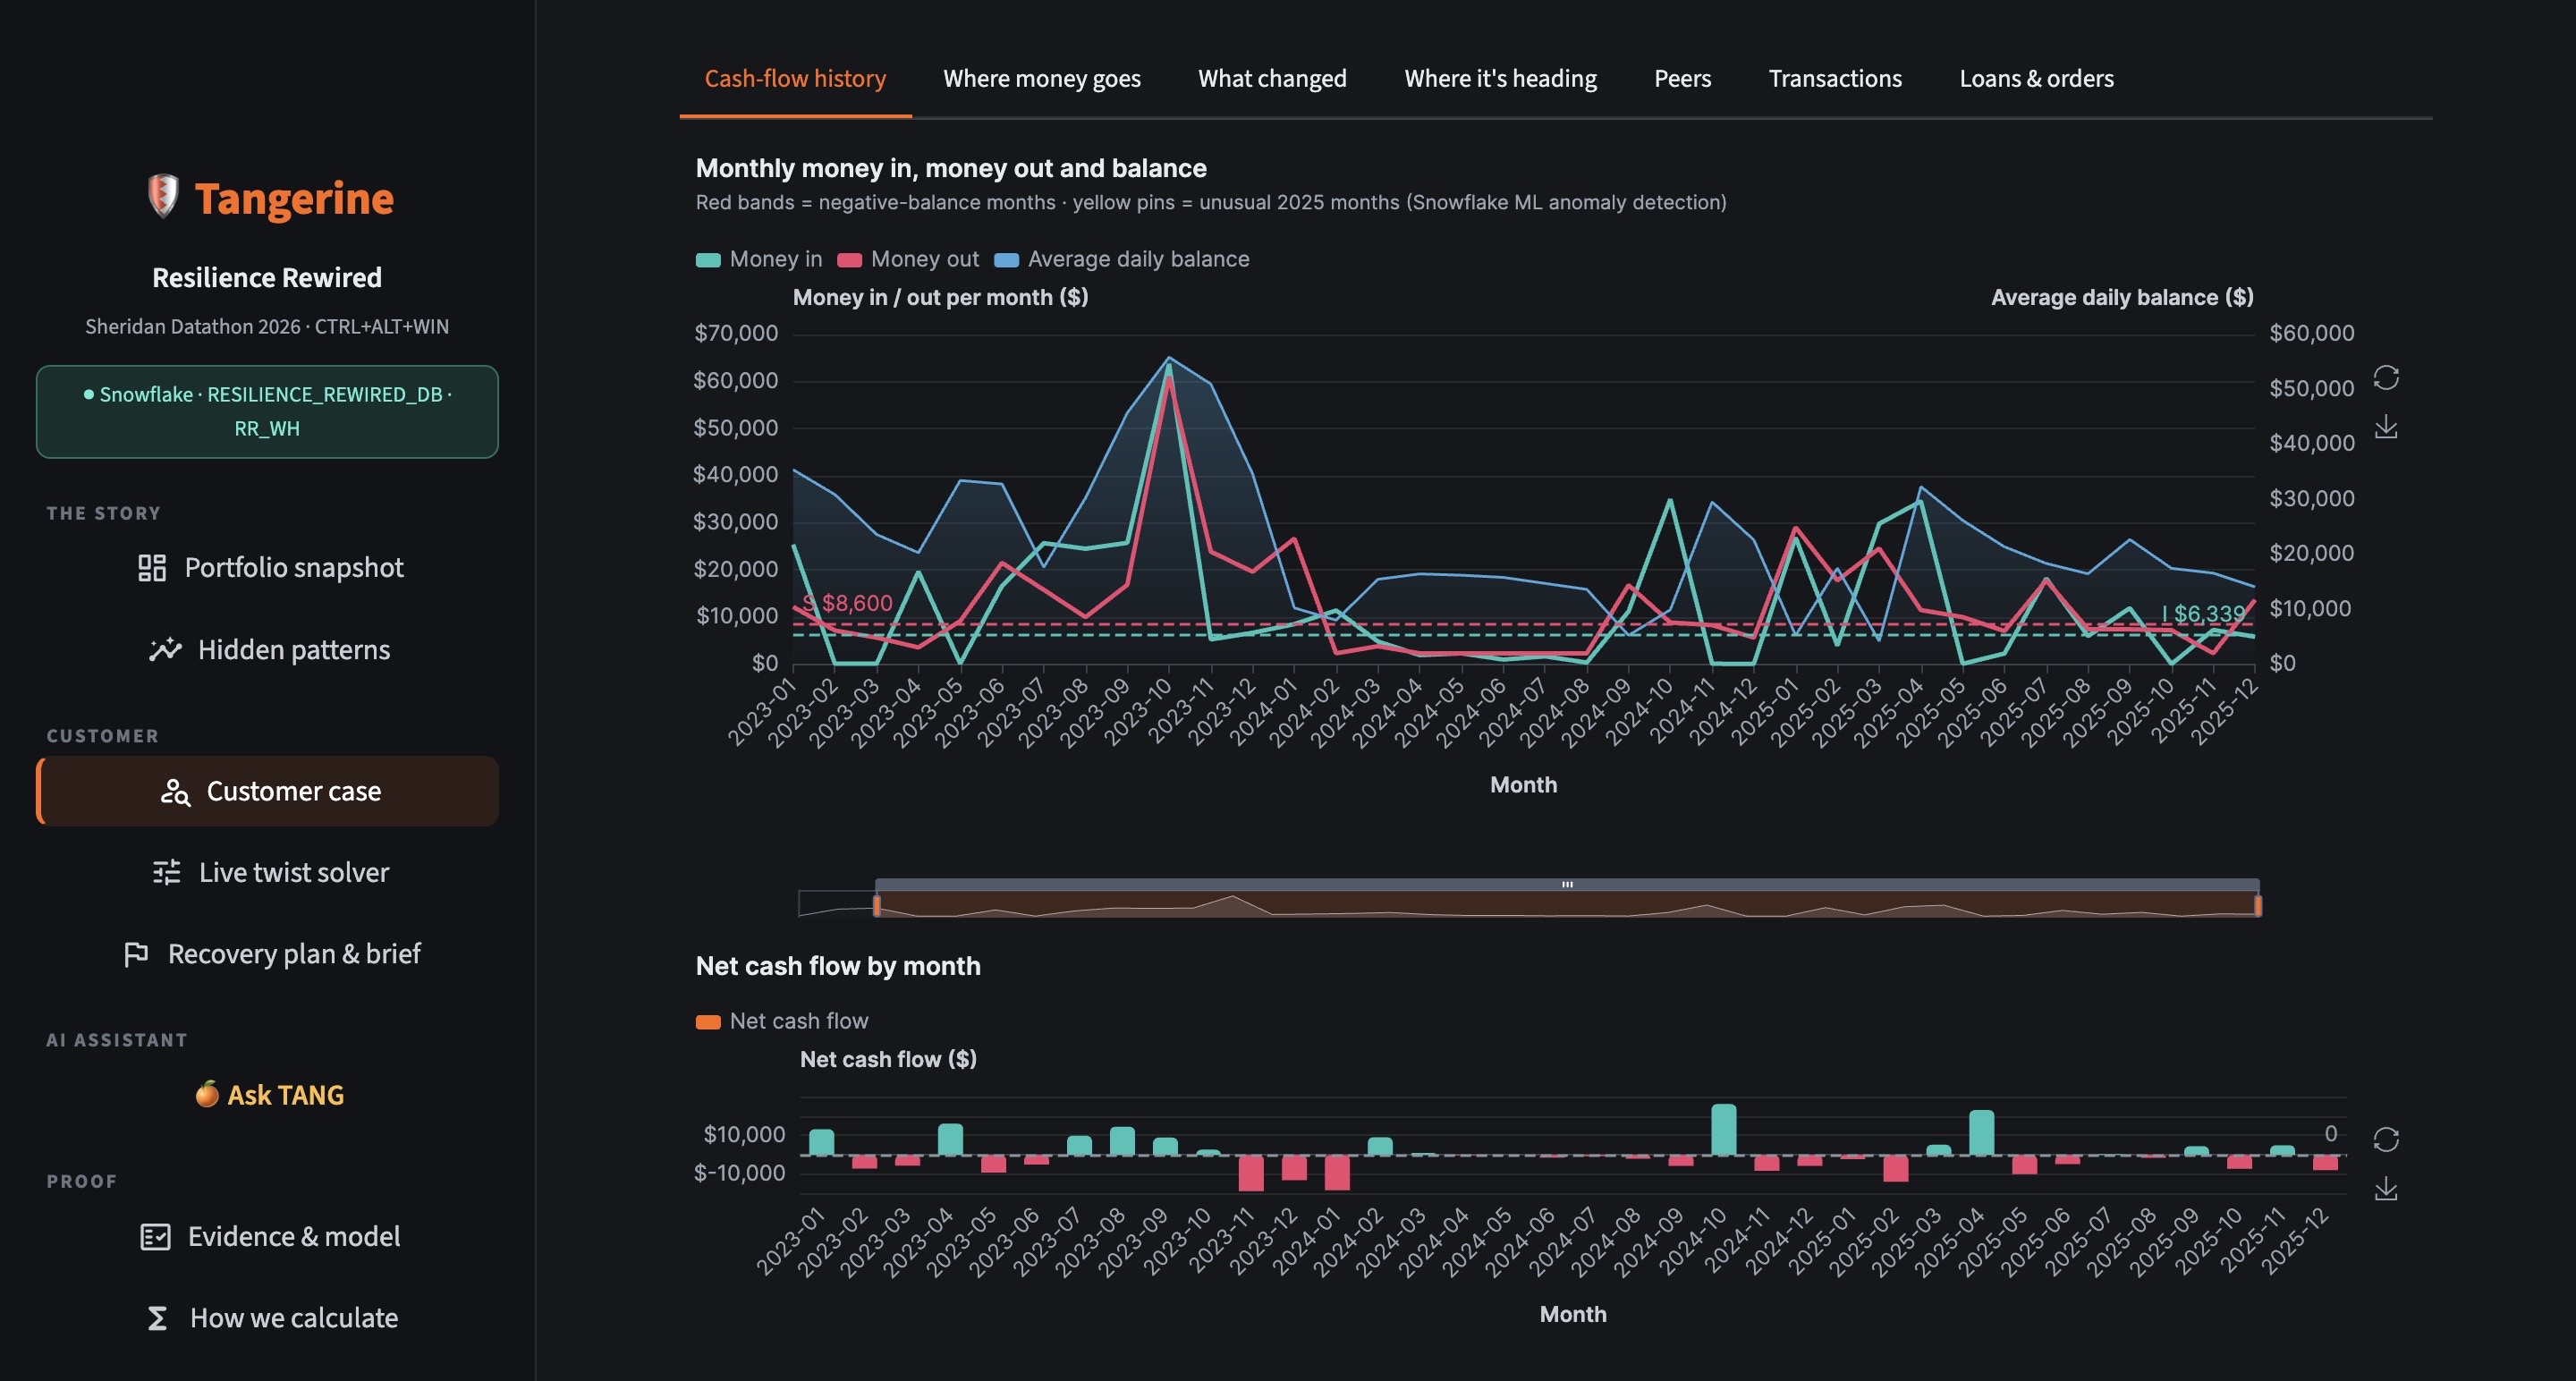
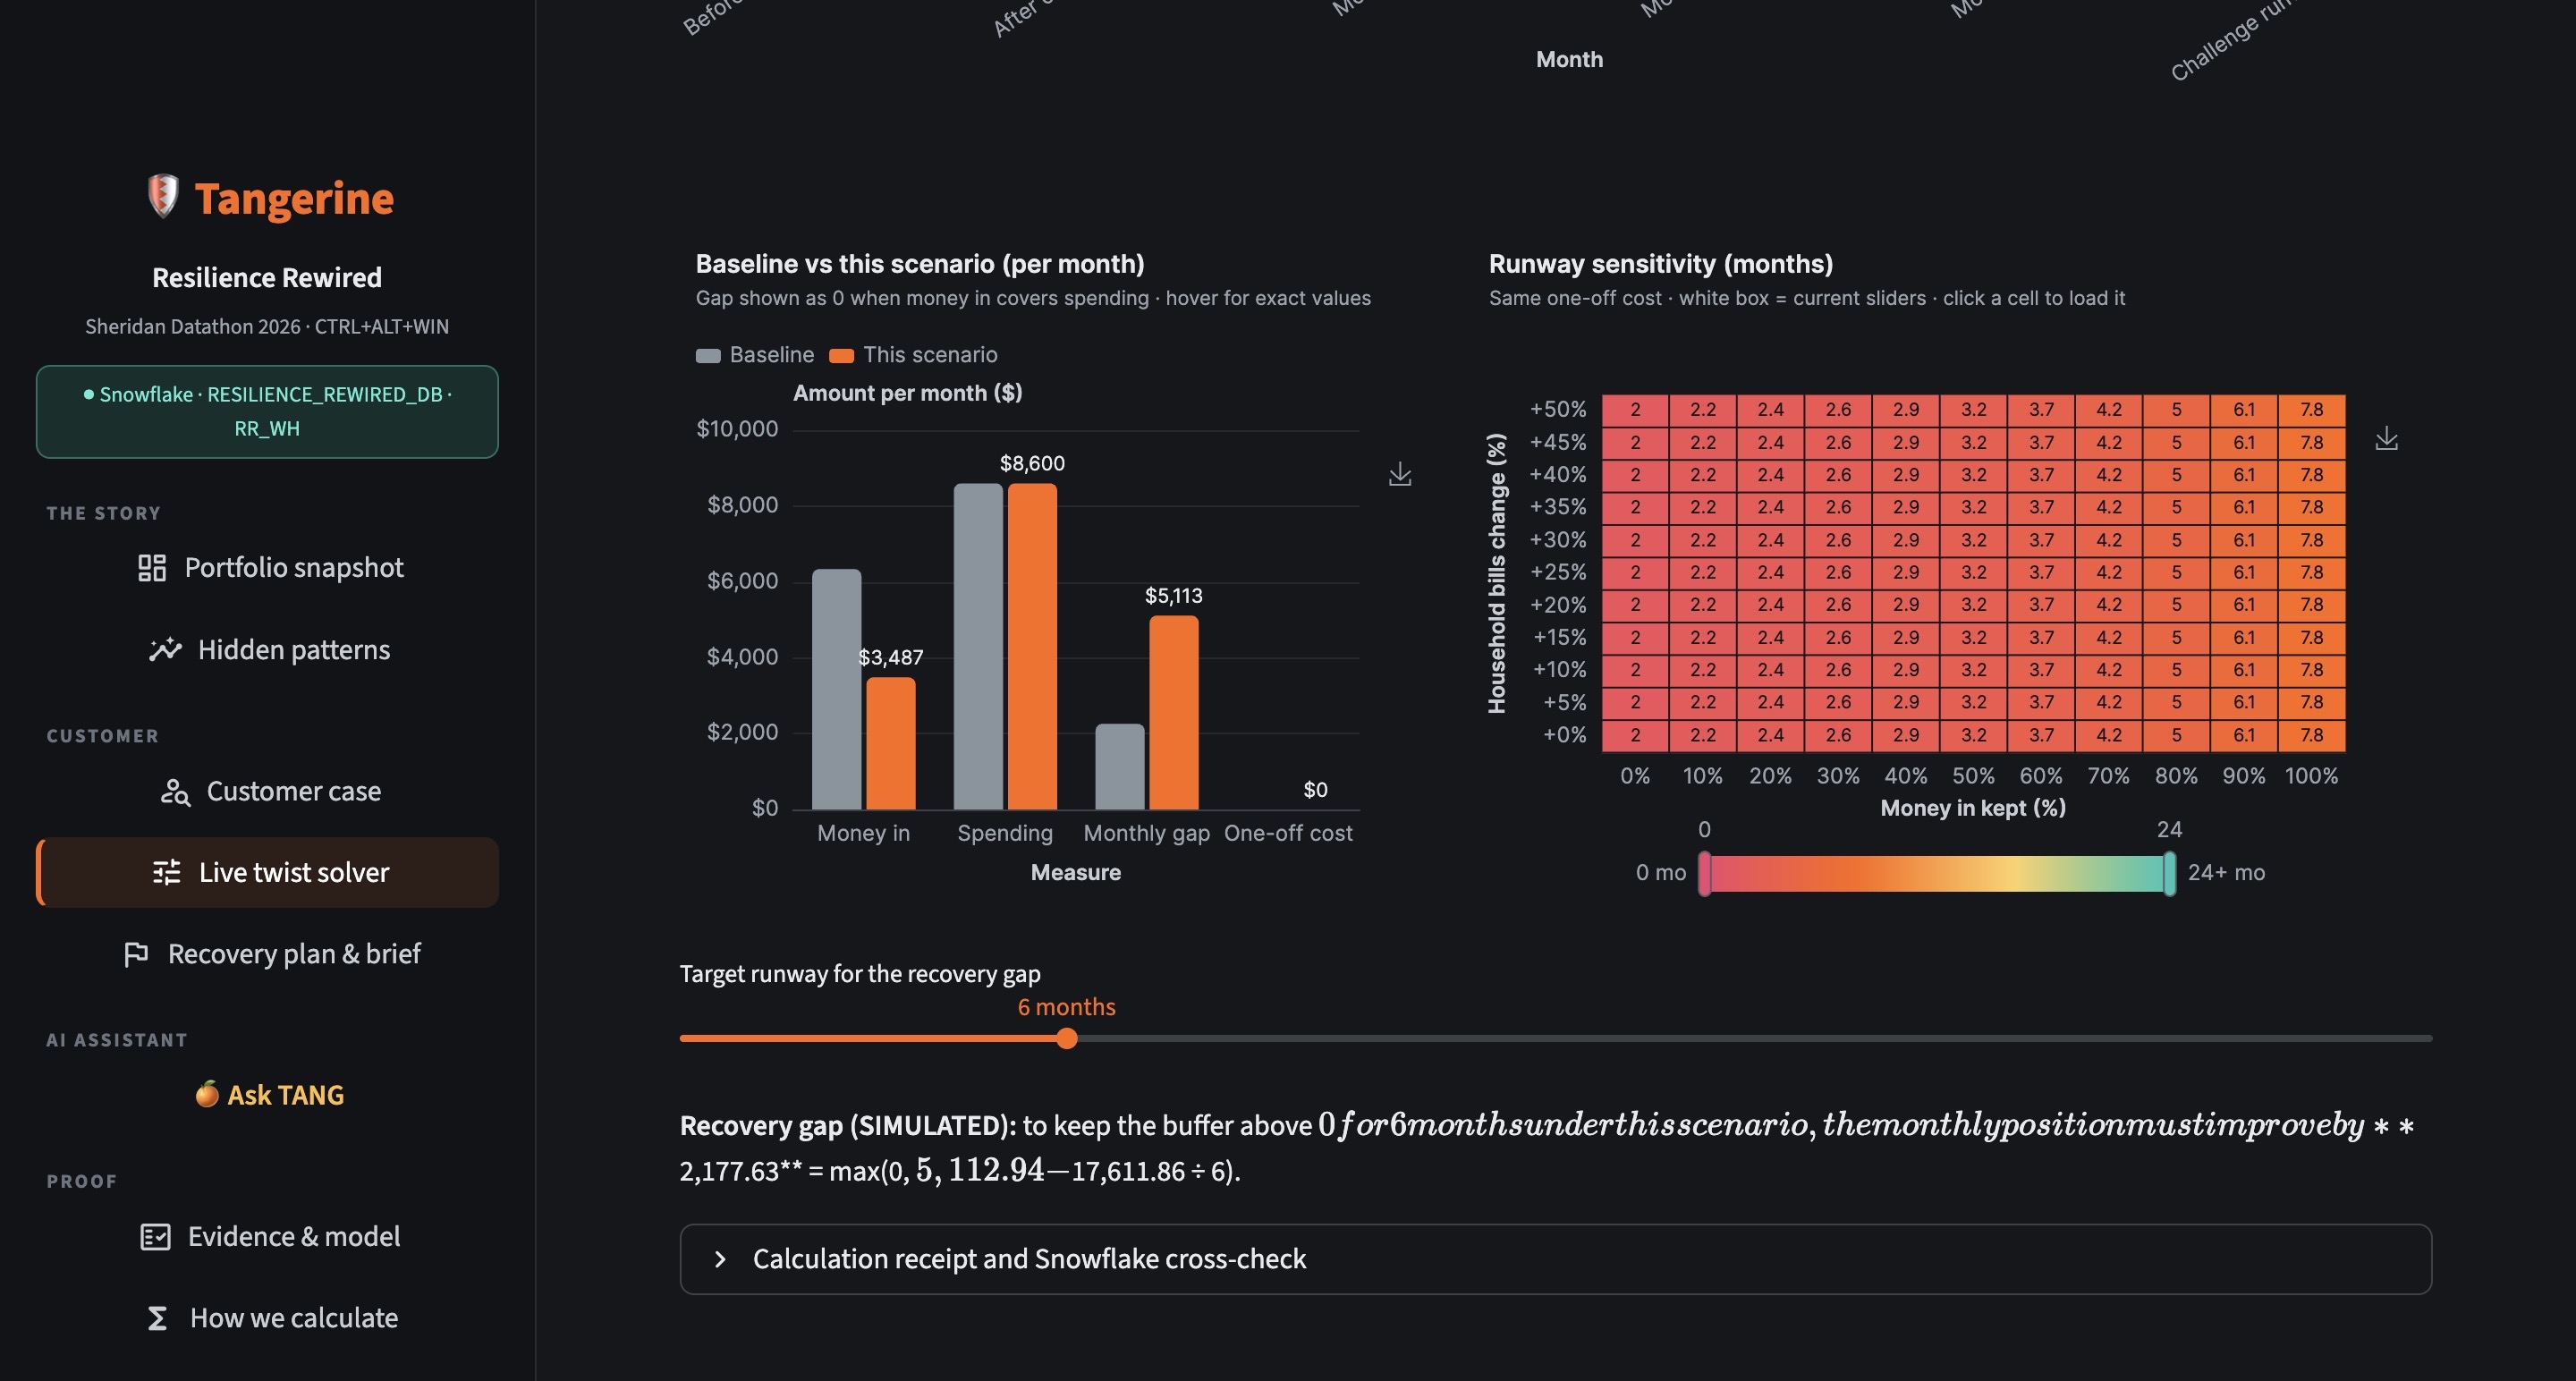
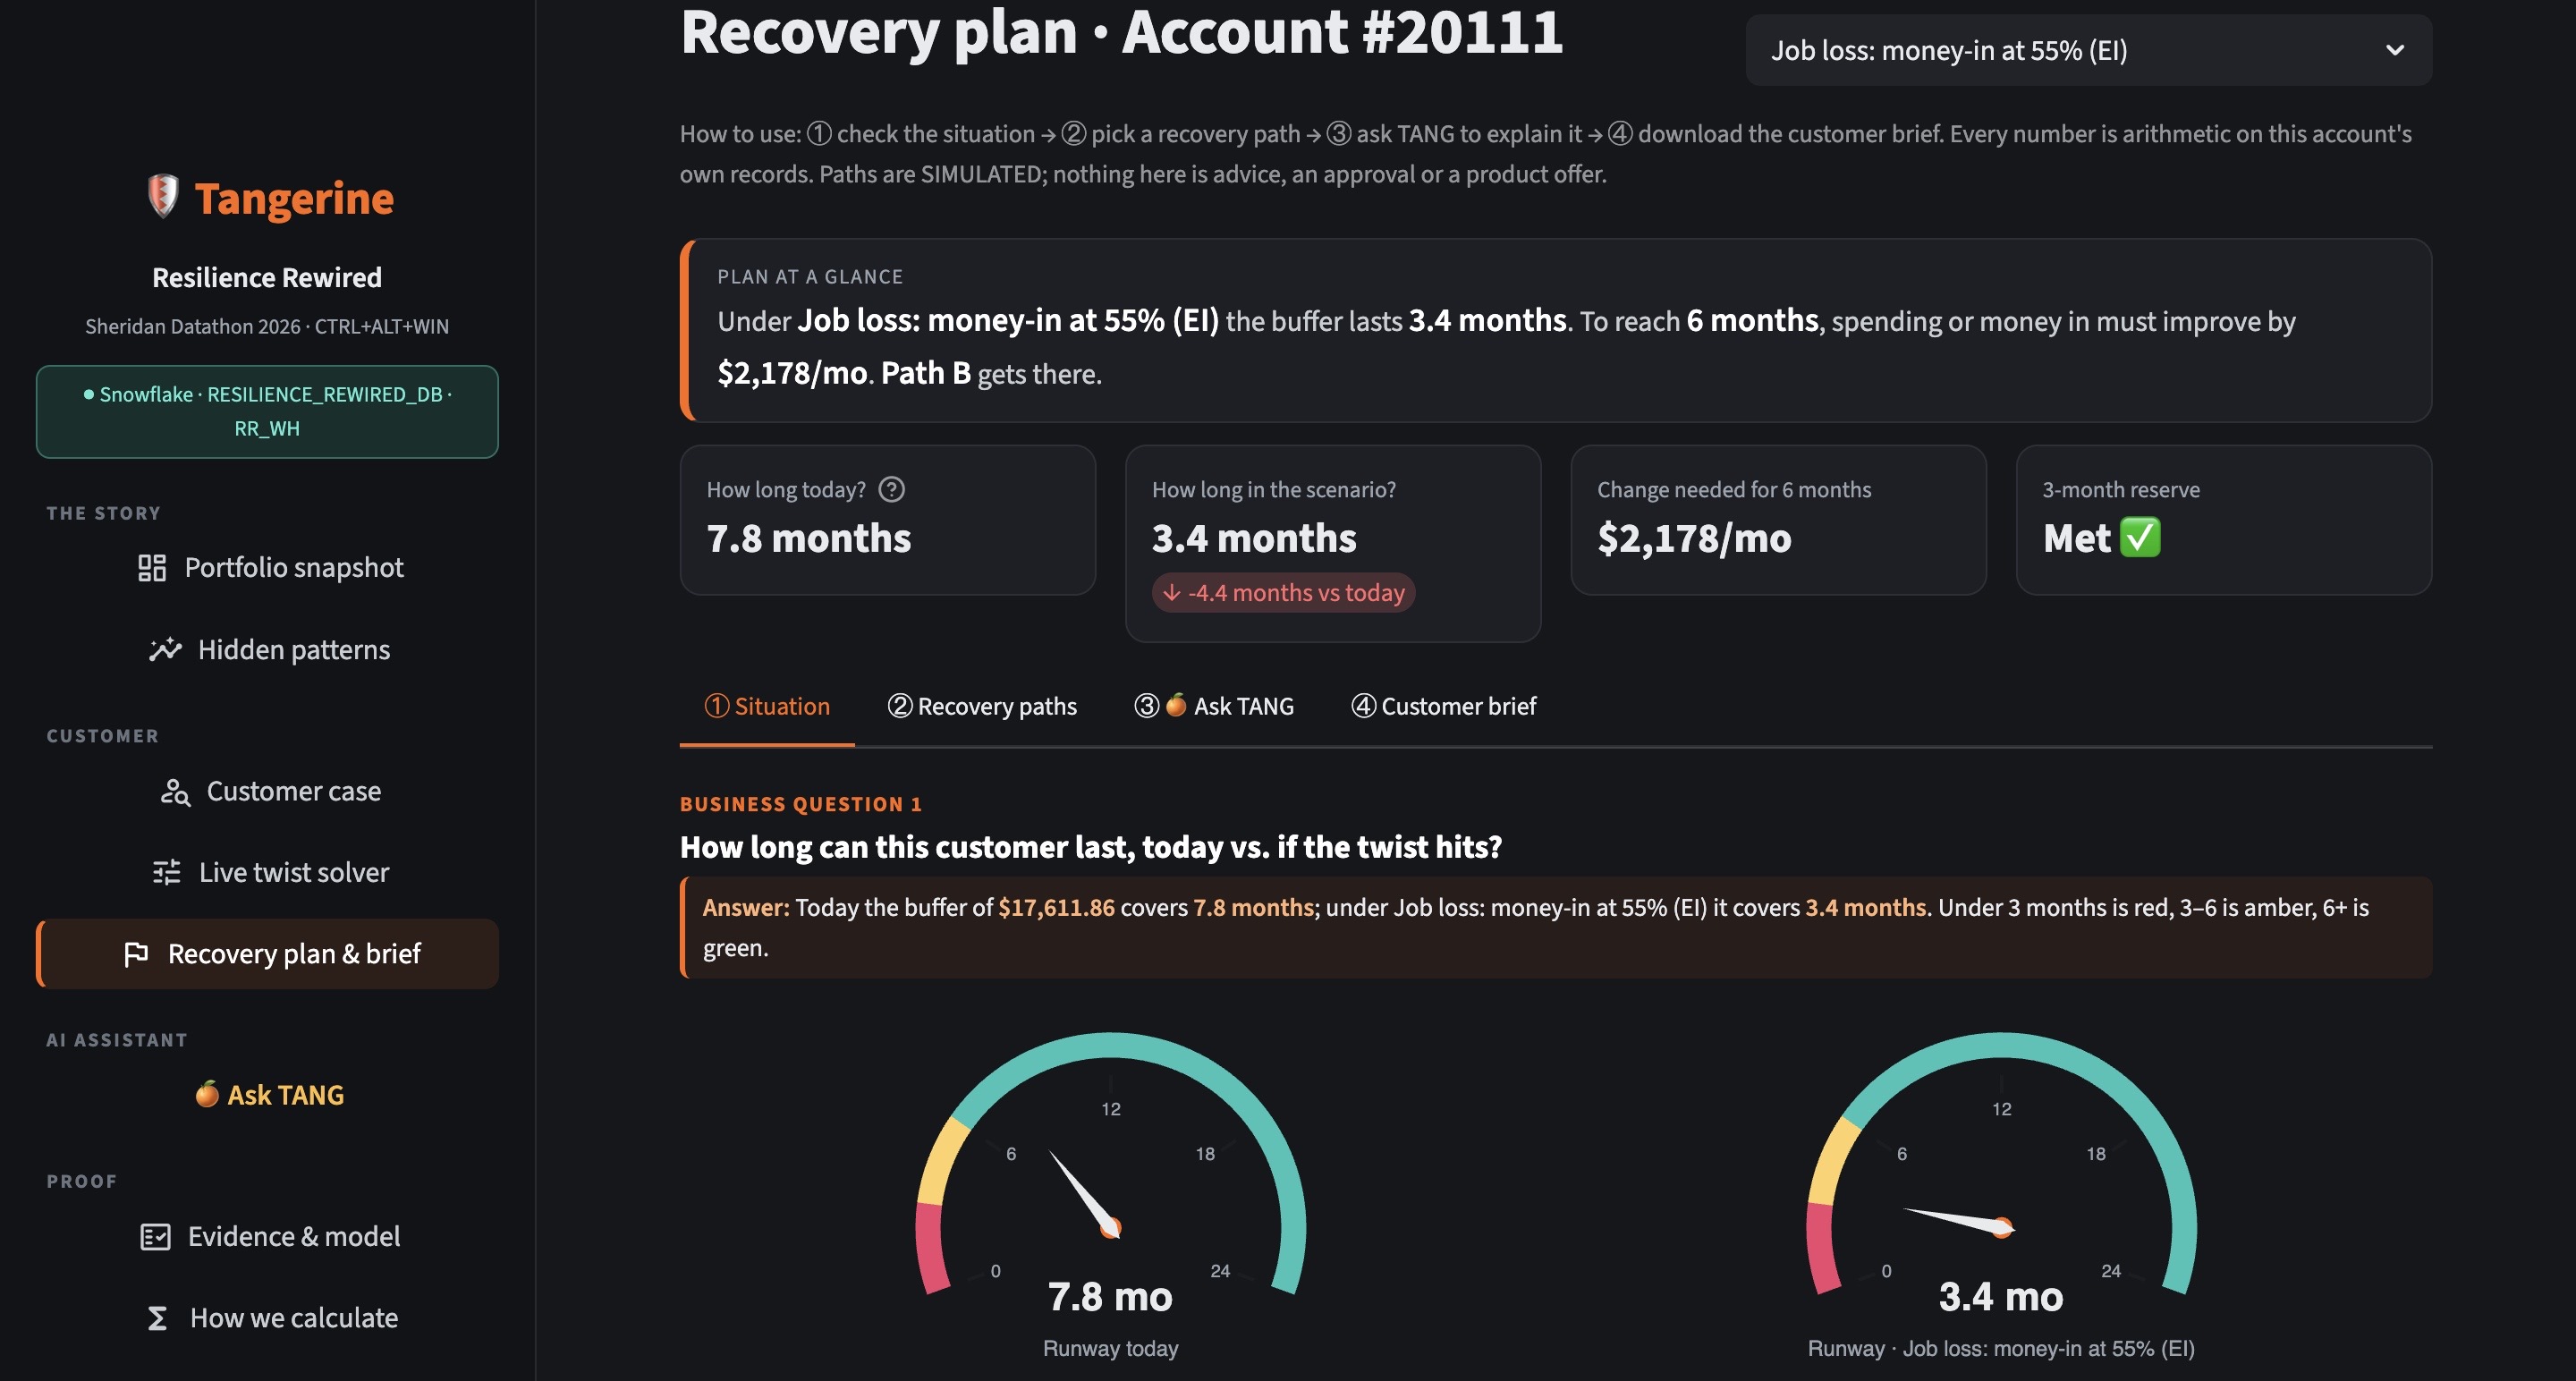
- Lets you test any scenario live. Sliders, drill-down into single customers, recovery plans and an AI assistant (TANG).
How we built it
- All data lives in Snowflake (
RESILIENCE_REWIRED_DB) and is processed on theRR_WHwarehouse. - We compute one value per account first, then take medians across accounts.
- Runway is rounded to one decimal before counting accounts under 3, 6 and 12 months, which matches the judges' method.
- The app is a multipage Streamlit in Snowflake app. Clicking a chart opens that account, and the selected account stays in focus as you move between pages.
Challenges
- Getting our counts to match the judges' method exactly (rounding before the cut-offs).
- Keeping the statistics honest: these are simulations, not forecasts, and associations, not causes.
- A small sample: the negative-balance group is only 21 loans, and the supplied flag includes running loans (status D).
Accomplishments
- A clear, counter-intuitive headline finding, backed by real loan outcomes.
- The whole app runs inside Snowflake. No data leaves the platform.
What we learned
Spending relative to income matters more than income itself. "Fine today" is a bad stand-in for "resilient tomorrow".
What's next
- Early-warning alerts for the hidden-risk group.
- Scheduled refreshes.
- Tying recovery plans to real products (savings nudges, bill smoothing).
- Fairness review before using any of this to score customers. We don't score anyone today.
Team: CTRL+ALT+WIN · Sheridan Datathon 2026.
