RescueGrid
See the Risk. Coordinate the Response.
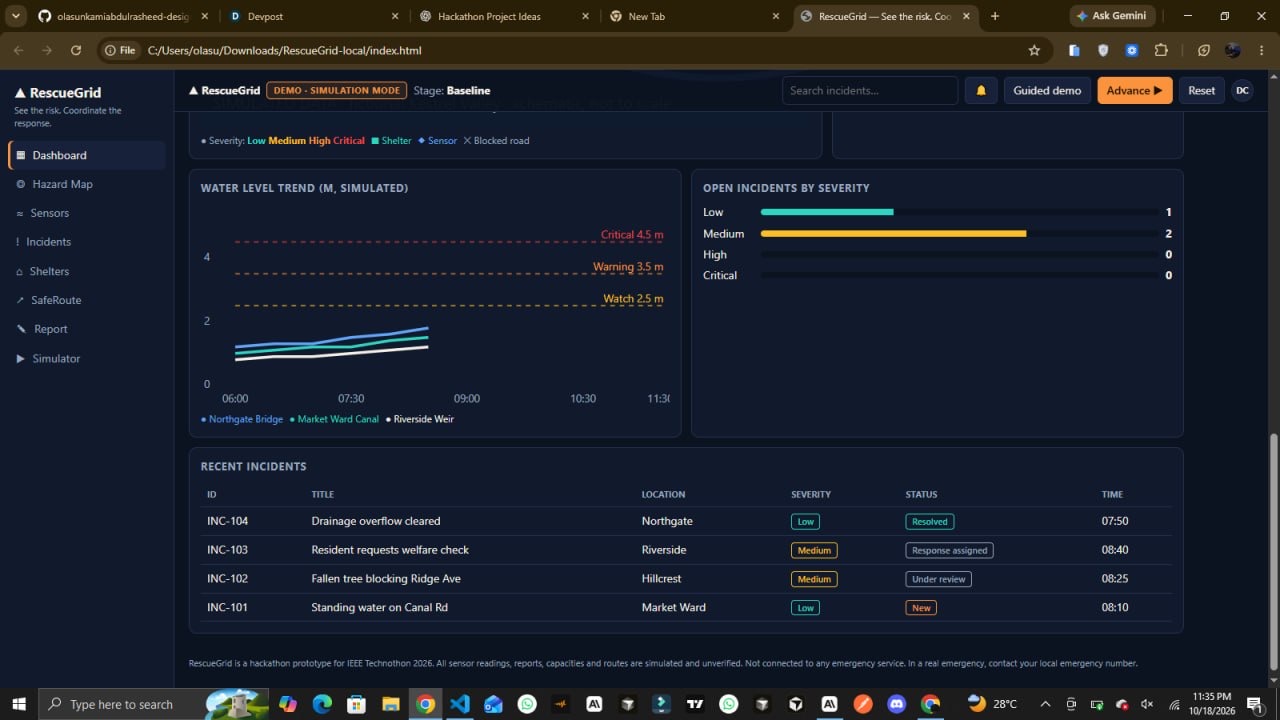
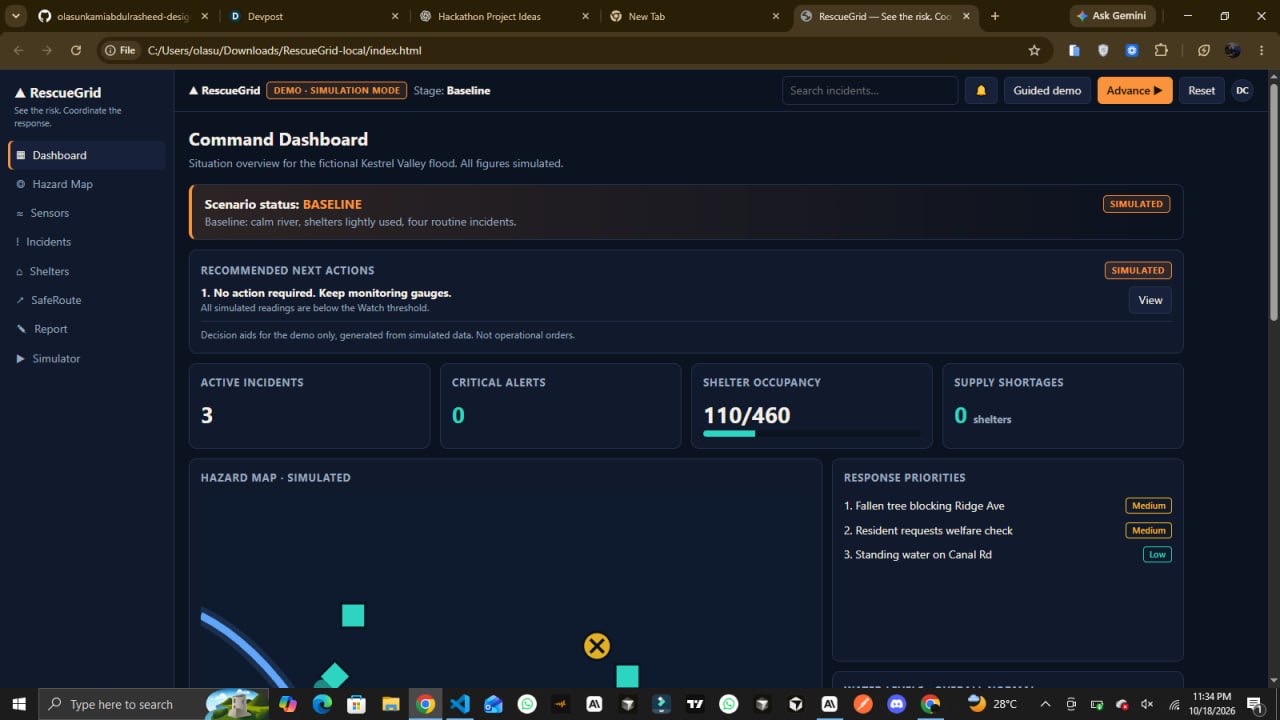
RescueGrid is a disaster-response coordination platform prototype that transforms fragmented emergency information into a unified operational view, helping response teams visualize hazards, track incidents, monitor resources, and organize response priorities.
When a disaster unfolds, understanding what is happening is only part of the challenge. Teams also need to identify developing risks, assess available resources, and determine which actions deserve attention first. RescueGrid explores how a centralized digital interface could make these workflows easier to understand and coordinate.
The Problem
Disaster response involves multiple moving parts: reported incidents, changing environmental conditions, shelter availability, resource shortages, and evolving priorities. When these elements are difficult to view together, maintaining situational awareness becomes challenging.
RescueGrid addresses this coordination challenge through a unified dashboard that brings these operational elements into one interactive experience.
Our Solution
RescueGrid is designed around one central idea: make the situation easier to understand so response priorities are easier to organize.
Core Capabilities
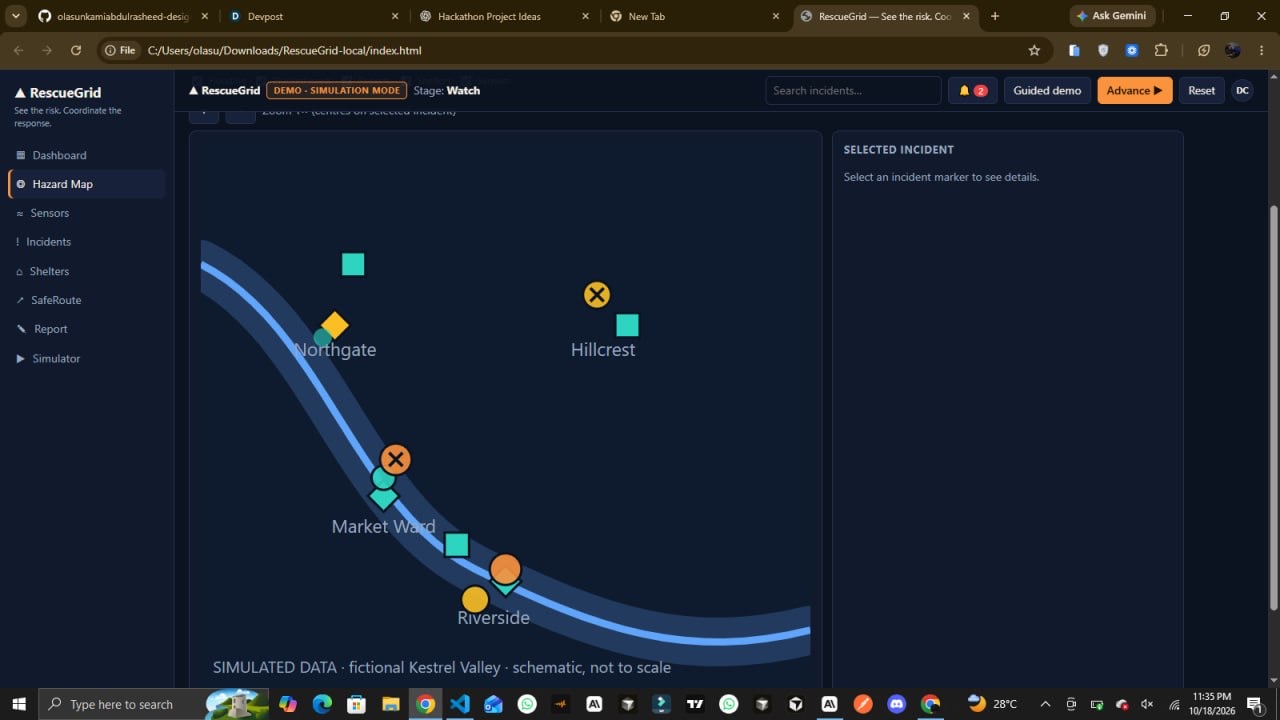
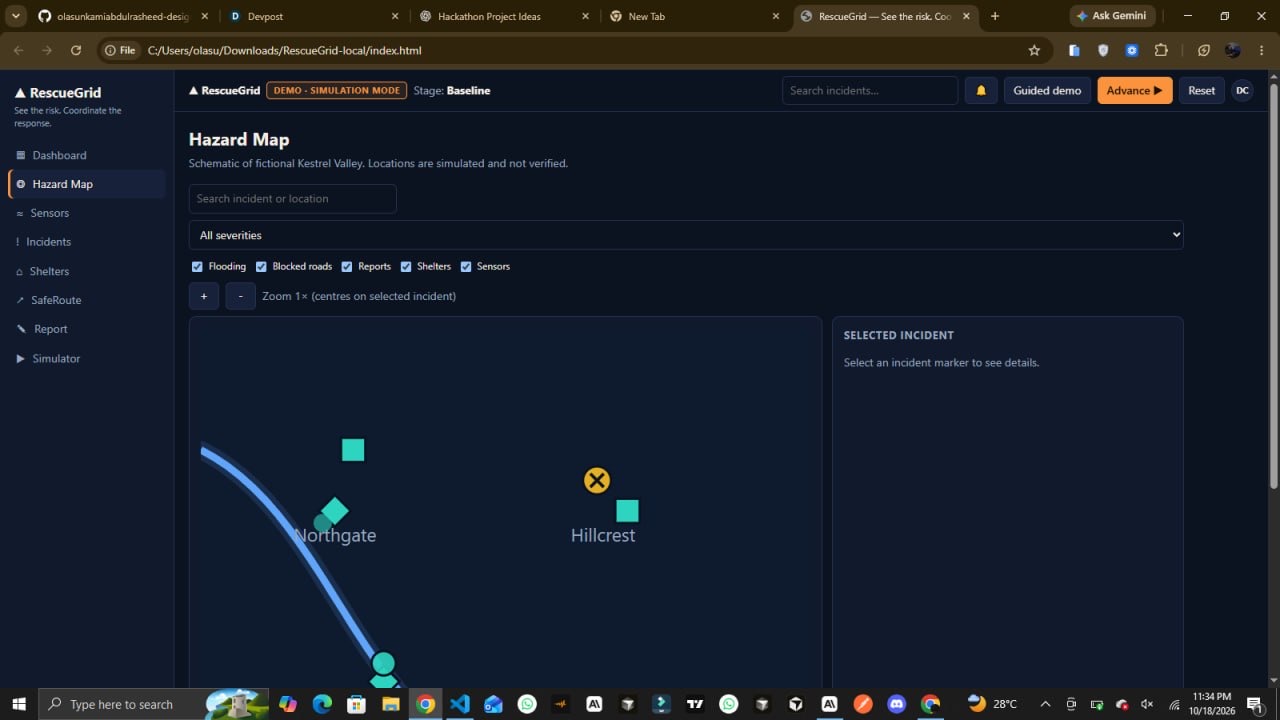
- Hazard Visualization
An interactive, schematic hazard map displays simulated risks and incident locations, giving users a spatial overview of the scenario.
- Incident Management
Users can explore incident records, inspect details, and work with severity and status information to understand the simulated situation.
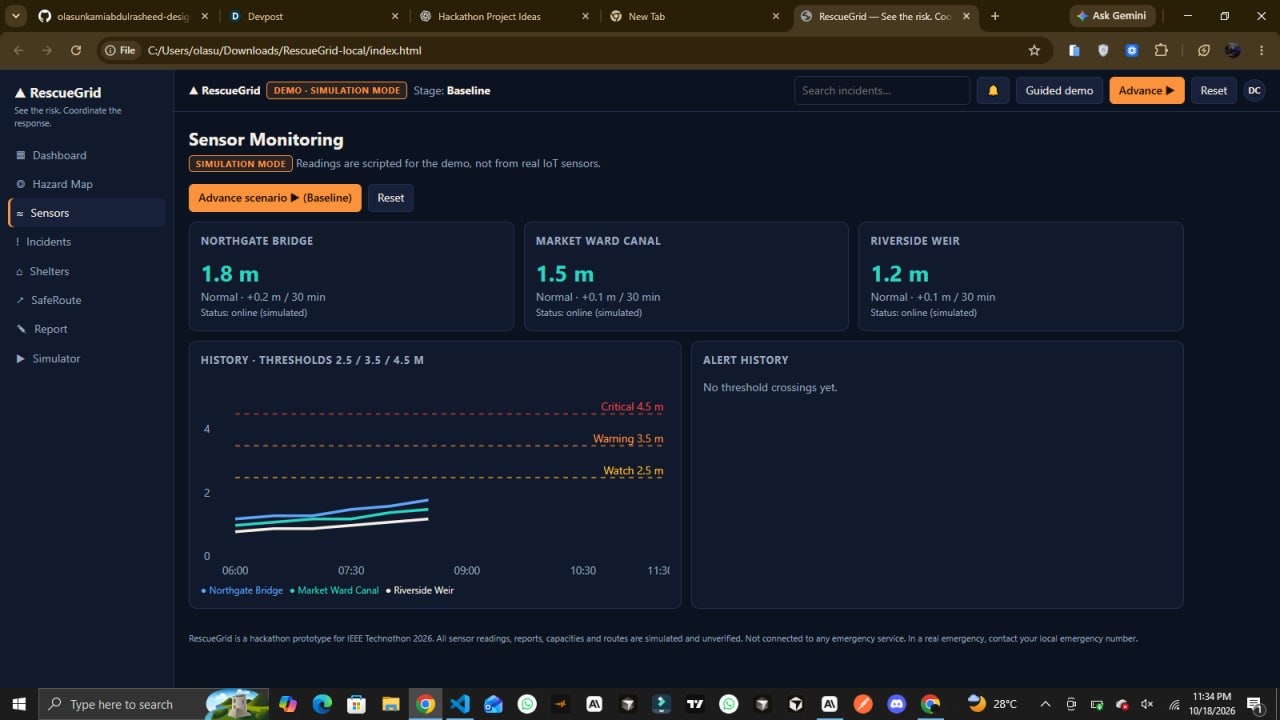
- Environmental Monitoring
Simulated sensor readings demonstrate how environmental conditions could contribute to situational awareness as an emergency develops.
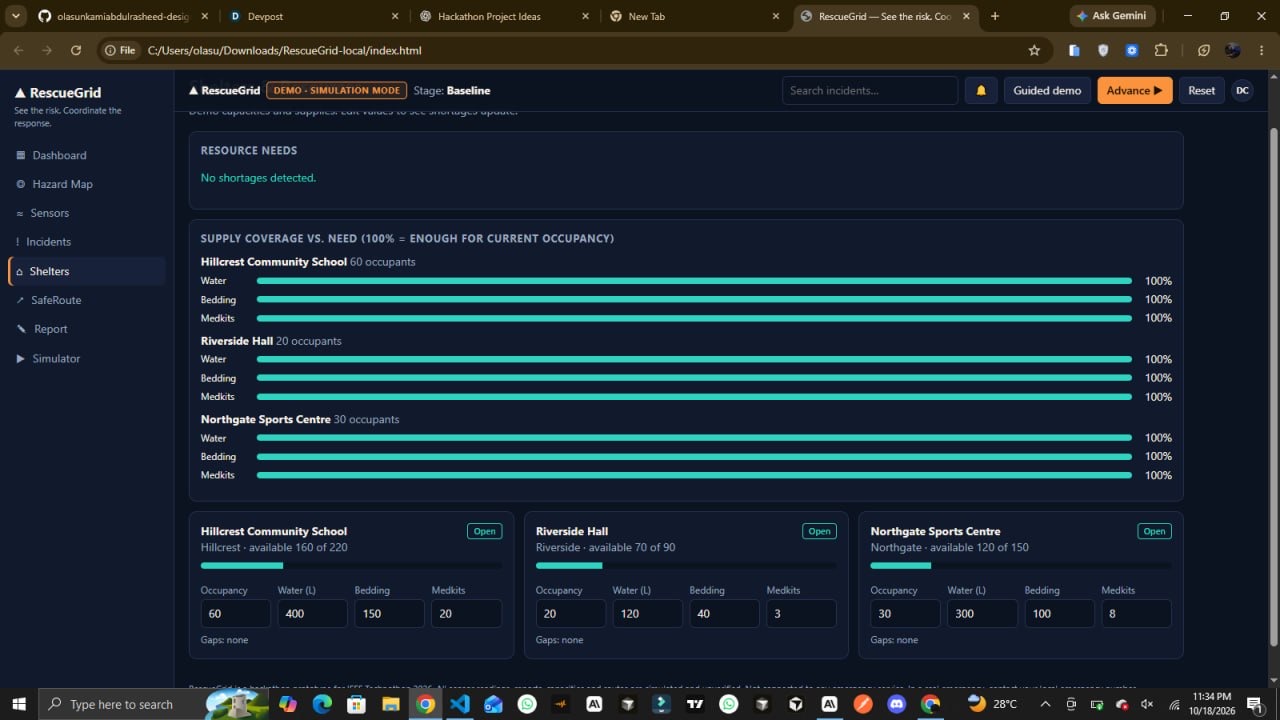
- Shelter and Resource Awareness
Shelter occupancy and resource coverage indicators help illustrate capacity pressures and potential shortages that response teams may need to consider.
- Community Incident Reporting
An interactive reporting workflow allows users to submit a report and receive a confirmation with an incident reference, demonstrating how community observations could enter a coordination workflow.
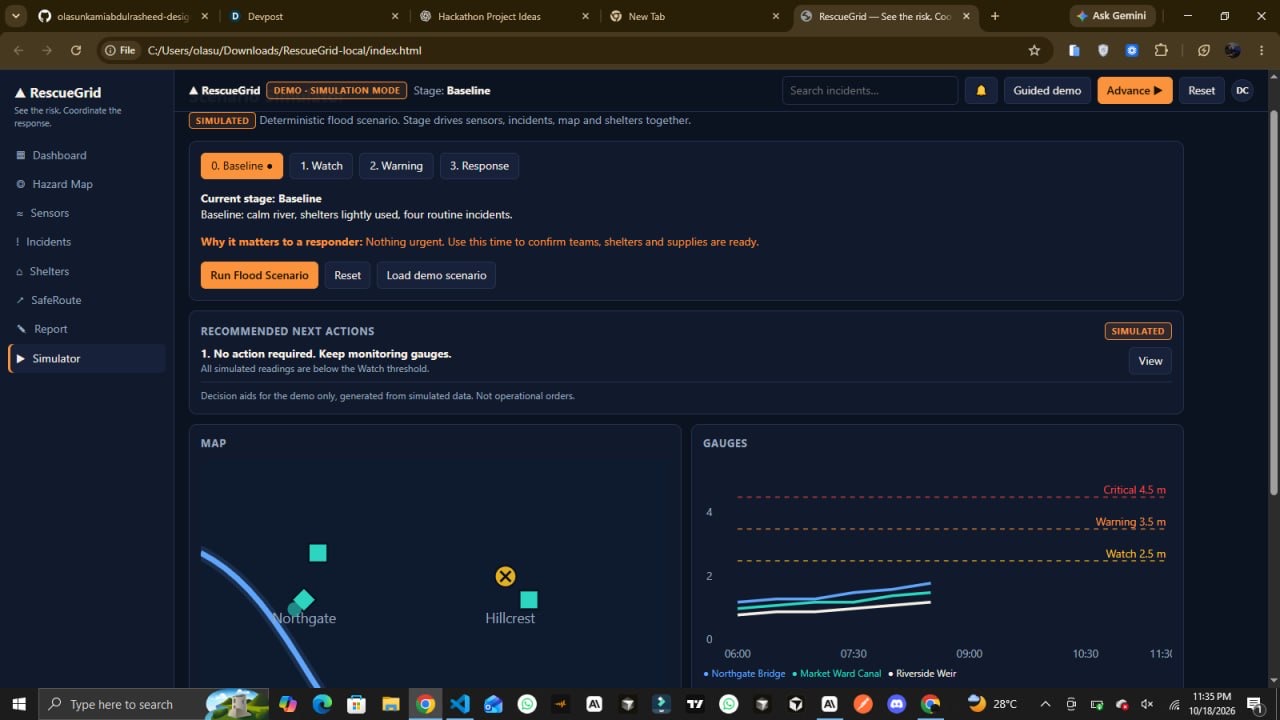
- Scenario-Based Response Planning
The scenario simulator progresses through four stages: Baseline → Watch → Warning → Response. Each stage demonstrates how conditions and recommended priorities can evolve within a controlled, repeatable scenario.
- Recommended Next Actions
The dashboard presents suggested actions related to the simulated situation, demonstrating how incident information could be translated into a more organized response workflow.
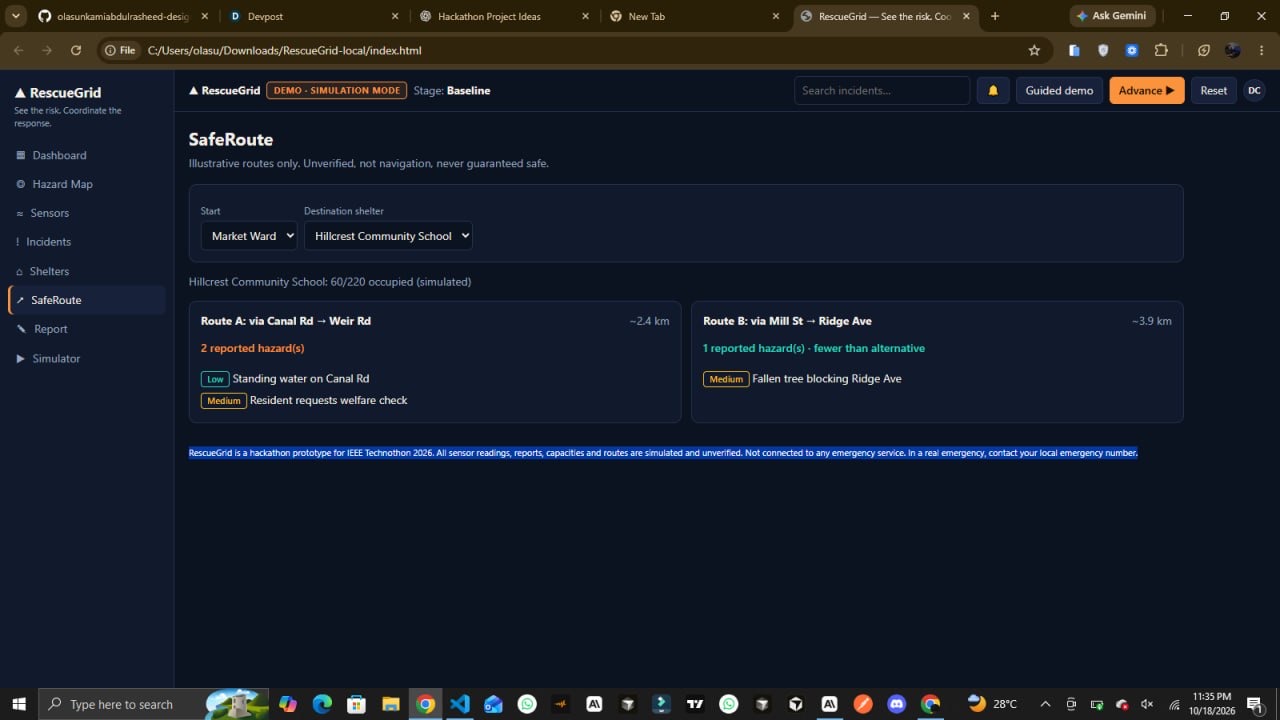
- Illustrative Route Visualization
Safe-route functionality demonstrates how route information could be incorporated into a wider disaster-response interface. It is illustrative, not a source of verified real-world navigation.
How It Works
RescueGrid brings its major workflows into a single dashboard:
- Review the overall situation through the command dashboard.
- Explore the hazard map and inspect simulated incidents.
- Monitor environmental readings, shelter occupancy, and resource coverage.
- Submit a community report through the reporting interface.
- Advance the scenario through its different stages.
- Review the recommended next actions for the current simulated conditions.
This creates a repeatable demonstration of how hazard awareness, incident tracking, resource visibility, and response planning could fit into one coordinated workflow.
Technology and Implementation
RescueGrid is built using HTML, CSS, and JavaScript as a self-contained web application.
The prototype combines interactive interface components, simulated incident and sensor data, a deterministic scenario simulator, and browser-based local storage for relevant persistence.
We chose this approach to make the concept accessible and straightforward to demonstrate without requiring a live backend or external emergency-service integrations. The application is deployed on Vercel, with its source code available on GitHub.
Engineering Challenges
One of the central challenges was organizing several interconnected disaster-response workflows without overwhelming the user with disconnected information.
We addressed this through a dashboard-oriented design that connects incidents, hazard visualization, shelter resources, and recommended actions. Another challenge was demonstrating how a situation could evolve without access to real sensor networks. A deterministic scenario simulator provides a repeatable way to explore changing conditions and response priorities.
We also focused on interaction feedback, readable information, and making the prototype practical to explore during a demonstration.
Potential Impact
RescueGrid explores a digital approach to a critical coordination problem: helping people responsible for emergency response maintain a clearer picture of a developing situation.
With further development and validation, this concept could be explored by disaster-management organizations, humanitarian teams, and community response coordinators. A more mature implementation could help authorized teams bring verified incident information and resource status into a shared operational view.
The prototype demonstrates a possible workflow, not proven improvements in response time or disaster outcomes. Those benefits would need to be evaluated through research, user testing, and real-world validation.
Future Development
Our next steps could include:
- Shared operational data: A backend for centralized incident records and synchronized updates across authorized users.
- Secure access controls: Authentication and role-based permissions for different response teams.
- Verified data integrations: Trusted sensor feeds and validated incident-reporting sources.
- Geospatial intelligence: Reliable mapping and routing services using current geographic and hazard information.
- Resource coordination: More detailed resource allocation and shortage tracking.
- Field validation: Usability testing with disaster-response professionals, alongside security, privacy, reliability, and safety assessments.
Responsible Use
RescueGrid currently uses fictional data for a simulated environment called Kestrel Valley. It is not connected to live sensors, emergency dispatch systems, or operational navigation services. Its sensor readings, incidents, routes, and scenario changes are demonstrations rather than real-time emergency information.
Any future operational version would require reliable data sources, secure infrastructure, validated routing, and testing with qualified response professionals.
Try RescueGrid
Live Demo: https://rescue-grid-gamma.vercel.app/
Source Code: https://github.com/olasunkamiabdulrasheed-design/RescueGrid
RescueGrid — See the Risk. Coordinate the Response.
Built With
- css
- guthub
- html
- javascript
- vercel

Log in or sign up for Devpost to join the conversation.