-

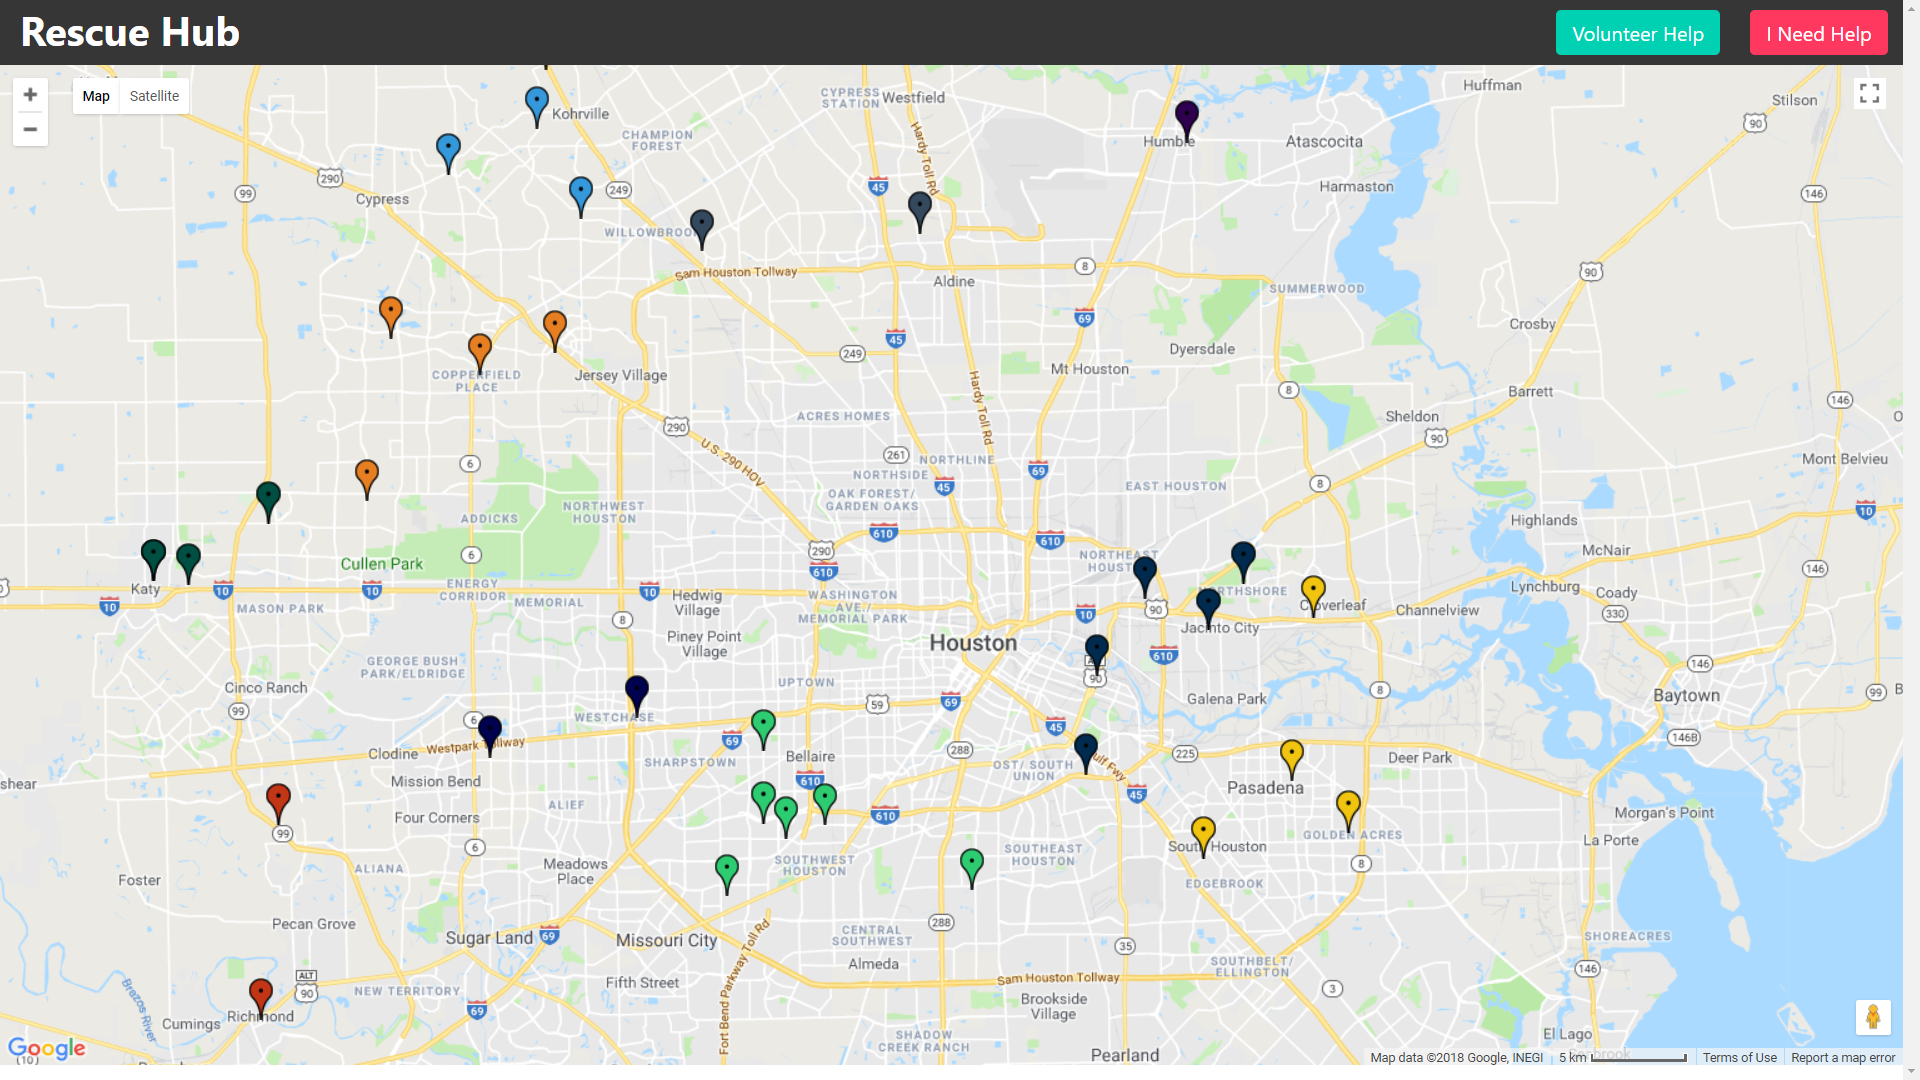
Homepage
-
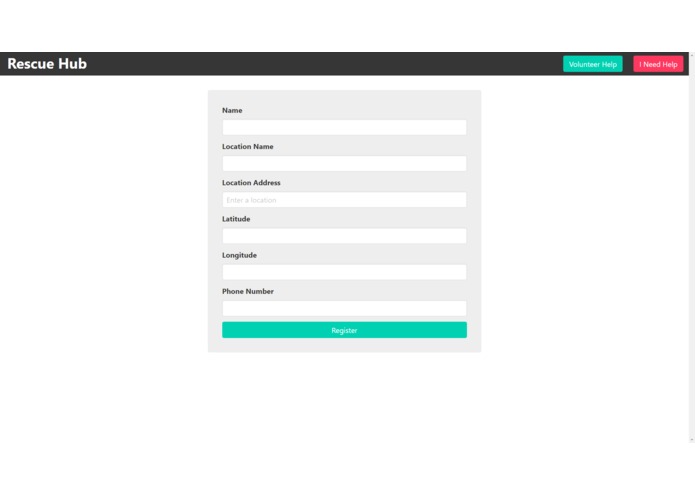
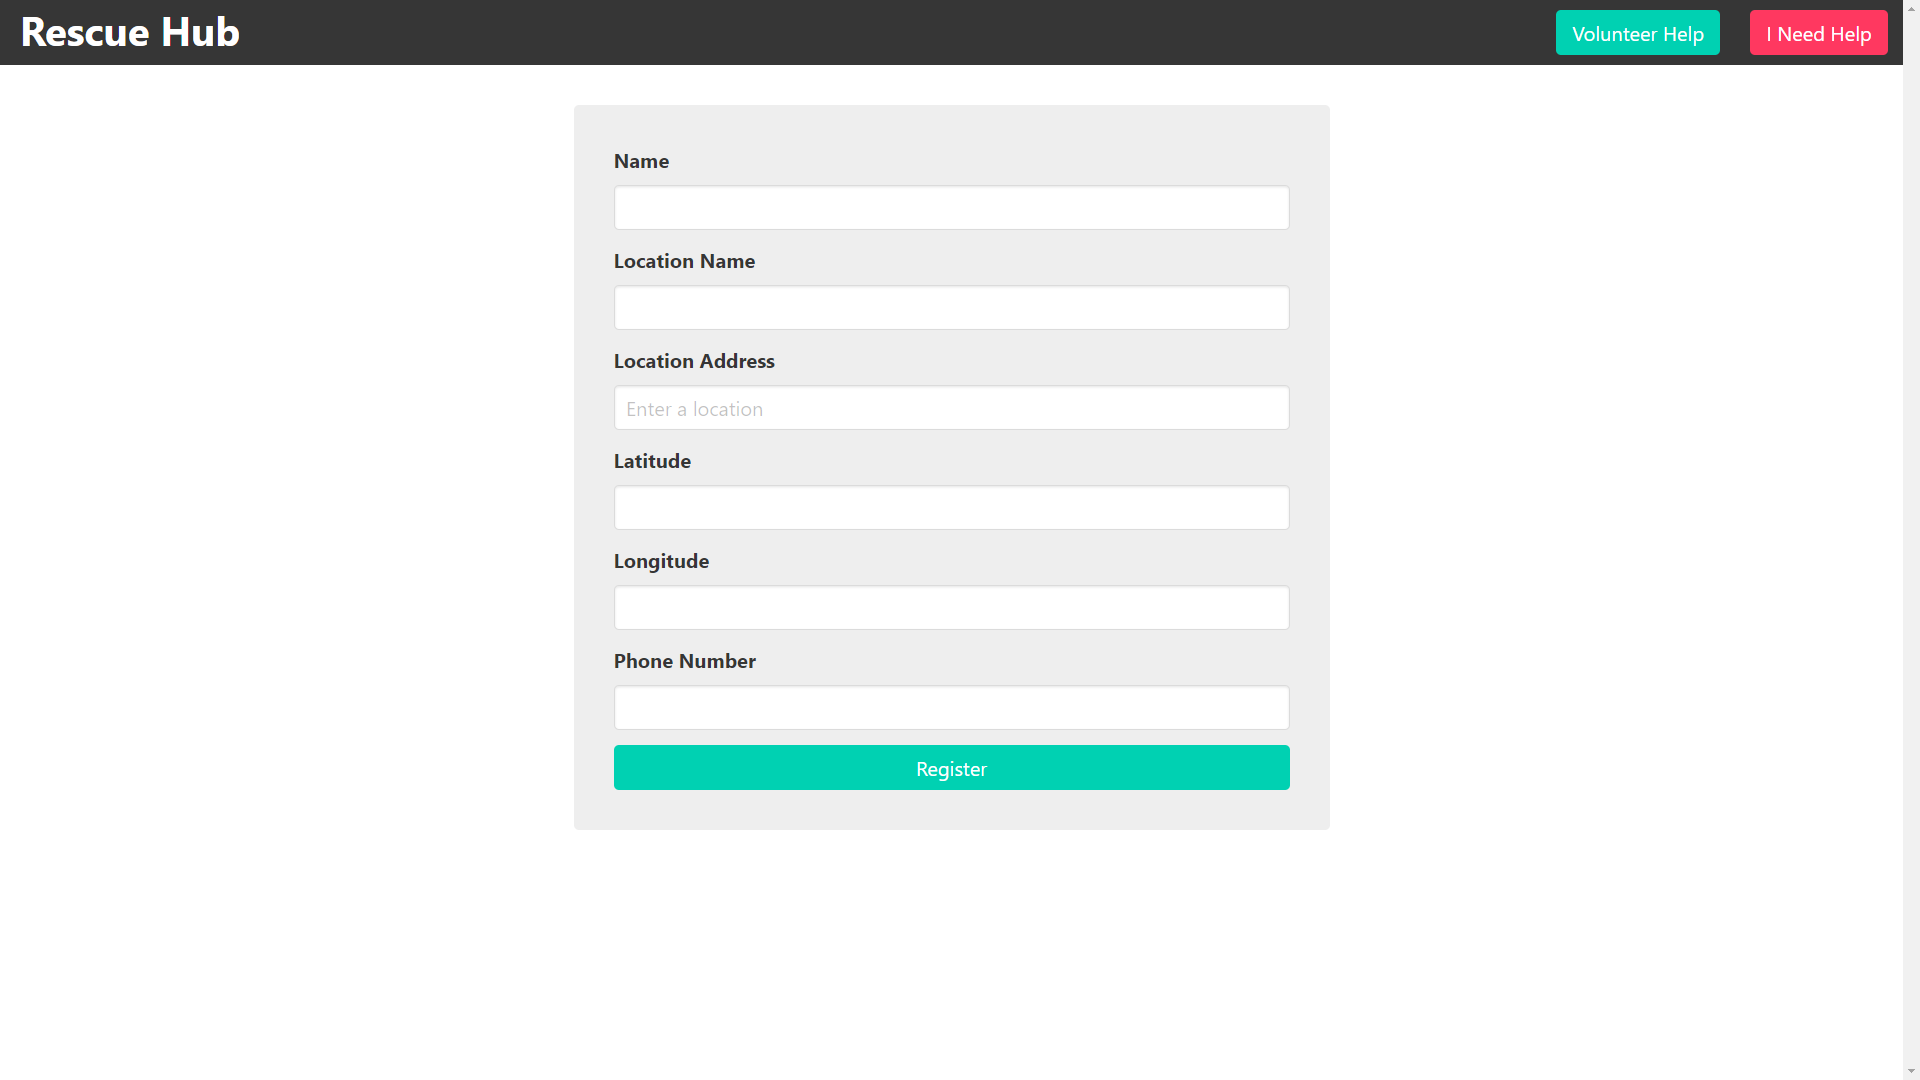
Rescuee Form
Presentation
Inspiration
During Hurricane Harvey, Houston received 80,000 911 calls every day, whereas the city's daily average is 8000 calls. In fact, on one of the days the average wait time was 22 minutes and 5 seconds. The average wait time during the three weeks was over 2 minutes. Some calls were even looped indefinitely and never got through.
What it does
Rescue_hub is an interface which clusters rescuees in the same area to optimize rescue resources and improve rescue efficiency. It also gives access to civilians who are willing to rescue but don't know how to. During emergency, a rescuee enters their information on the app, their location details are extracted through the database, clustered using K-Means, and posted with their relevant cluster on the map. A rescuer will be asked for info such as how many people they can rescue and what their location is, and the map directs them to the closest cluster accordingly.
How we built it
On the front end, we used the Google Maps API to display a map of Houston. We have a form for rescuees, to input their details. This info is stored in an Postgres database. To cluster rescuees closeby, we employed R to perform K-Means Clustering, and integrated that with the Python backend using PostgreSQL.
Challenges we ran into
We were initially doing MapReduce to Map rescuees to the table, and Reduce them to a cluster, which was getting very complicated. We then switched to using K-Means in R. We also ran into deployment problems in Heroku due to lack of direct integration with R.
Accomplishments that we're proud of
Great team integration. Brought an idea to production in 24 hours. Learned new technologies (R, Google API, Clustering). Learned to solve deployment issues.
What's next for rescue_hub
Rescuer geolocation for accurate mapping. Emergency priority (detailed for more accurate information). Safe routes to take during rescue operation.

Log in or sign up for Devpost to join the conversation.