-
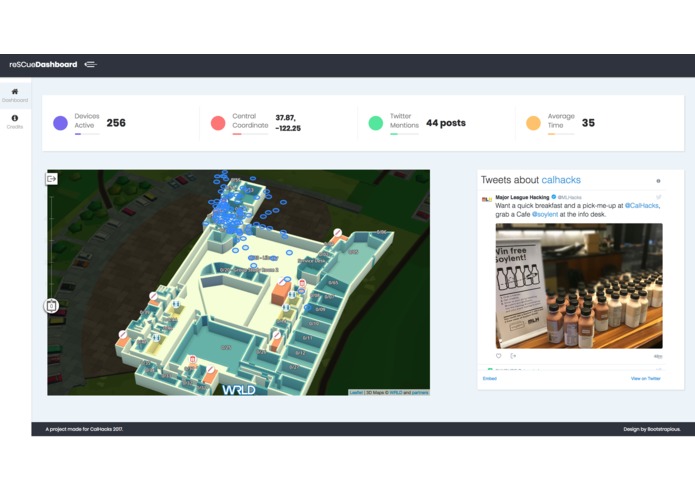
Dashboard with locations of individuals in a building's interior, alongside Twitter feed and analytics.
-
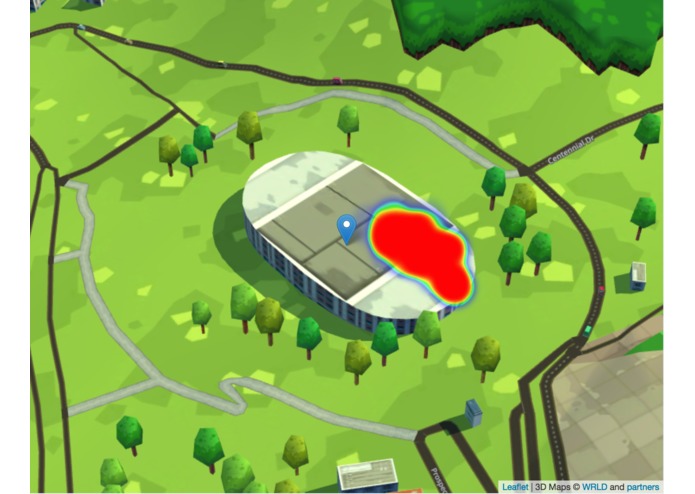
Outdoor heatmap of stadium.
Inspiration
Everybody carries a smartphone nowadays. Communication technologies contained within these devices could provide invaluable data for first responders, safety personnel, hosts of events, and even curious individuals. Furthermore, we combine quantitative data with context from social media to provide further insight to the activities of an area.
What it does
reSCue is a web application that empowers first responders to view a live heatmap of a region as well as precise locations of individuals within a building if floor plan data exists. A live Twitter feed is viewable alongside the map to provide context for activity occurring within a given location.
How we built it
We utilized WRLD API to create 3D heatmaps of regions as well as the interiors of buildings. Cisco Meraki API was used to gather the location data of individuals from installed routers. Socket.io was used to update the client with real-time data. Twitter API was used to power the activity feed.
The front-end was built with Bootstrap while the back-end ran on a node.js server. The project source is viewable at https://github.com/DenimMazuki/reSCue.
Challenges we ran into and what we learned
Coding to properly overlay the heatmap in different contexts on the map forced us to account for different use cases. Pipelining data between APIs required extensive reading of documentation.
Accomplishments that we're proud of
This was the first hackathon for most of our team members. We learned much during this 36 hour journey about new and unfamiliar technologies and project management. We're proud of our product, which provides the users with a clean, beautiful experience where they can visualize and interact with the data they expect to see.
What's next for reSCue
The technology behind reSCue may be ported to other applications, such as tracking events, office traffic, etc. As more interior data becomes available, the application will only become more useful. Features that may prove to be useful in the future include a timeline to view historical location data, analysis of social media feeds to highlight topics and events being discussed, notifications of spikes in traffic, and data from sources, such as USGS and NOAA.

Log in or sign up for Devpost to join the conversation.