-
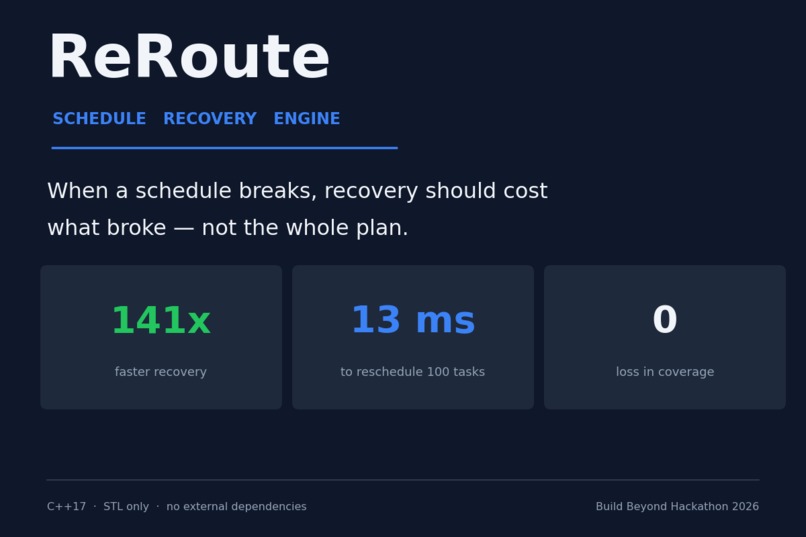
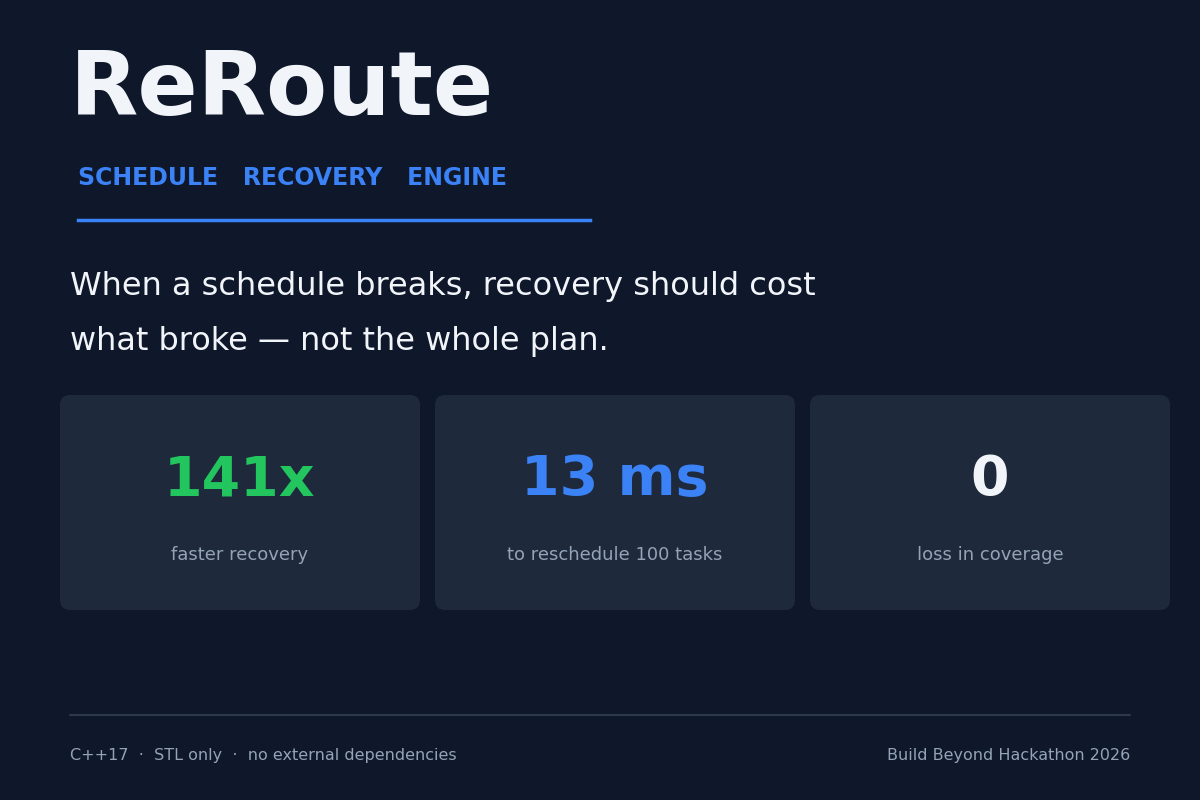
ReRoute repairs only the broken part of a schedule: 141x faster recovery than a full rebuild, with identical coverage.
-
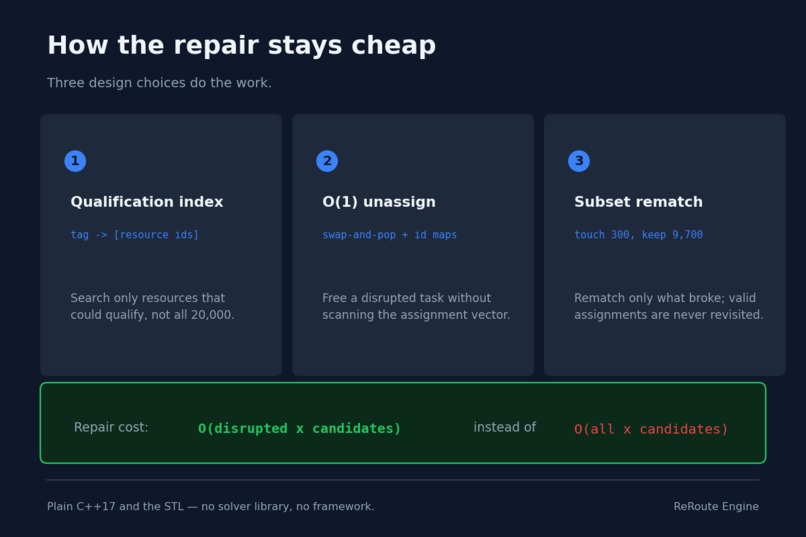
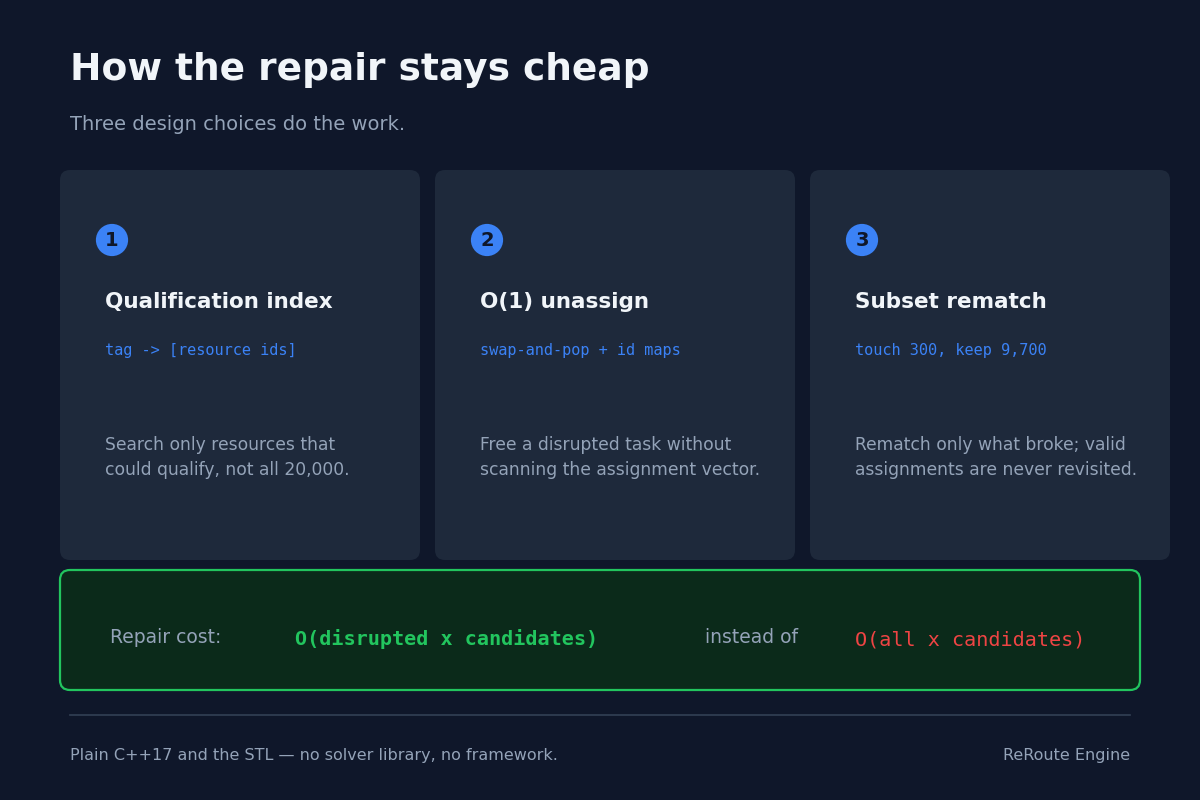
Three design choices keep the repair cheap: qualification index, O(1) unassign, and rematching only the affected subset.
-
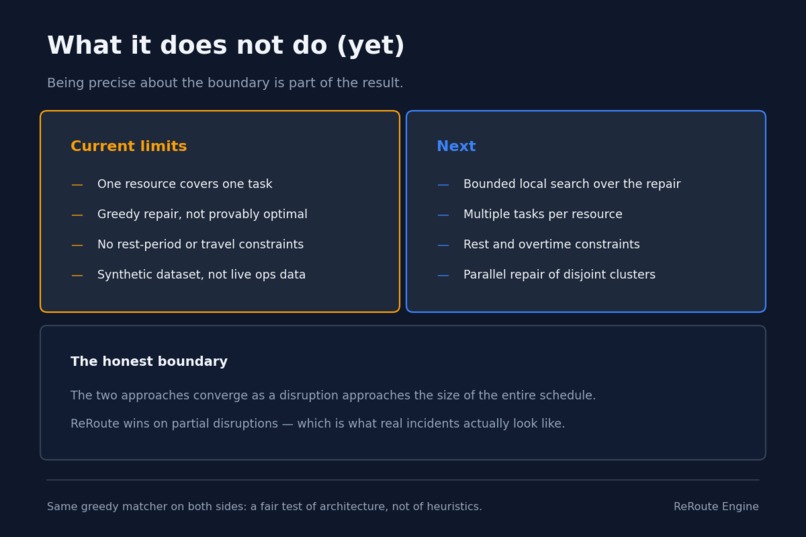
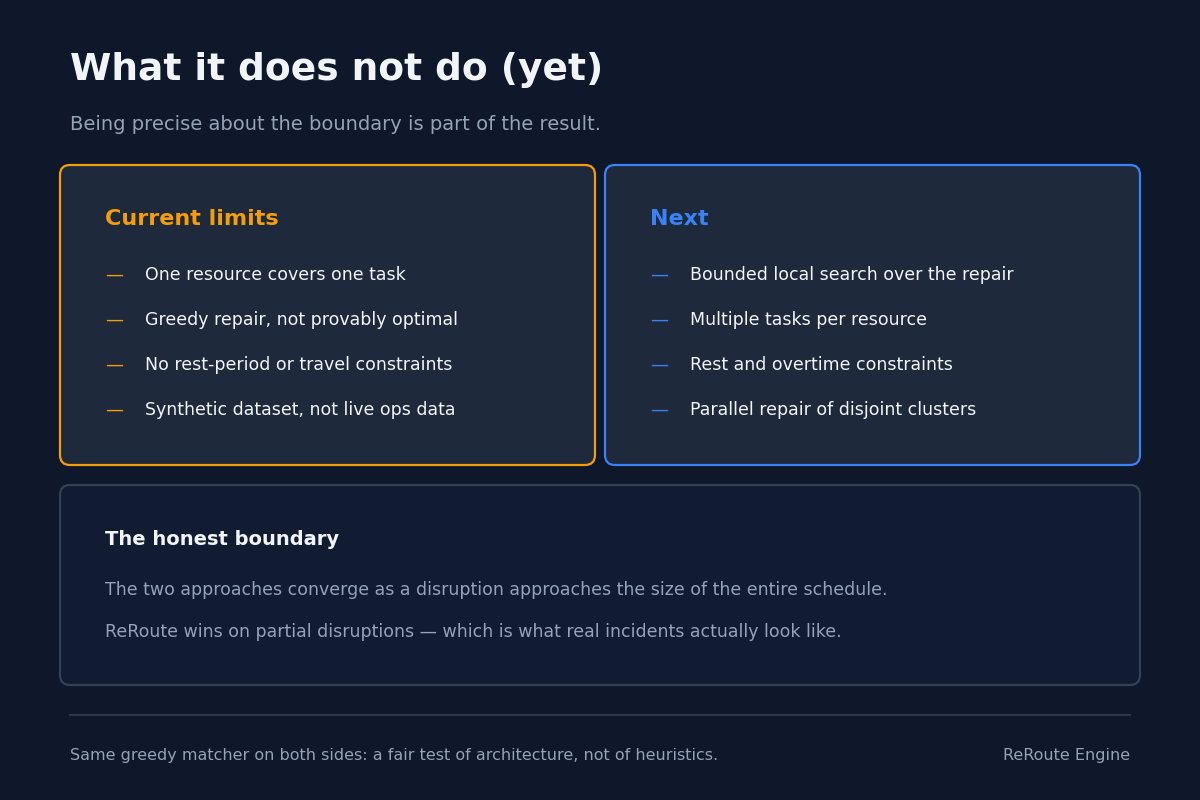
The limits, stated plainly: where the approach stops winning, and what comes next.
-
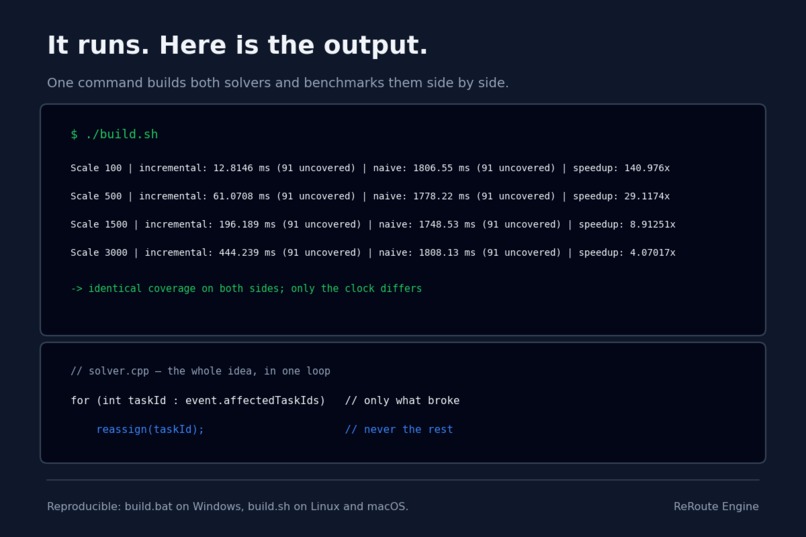
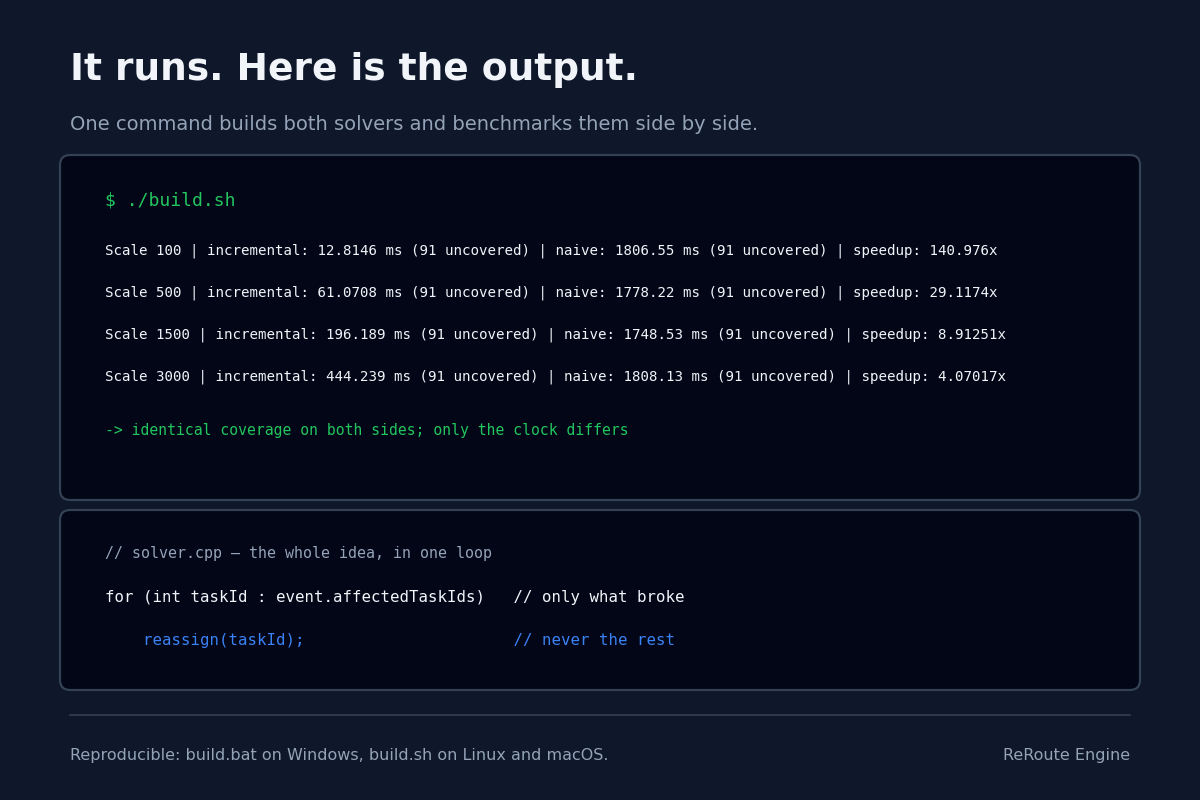
Real output from one build command: both solvers benchmarked side by side, plus the loop that does the work.
-
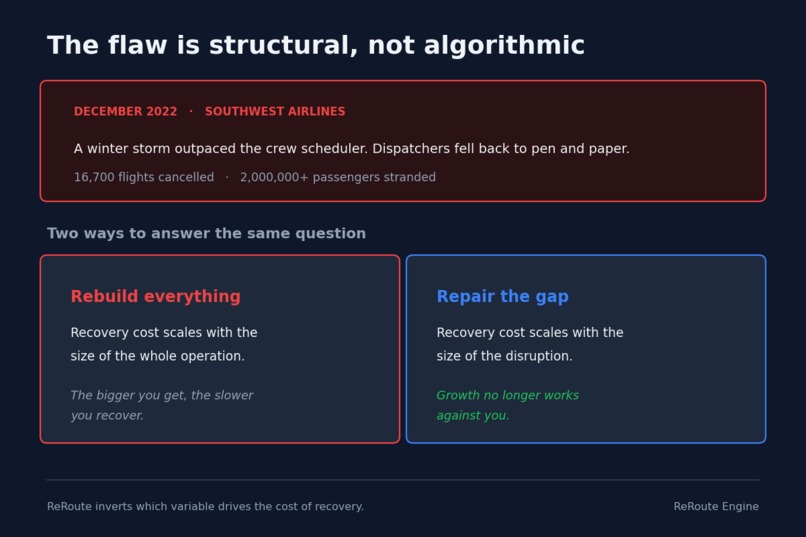
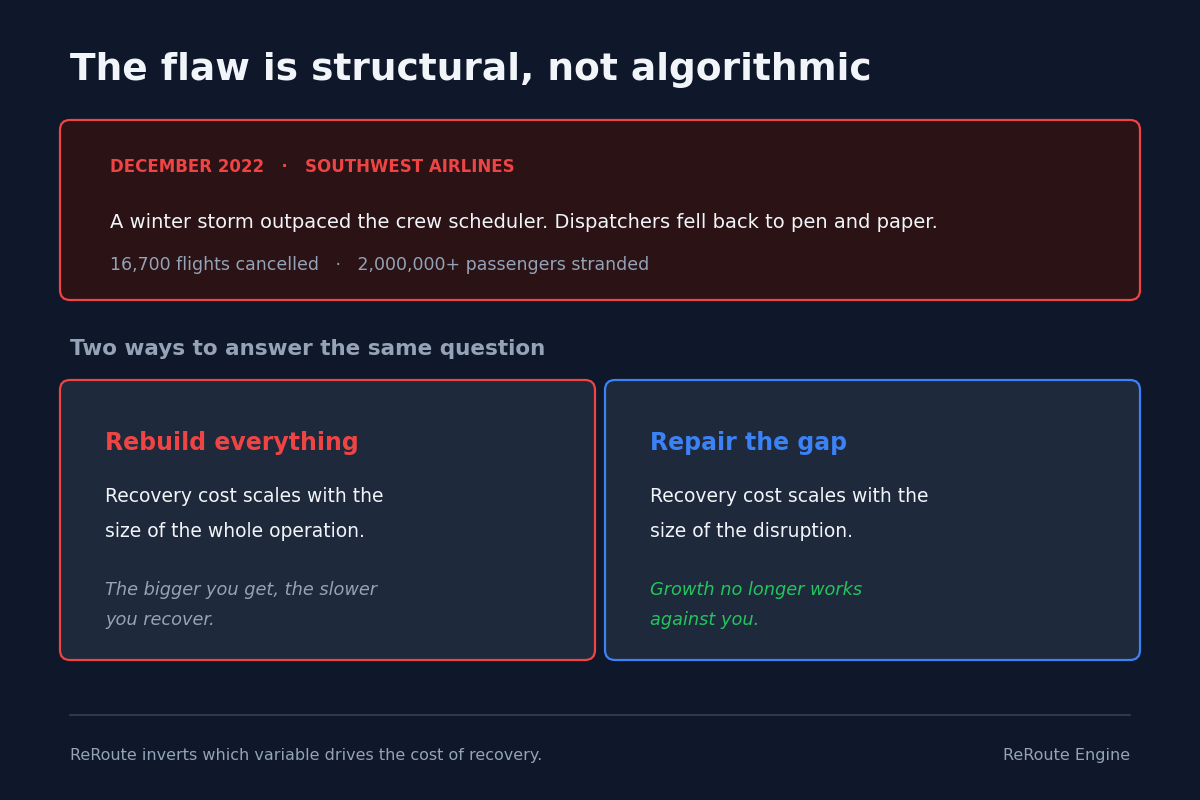
Dec 2022: a storm outpaced Southwest's crew scheduler. The flaw was structural, not algorithmic.
-
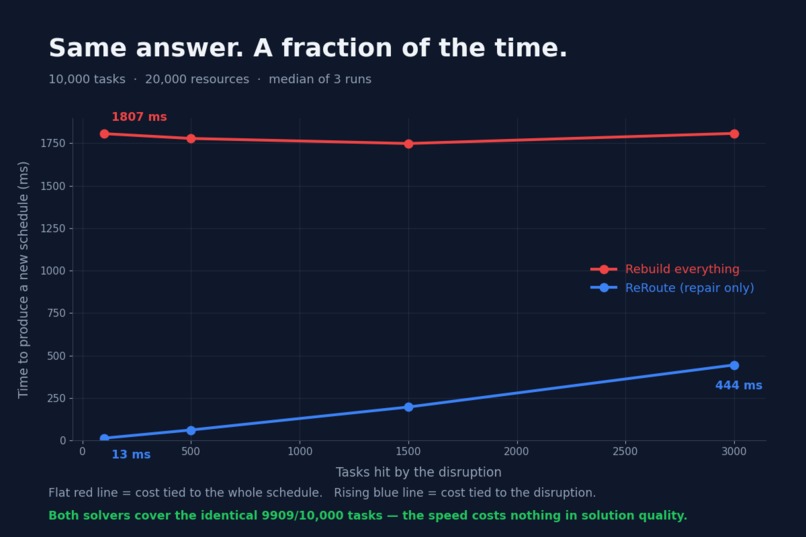
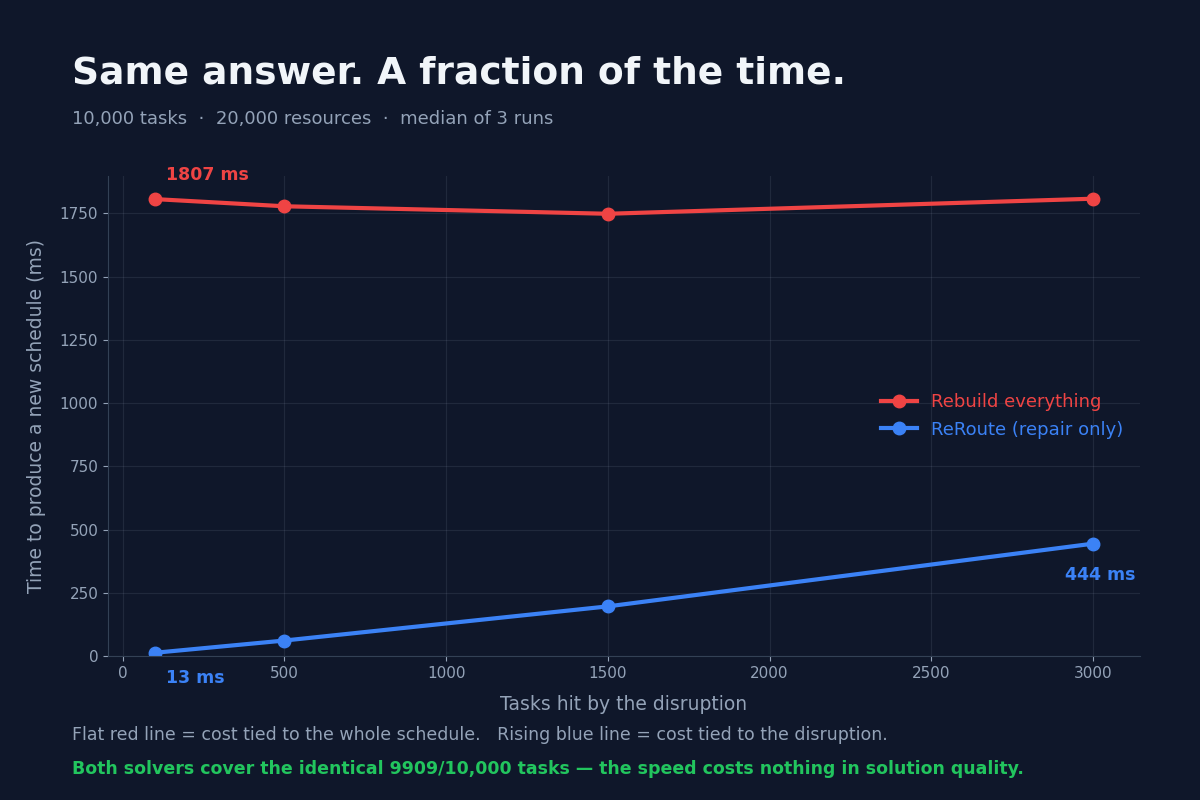
Full rebuild stays flat near 1800 ms; repair tracks the disruption. Both cover the identical 9909 of 10000 tasks.
Inspiration
In December 2022, a winter storm hit Southwest Airlines. Their crew scheduling system, SkySolver, couldn't keep up with the volume of reassignments, and dispatchers ended up organizing crews by hand. The airline cancelled 16,700 flights over ten days and stranded more than two million passengers.
What stuck with me wasn't that the algorithm was wrong — it's where the failure came from. A scheduler that rebuilds the entire plan on every disruption has a recovery cost tied to the size of the whole operation. So the bigger the airline, the slower it recovers, precisely when speed matters most. That's a backwards incentive built into the architecture, and it seemed like something worth attacking directly.
What it does
ReRoute is a C++ engine that reassigns resources to tasks after a disruption by repairing only the affected subset, instead of recomputing everything.
On a 10,000-task schedule with 20,000 available resources:
| Tasks disrupted | Full recompute | ReRoute | Speedup |
|---|---|---|---|
| 100 | 1,807 ms | 13 ms | 141x |
| 500 | 1,778 ms | 61 ms | 29x |
| 1,500 | 1,749 ms | 196 ms | 9x |
| 3,000 | 1,808 ms | 444 ms | 4x |
Both approaches leave exactly the same 91 tasks uncovered (99.1% coverage), so the speed costs nothing in solution quality.
The full-recompute line is flat because its cost depends on the whole schedule. ReRoute's line grows with the disruption — which is the entire point.
The data model is domain-agnostic on purpose. A Resource can be a crew
member, a warehouse worker or a loading dock; a Task can be a flight leg, a
shift or a truck arrival window. Airline crew scheduling is just the most
recognizable way to tell the story.
How I built it
Plain C++17 and the STL — no external dependencies in the engine.
- Initial assignment — greedy matching over tasks sorted by priority.
- Qualification index — a
tag → [resource indices]map, so the search only scans resources that could possibly qualify instead of all 20,000. - Incremental repair — on a disruption, free the resources tied to the
affected tasks and rematch only those. Removal from the assignment vector
is O(1) via swap-and-pop backed by
taskId → indexmaps, instead of an O(n) linear scan.
Repair cost is O(affected tasks × candidate resources) rather than O(all tasks × candidate resources).
To prove the claim rather than assert it, I built a deliberate "legacy" baseline that recomputes from scratch on every event, and benchmarked the two side by side. Results are written to JSON and rendered in a small Chart.js dashboard.
Challenges I ran into
My first benchmark lied to me — in my own favor's opposite direction. I was running disruption scales of 300/1,000/5,000/10,000 against a dataset of only 2,000 tasks. The larger scales silently clamped to the full task set, so "incremental repair" was actually doing a full recompute and appeared slower than the baseline. Sizing the dataset above the largest disruption fixed it. It was a good reminder that a benchmark measuring the wrong thing is worse than no benchmark.
Timing noise buried the trend. Single measurements had the baseline bouncing between 1,988 ms and 3,027 ms — a ~50% swing that made the chart look random. Taking the median of 3 runs brought the variance down to ~4% and the curve became readable.
Coverage looked alarming until I found the modeling bug. Half the tasks were coming back uncovered. The cause wasn't the algorithm: with one resource able to cover only a single task, 5,000 resources simply cannot serve 10,000 tasks. Sizing the pool correctly brought coverage to 99.1%.
What I learned
Choosing what to recompute is often a bigger lever than optimizing how you compute. The inner loop here is a fairly ordinary greedy matcher — the speedup comes almost entirely from the decision to not touch the 9,700 assignments that were still perfectly valid.
I also learned to distrust my own benchmarks. Every meaningful number in this project changed at least once after I found a flaw in how I was measuring it.
Honest limitations
- One resource covers one task. No modeling of a crew flying several non-overlapping legs — hence the resource pool larger than the task set.
- Greedy repair, not optimal repair. No backtracking or swapping with already-assigned tasks. Coverage matches the baseline because the baseline is greedy too: this is a fair comparison of architectures, not a claim of optimality.
- Simplified constraints. Qualifications and availability windows are enforced; mandatory rest periods, travel time and overtime costs are not.
- Synthetic data, not real operational data.
- The two approaches converge as a disruption approaches the size of the whole schedule. ReRoute wins on partial disruptions — which is what real incidents look like.
What's next
- Bounded local search (augmenting-path swaps or simulated annealing) layered on top of greedy repair
- Multiple tasks per resource with time-window conflict detection
- Rest-period and overtime constraints
- Parallel repair for independent disruption clusters
Intended audience
Anyone running operations where a plan has to survive contact with reality: airline crew scheduling, warehouse shift and dock allocation, field service dispatch, hospital staff rostering.
Built With
- c++
- c++17
- chart.js
- cmake
- html
- javascript
- matplotlib
- python
- stl

Log in or sign up for Devpost to join the conversation.