-
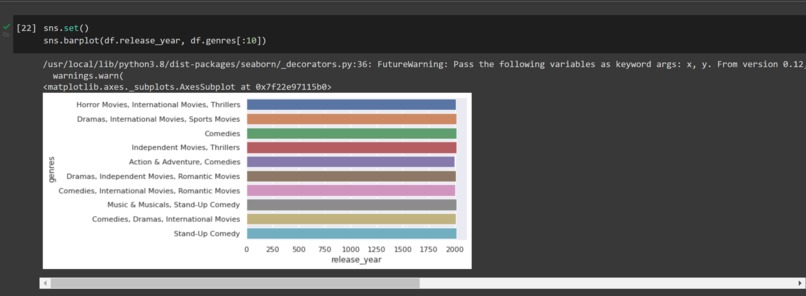
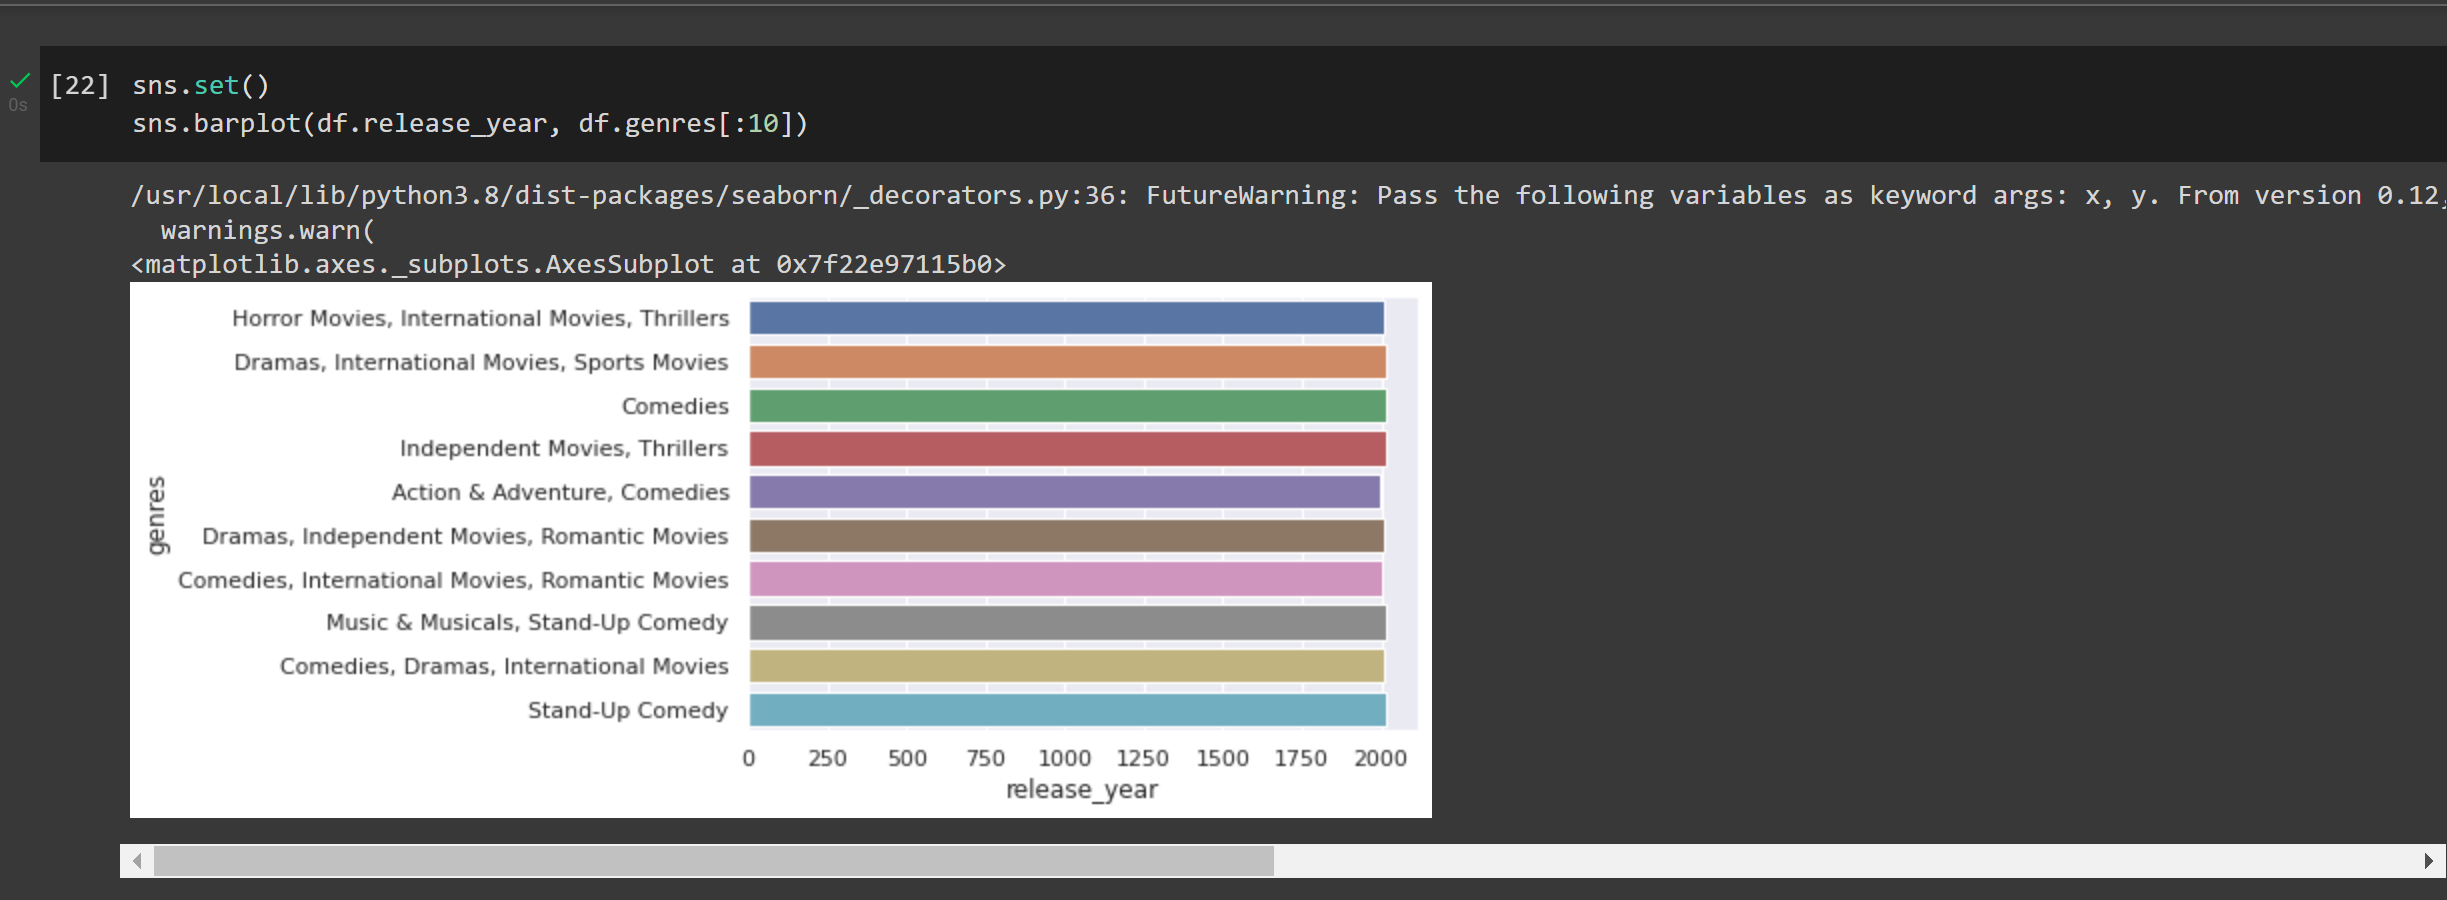
Bar graph of Relase_year v/s genre
-
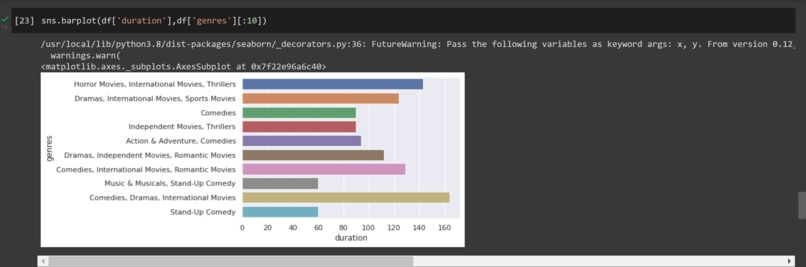
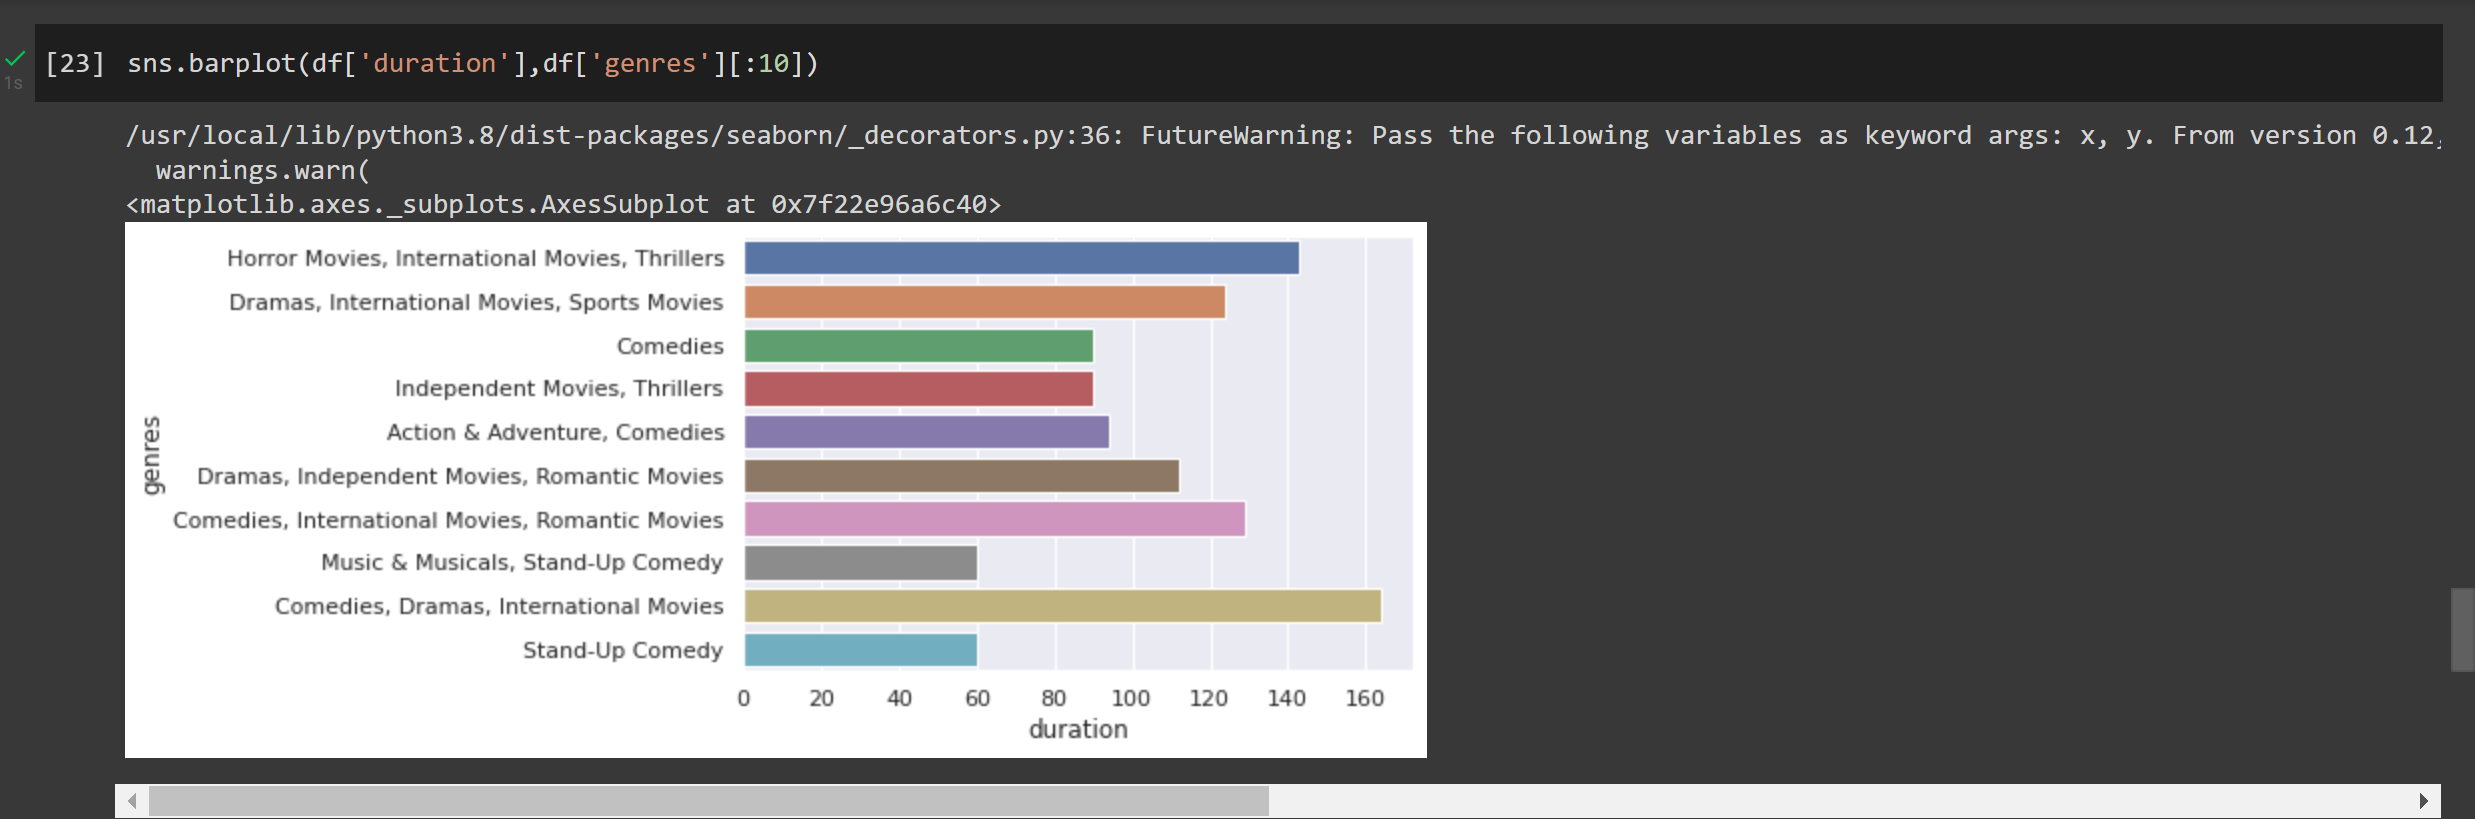
Bar graph of duration v/s genres
-
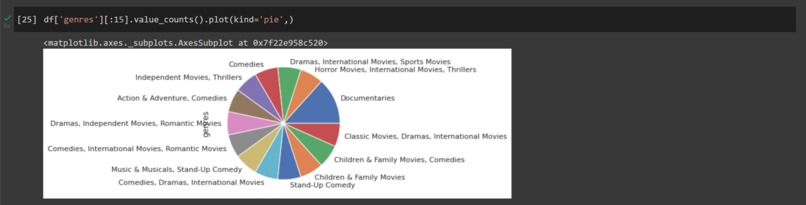
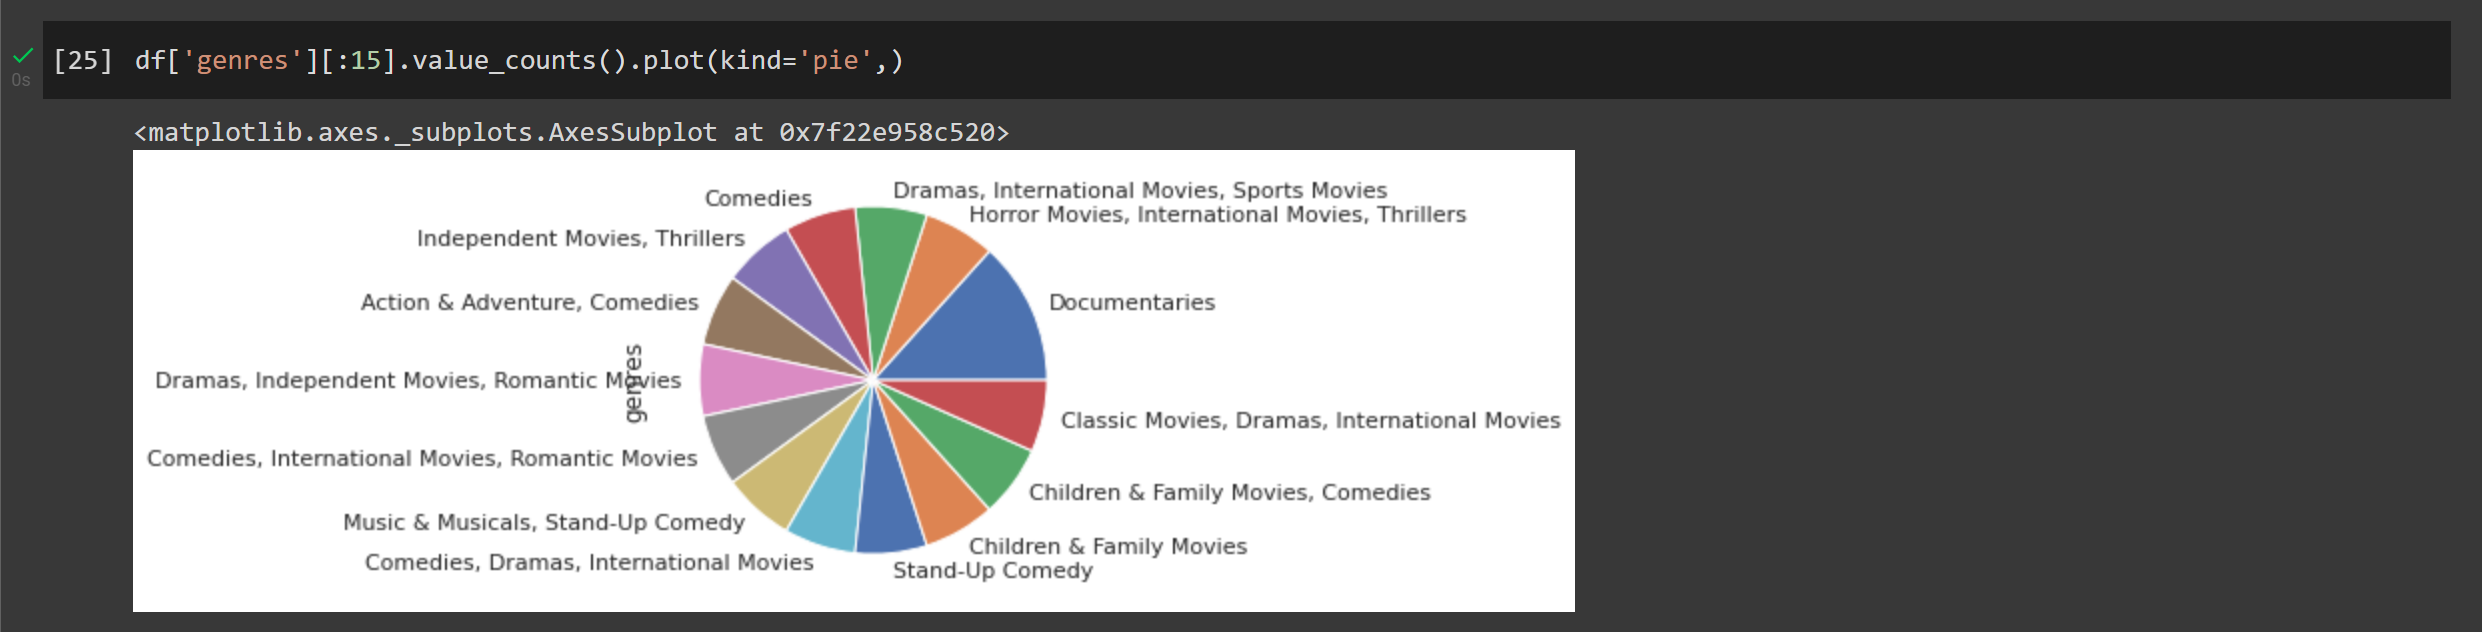
Pie chart of genres value count
-

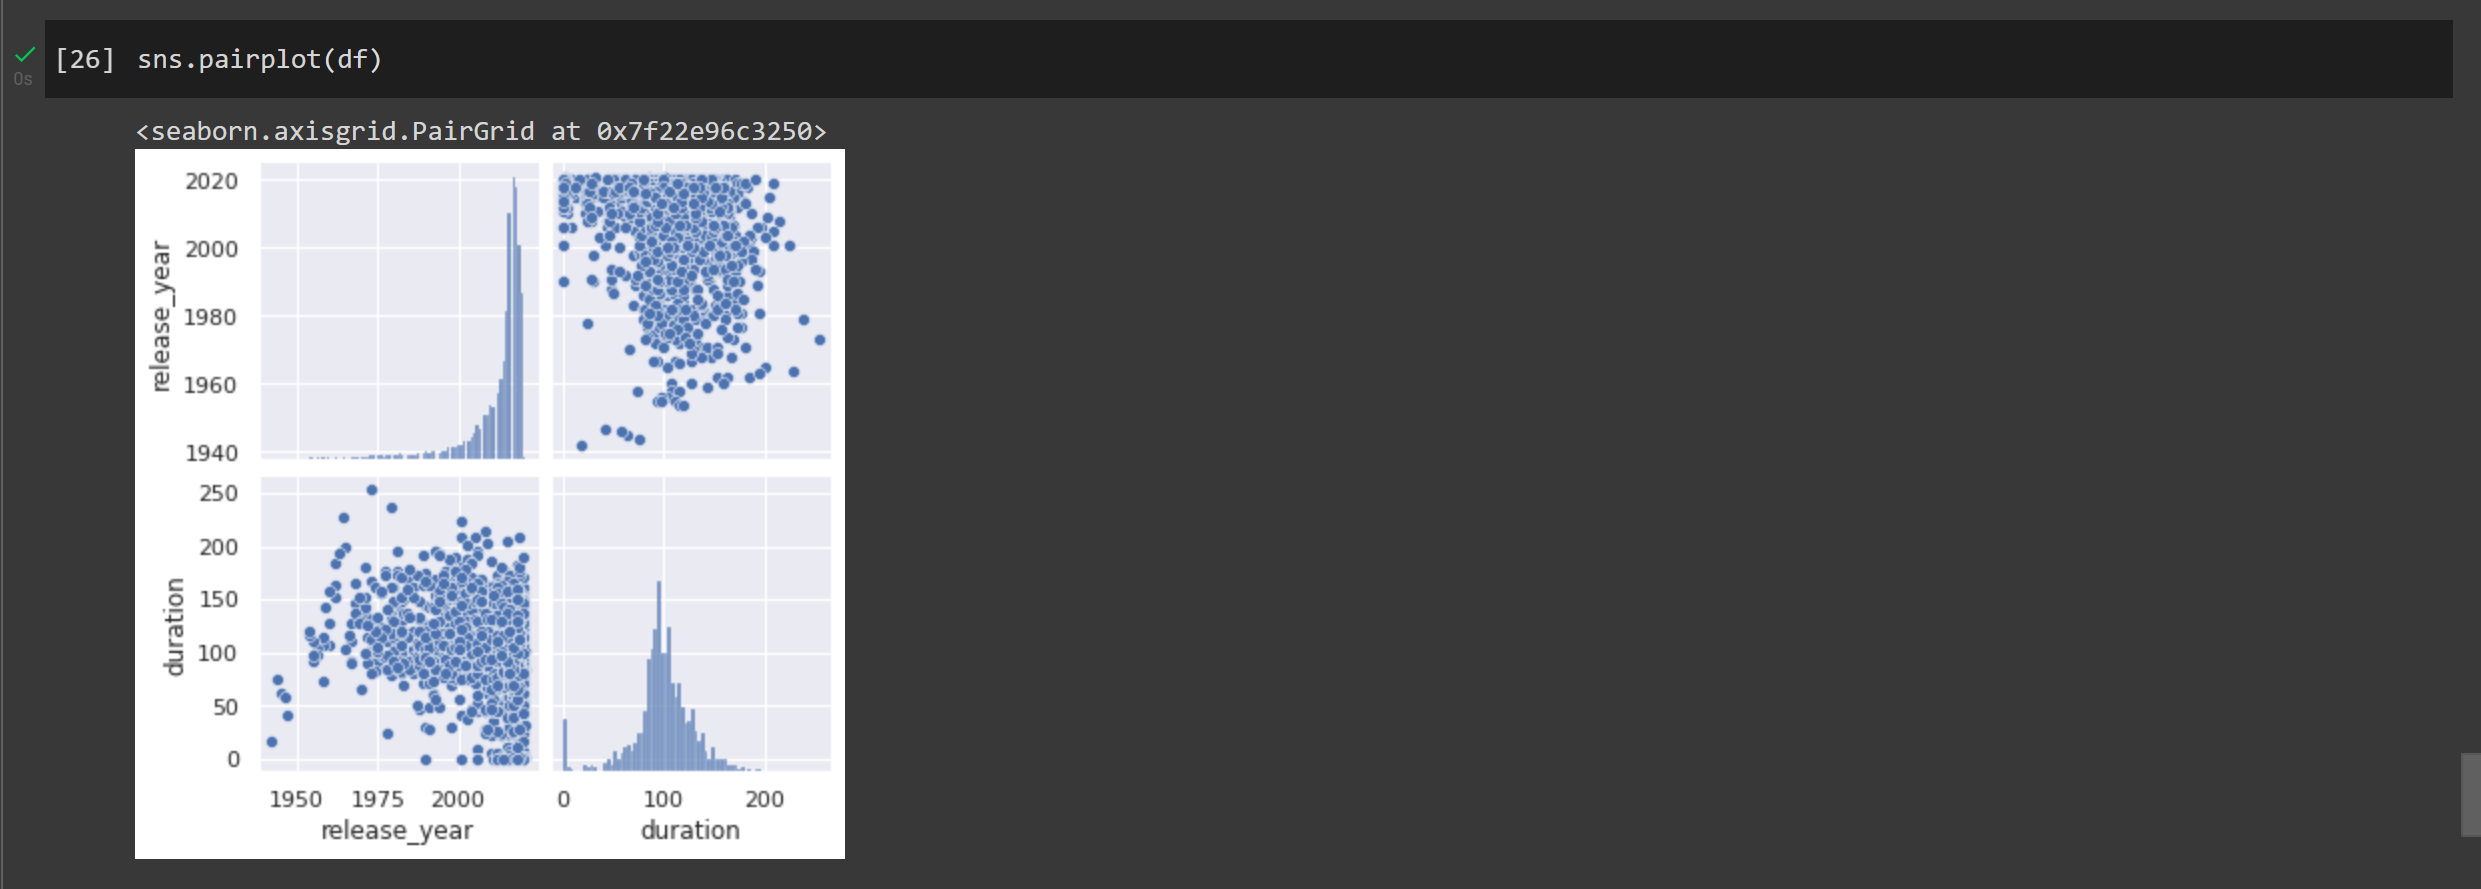
Pair plot of release_year and duration
-
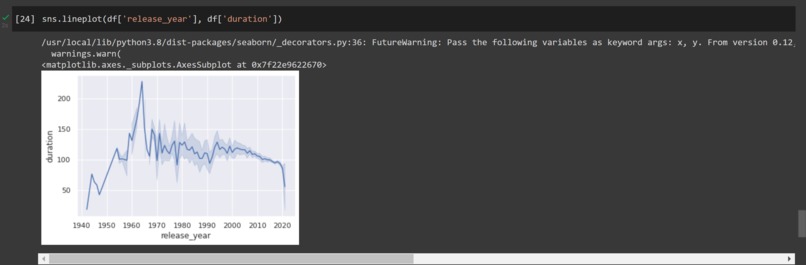
line graph of release_year and duration

Inspiration
Learning and exploring different python libraries for data visualisation.
What it does
It visualises the statistics of Netflix latest tv shows and movies.
How we built it
Used Python libraries: pandas, matplotlib and seaborn.

Log in or sign up for Devpost to join the conversation.