-
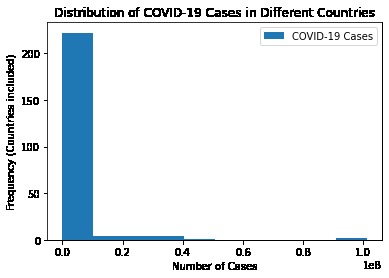
histogram
-
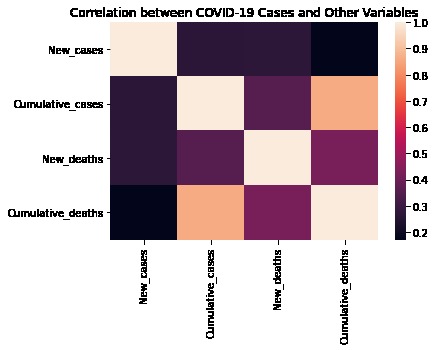
heatmap
-
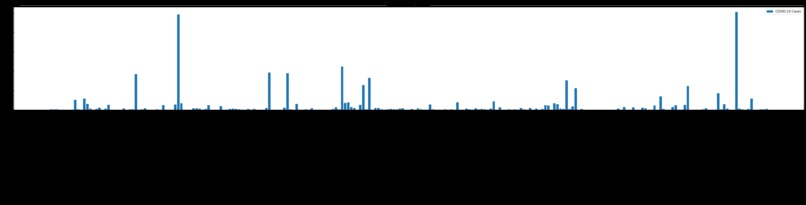
bar-chart
-
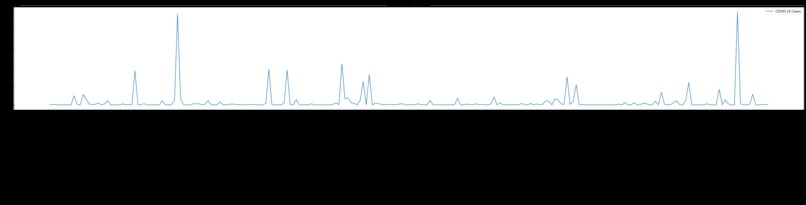
line-graph


Inspiration
I like data visualization and learning new tools to do it, this project was a great idea to further my skills of data visualization with an already used library matplotlib, and a new one, seaborn.
What it does and how
I have taken the latest global covid-19 pandemic data from WHO (World Health Organization) website, from 2020-01-03 until 2023-02-10. I selected countries and new cases recorded during the mentioned date day vise, grouped the data country vise, and used matplotlib and seaborn to visualize the country vise cases during this duration. I created a line graph, bar chart, histogram, and heatmap for the selected data.
Challenges we ran into
As I was new to the seaborn library, therefore, got into some syntax and other issues but with some dedication, I figured them out.
Accomplishments and learning that I'm proud of
I am so happy that I learned about seaborn in this project, read some documentation, and created my own for the project on GitHub.
What's next for Represent a Dataset Pictorially
We can use the code and format to visualize important data about climate change and its impact on life. We can also deduce other visualizations from this dataset, like country vises monthly cases, and see where the surge in cases happened for a particular region and may try to find the reasons behind the surge in cases.
Thank you!
Built With
- google-notebook
- matplotlib
- pandas
- python
- seaborn


Log in or sign up for Devpost to join the conversation.