Project Story
I built RepoAtlas because I kept hitting the same problem every time I joined a new codebase: the first few hours were spent guessing where to start, what mattered, and where the risks were. I wanted a tool that could turn a repository into a clear, structured brief so onboarding and architecture reviews felt less like detective work.
What inspired me
I was inspired by the gap between documentation and reality in many projects. READMEs are helpful, but they are often incomplete or outdated. I wanted something that could read the codebase itself and generate a trustworthy map of:
- how the project is organized,
- where the important files are,
- where the risky hotspots live, and
- how to run and contribute quickly.
How I built it
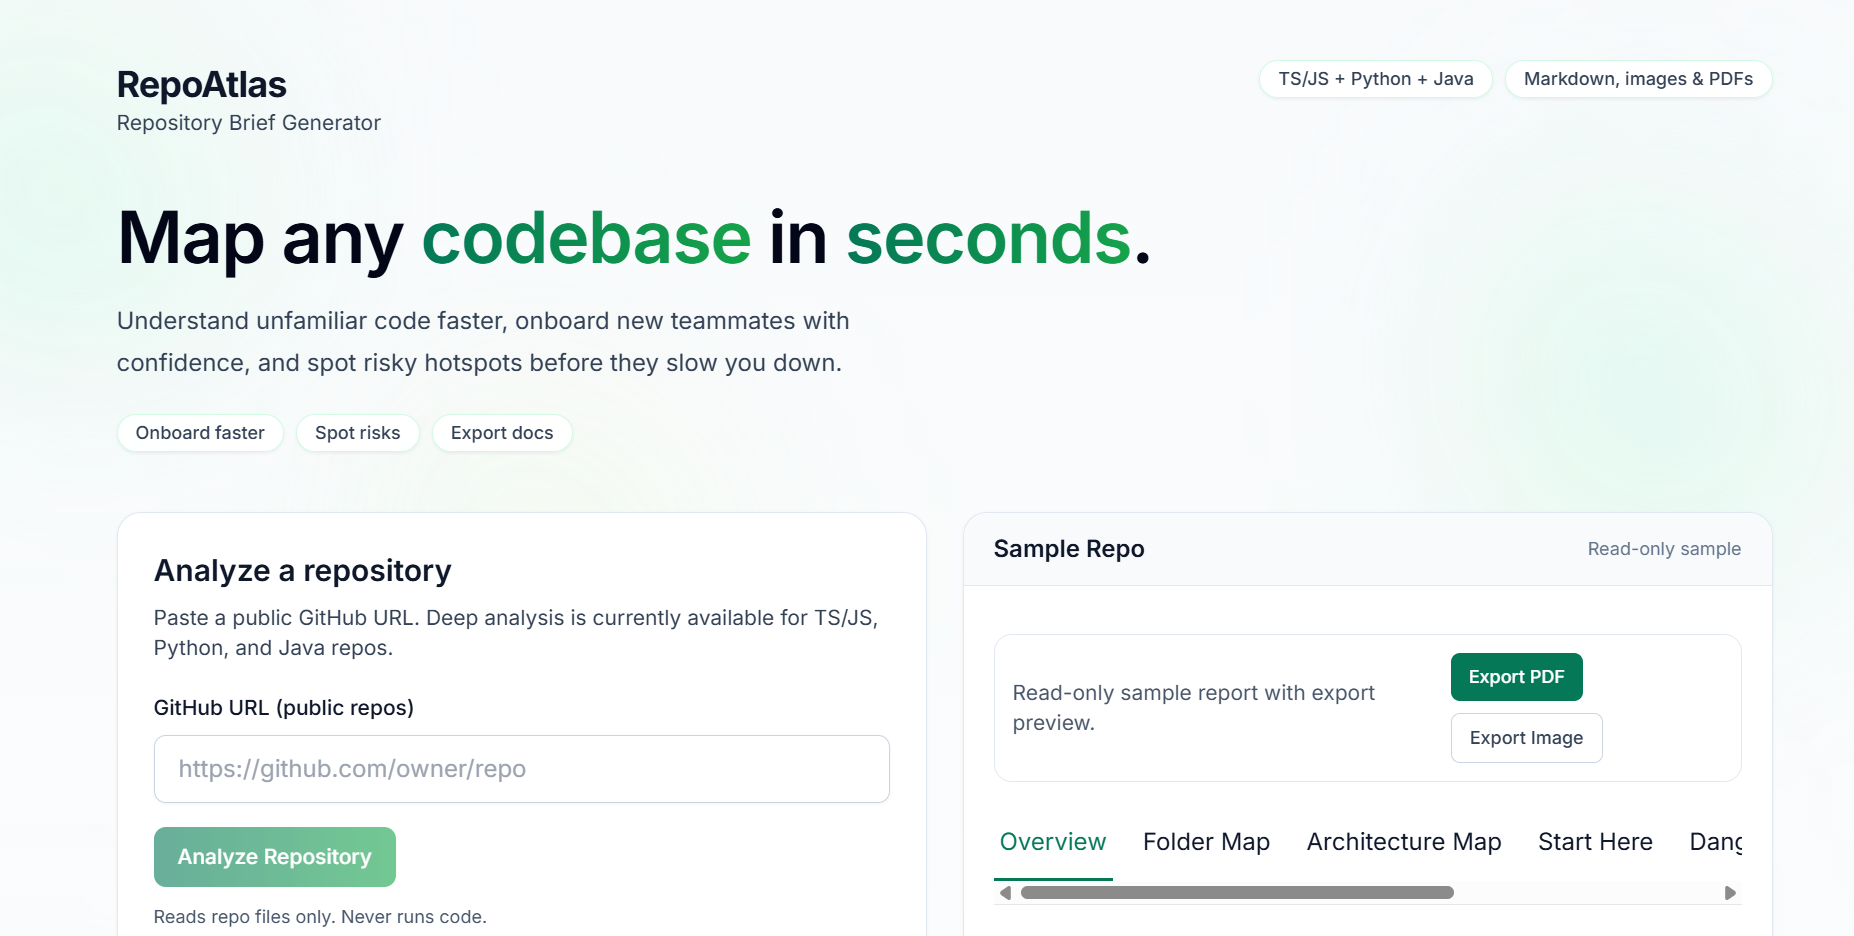
I built RepoAtlas as a local-first app using Next.js, React, TypeScript, and Tailwind. The workflow is simple: I submit a public GitHub URL, RepoAtlas clones the repo into a temporary workspace, runs static analysis (without executing user code), and produces a report with sections like Folder Map, Architecture Map, Start Here, Danger Zones, and Export.
I implemented a shared indexing pipeline plus language-specific packs for TypeScript/JavaScript, Python, and Java. I also added export options for PDF, PNG, and Markdown, so the report can be shared in whatever format a team prefers.
Challenges I faced
The biggest challenge was balancing depth and trust. I did not want RepoAtlas to make claims it could not prove from files. That pushed me to design evidence-based scoring and clear warning states when analysis is partial.
Another challenge was keeping performance predictable across repositories of different sizes. I added practical limits (timeouts, file caps, and reduced graph rendering) so the app remains responsive while still producing useful insights.
I also had to design around graceful degradation: if a deep language pass is not possible, the universal layer still needs to provide meaningful output instead of failing hard.
What I learned
This project taught me how important explainability is in developer tools. If I rank a file as high-risk, I need to show why in measurable terms. I learned to think in terms of deterministic signals, typed error handling, and predictable API boundaries.
I also learned that good developer UX is not only about visuals. It is about reducing cognitive load and making decisions faster. A repository report is valuable only if it helps someone answer, “Where do I start?” in minutes.
A quick math view of the approach
At a high level, I treat ranking as a weighted signal model:
[ \text{score(file)} = \sum_{i=1}^{n} w_i \cdot s_i(\text{file}), \quad 0 \le \text{risk} \le 100 ]
where (s_i) are measurable repository signals (complexity, dependency centrality, churn proxies, etc.) and (w_i) are explicit weights. My goal is not perfect truth, but a consistent, explainable, and practical guide for real engineering workflows.
Built With
- elkjs
- nextjs
- typescript
- vitest

Log in or sign up for Devpost to join the conversation.