-

ReOnPlus – Agentic Profit & Growth Engine
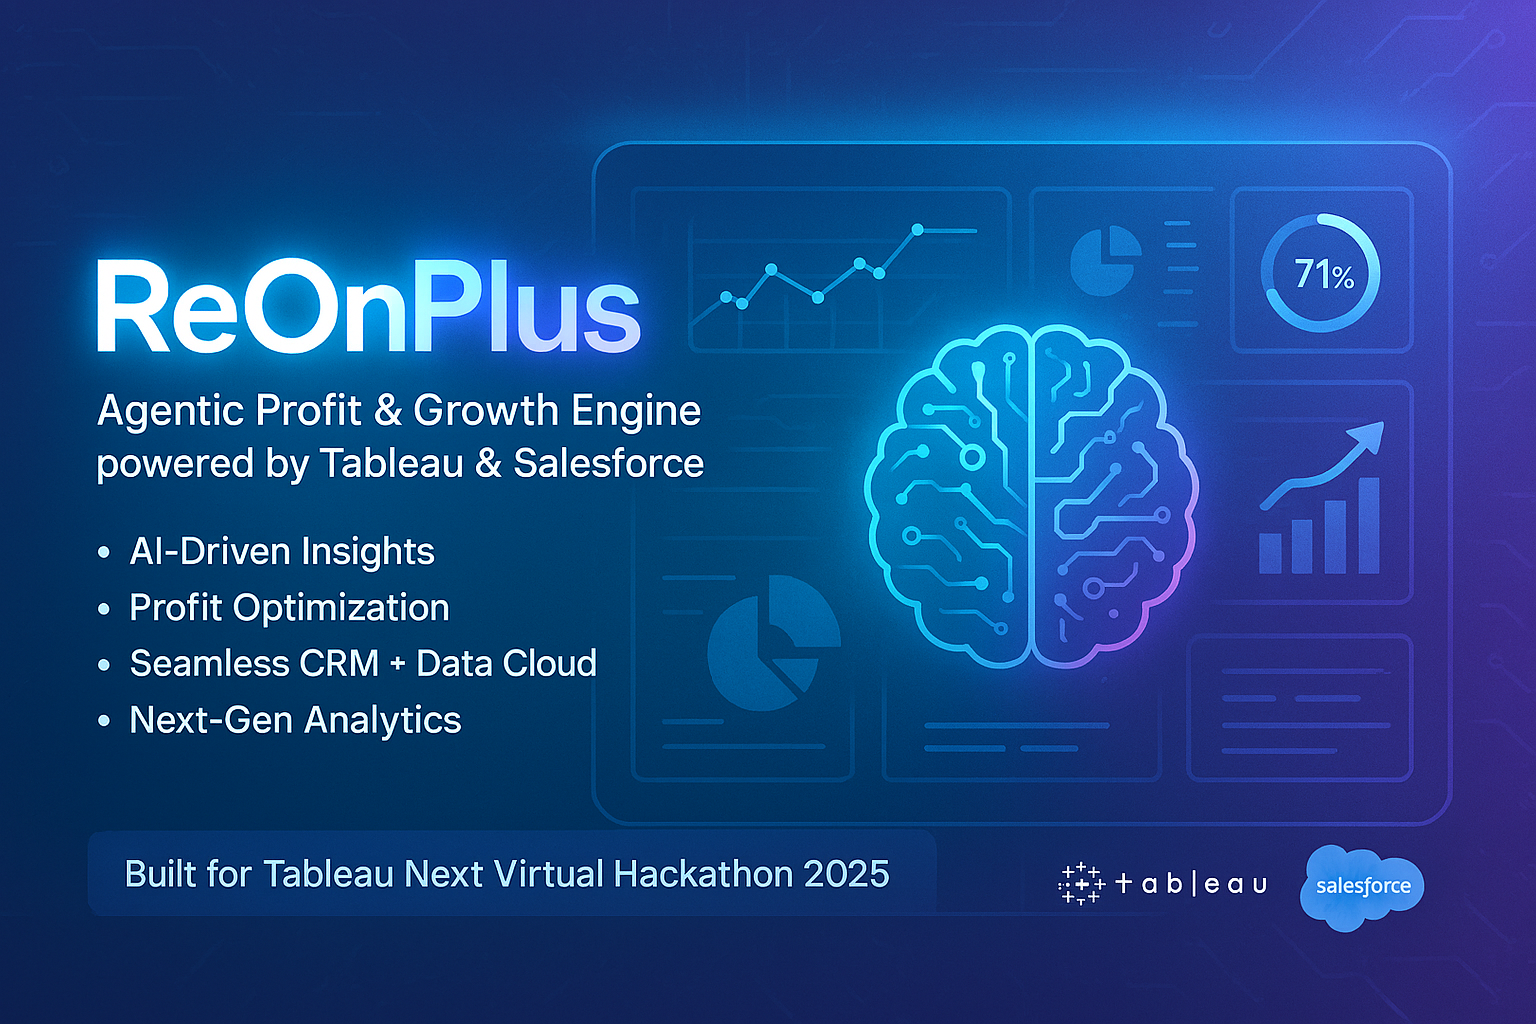
🟢 ReOnPlus – Agentic Profit & Growth Engine
Inspiration
In many organizations, teams are drowning in data but starved for actionable insights. Traditional dashboards often show historical trends but fail to answer the critical question:
“What should we do next to maximize profit?”
We were inspired to create ReOnPlus to bridge this gap — a platform that not only predicts high-value opportunities but also executes actions automatically. The inspiration came from observing sales and marketing teams who:
- Struggle to prioritize accounts efficiently
- Spend excessive time manually translating insights into tasks
- Lack real-time support for decision-making
We envisioned a solution where dashboards think, predict, and act, allowing teams to make profit-driven decisions instantly. This idea led to ReOnPlus: an agentic profit and growth engine.
What it does
ReOnPlus is designed to transform analytics into actionable insights:
- Predict high-impact opportunities: Identify accounts, deals, or campaigns that will generate the most incremental profit using ML-based uplift modeling.
- Simulate scenarios: Managers can adjust parameters like discounts, outreach frequency, or campaign budgets and instantly see predicted revenue impact.
- Trigger automated actions: Decisions from the dashboard can automatically update Salesforce records or trigger Slack notifications, reducing manual effort.
- Explain decisions: SHAP-based explanations help users understand why each recommendation is made, ensuring trust in AI-driven decisions.
Outcome: Faster, smarter, measurable decisions that directly impact revenue and growth.
How we built it
1. Data Sources
- Salesforce CRM: Accounts, Opportunities, Contacts, and Activity data
- Salesforce Data Cloud: Unified customer and transaction datasets
- Marketing and engagement logs: Historical campaign data (synthetic for demo purposes)
2. Machine Learning Layer
We implemented uplift modeling to predict incremental revenue per action.
The general formula for uplift (U) for a given customer (i) is:
[ U_i = P(\text{Conversion} \mid \text{Treatment}_i) - P(\text{Conversion} \mid \text{Control}_i) ]
Where:
- (P(\text{Conversion} \mid \text{Treatment}_i)) is the probability that customer (i) converts if targeted
- (P(\text{Conversion} \mid \text{Control}_i)) is the baseline probability without intervention
We used:
- LightGBM for uplift modeling
- SHAP values for feature explainability, giving insight into which factors drive predictions
- Scenario simulation by adjusting variables and recomputing expected profit:
[ \text{ExpectedProfit} = \sum_{i=1}^{n} U_i \times \text{Revenue}_i ]
3. Dashboard & Visualization
- Built in Tableau Next, supporting interactive KPIs, prioritized accounts, and account drill-downs
- What-if sliders allow managers to tweak discounts, outreach frequency, or campaign intensity
- Displays both predicted uplift and actionable recommendations clearly
4. Agentic Automation
- Salesforce Flow integration: Automatically updates CRM or launches tasks
- Slack Integration: Real-time notifications for team members
- Secure execution: Role-based permissions ensure only authorized users trigger actions
Challenges we ran into
- Synthetic Data Preparation: Limited access to real Salesforce data required creating realistic synthetic datasets
- Automation Integration: Linking Tableau buttons to Salesforce Flow + Slack Webhooks required careful API design and testing
- Explainable AI: Making ML predictions understandable to non-technical users required multiple iterations of design
- Time Management: Balancing ML model development, dashboard design, and automation within hackathon timelines was challenging
Accomplishments that we're proud of
- Successfully implemented predictive + agentic dashboards that simulate revenue outcomes
- Built a what-if simulation engine for real-time scenario analysis
- Enabled one-click automation to act on insights in Salesforce and Slack
- Created clear, interactive, explainable dashboards that demonstrate measurable business impact
- Demonstrated full hackathon-ready prototype with actionable insights
What we learned
- Agentic analytics requires a seamless combination of ML, visualization, and automation
- Explainable AI is essential for user trust and adoption
- Synthetic datasets can be used effectively for demo and testing purposes
- Clear UX design is as critical as predictive accuracy for judges and end-users
- Building for action, not just visualization, distinguishes exceptional projects
What's next for ReOnPlus – Agentic Profit & Growth Engine
- Expand to multi-channel automation (email, SMS, ad campaigns) directly from dashboards
- Add AI-driven recommendations to suggest optimal strategies for marketing and sales teams
- Integrate sustainability / ESG metrics alongside profit for responsible growth
- Implement real-time streaming predictions and continuous retraining for dynamic environments
- Explore collaborative decision-making features for cross-team alignment
✅ Summary:
ReOnPlus is a next-generation agentic analytics platform. By combining ML-driven predictions, interactive dashboards, and automation, it transforms Tableau Next from a static visualization tool into a proactive, profit-generating engine, delivering measurable business impact while being user-friendly, transparent, and scalable.
Built With
- analytics
- aws-(optional-for-hosting-or-ml-pipelines)
- css
- docker
- firebase
- flask
- for
- git/github
- html
- javascript
- lightgbm
- notifications
- optional
- or
- python
- rest-apis
- salesforce
- salesforce-data-cloud
- salesforce-flow
- scikit-learn
- shap
- slack-webhooks
- tableau-next


Log in or sign up for Devpost to join the conversation.