-
-
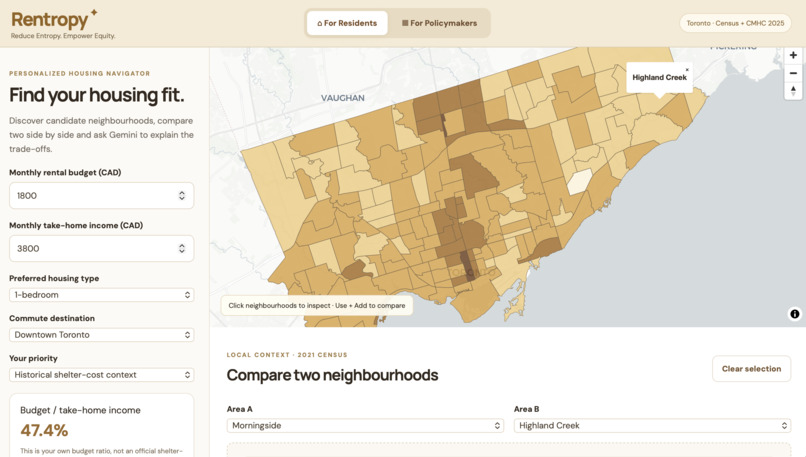
Personal Housing Navigator for Residents
-
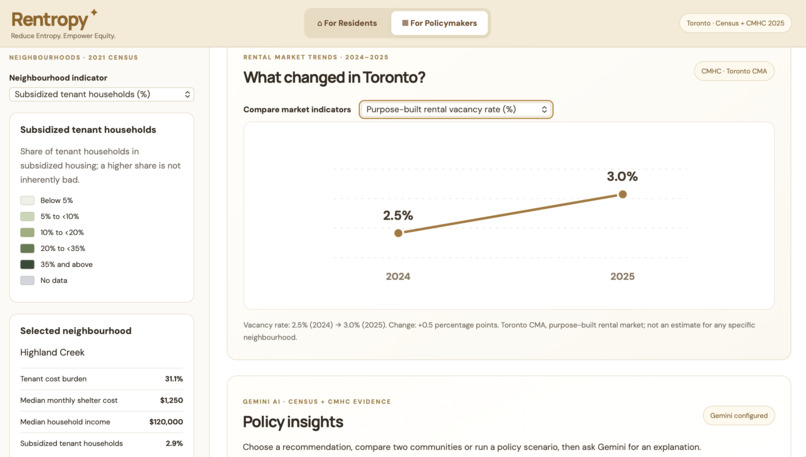
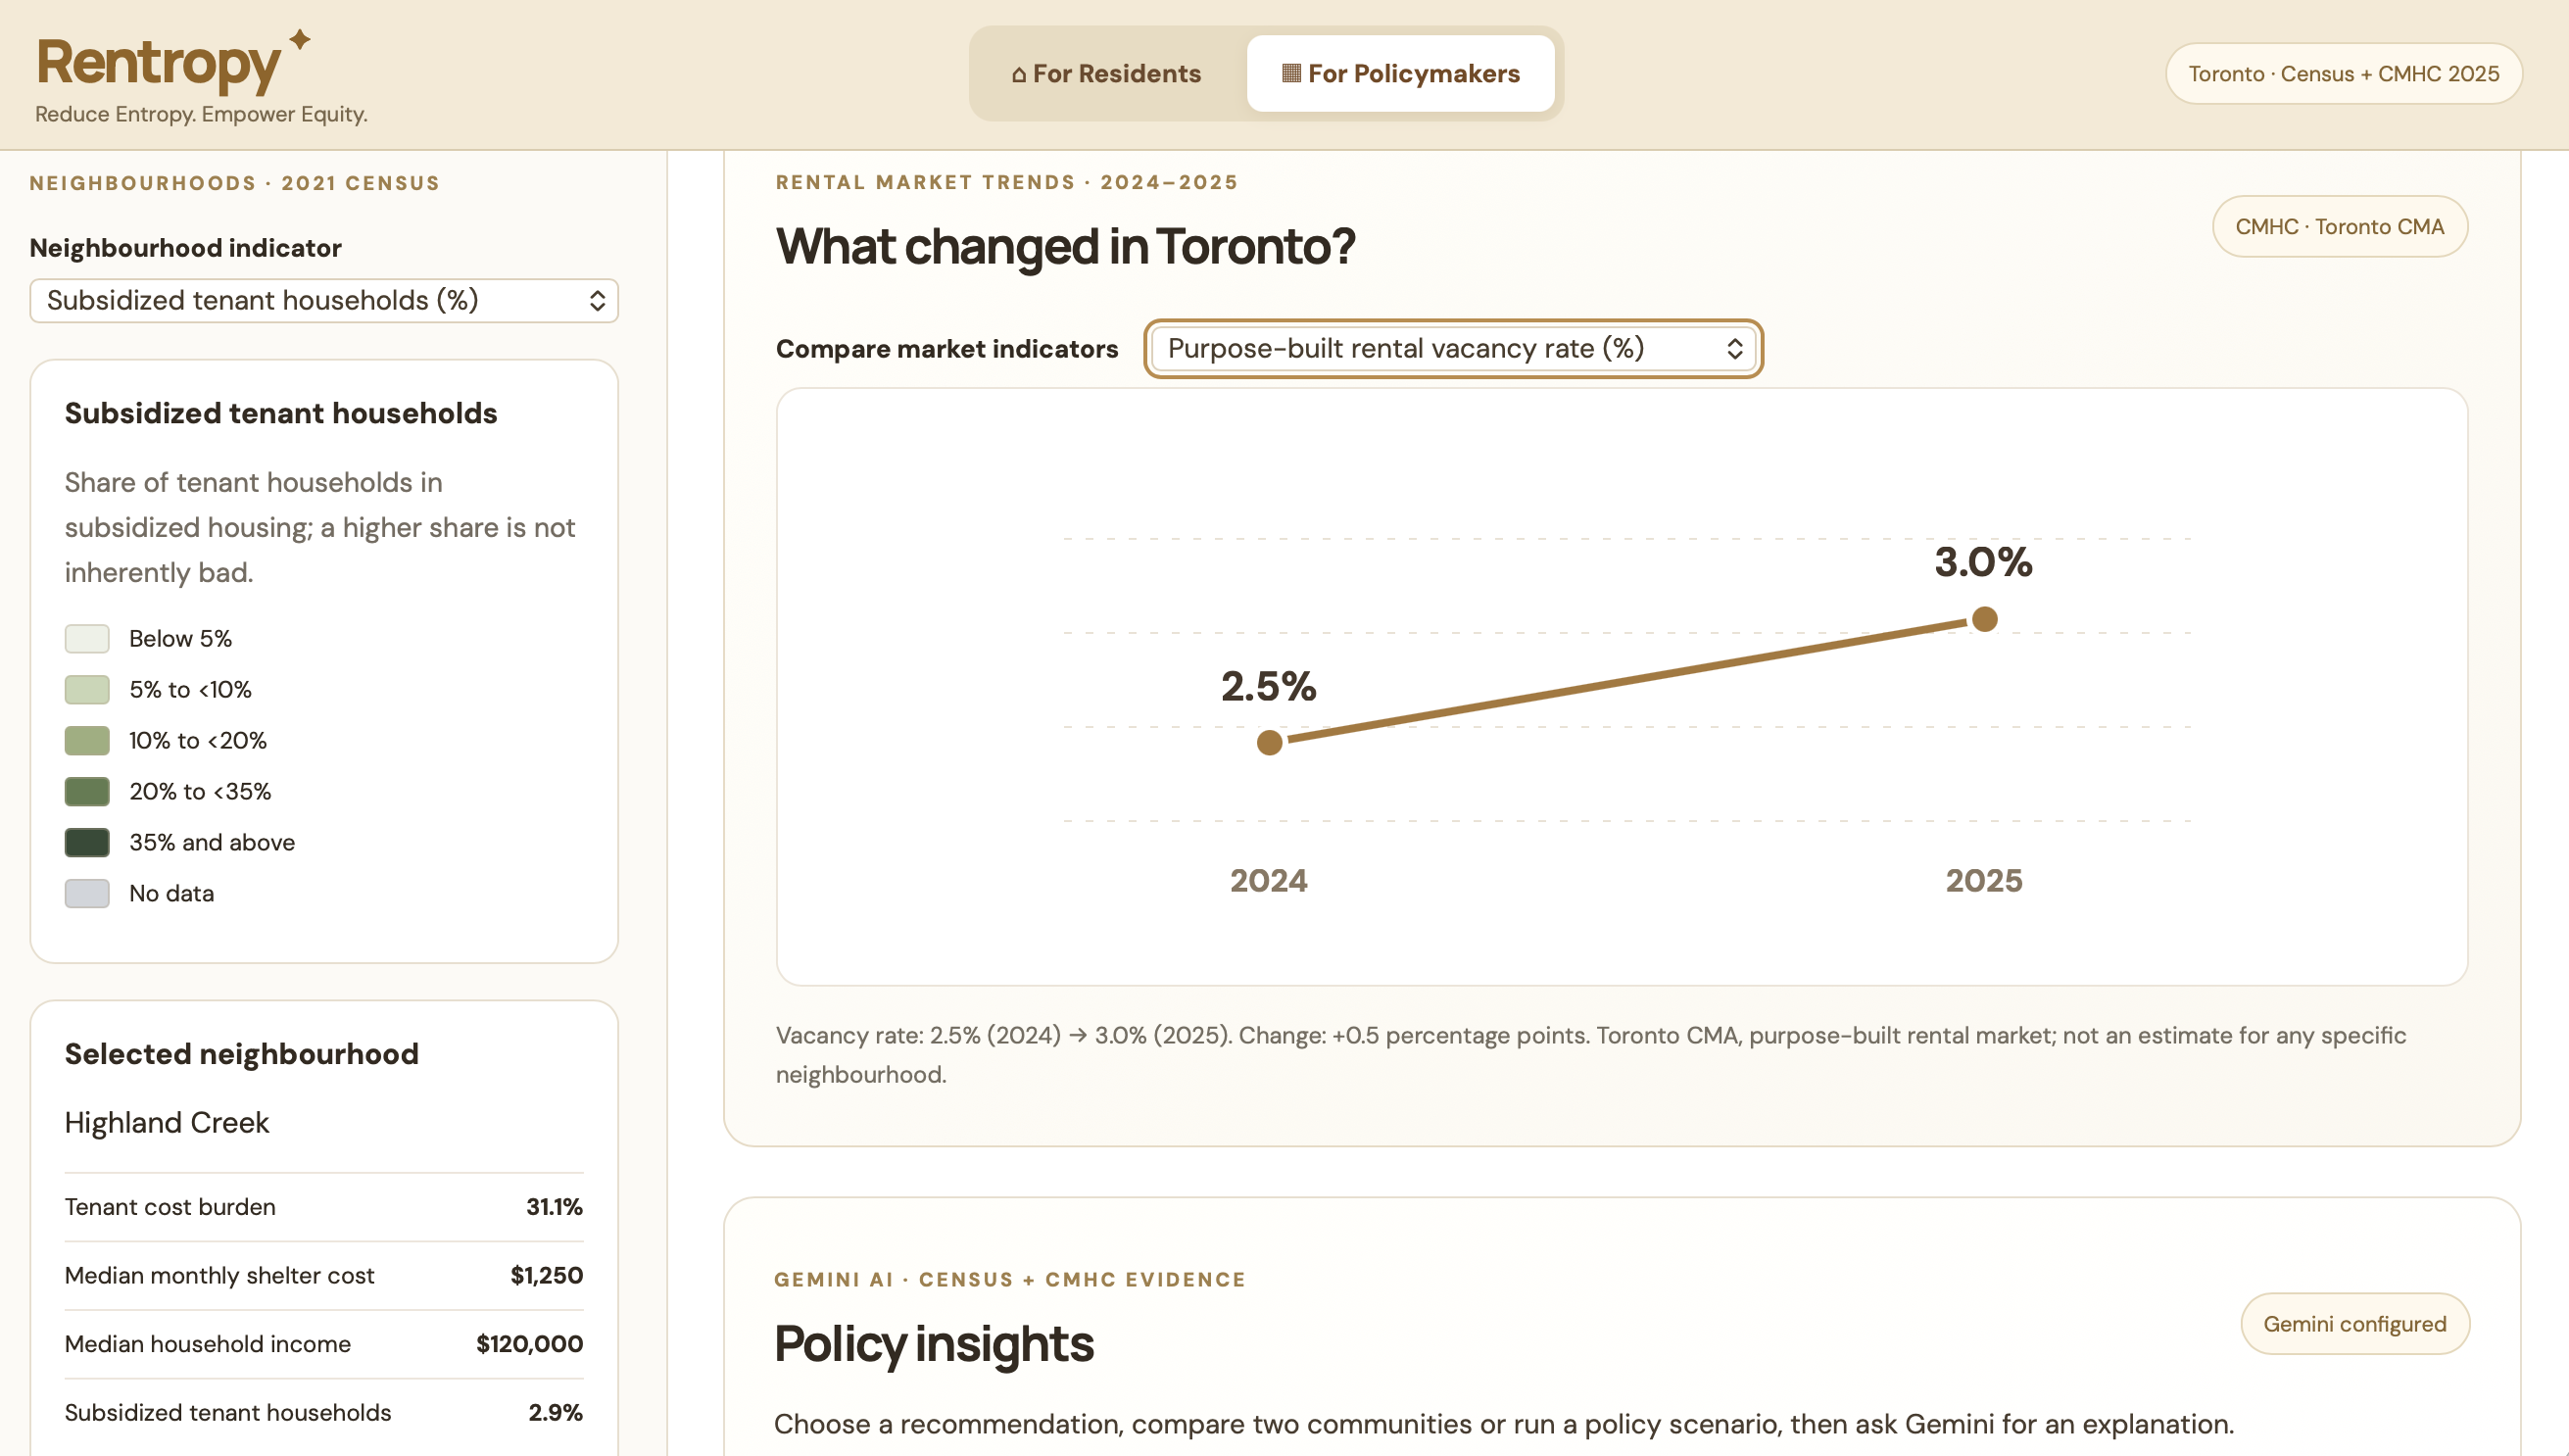
Rental Market Trends
-
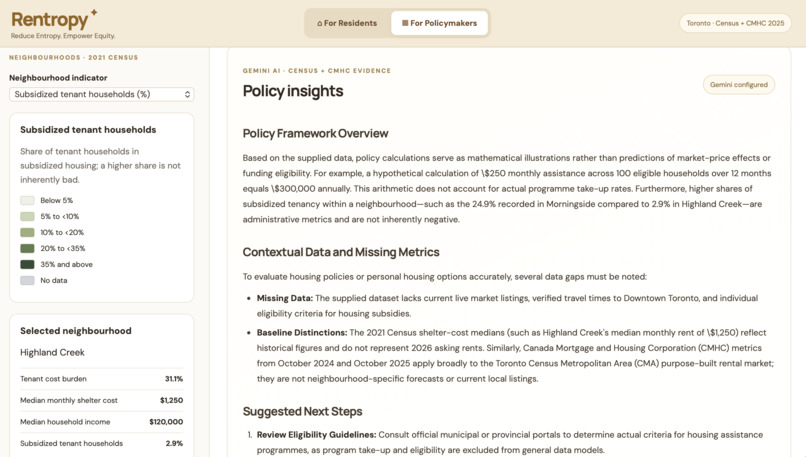
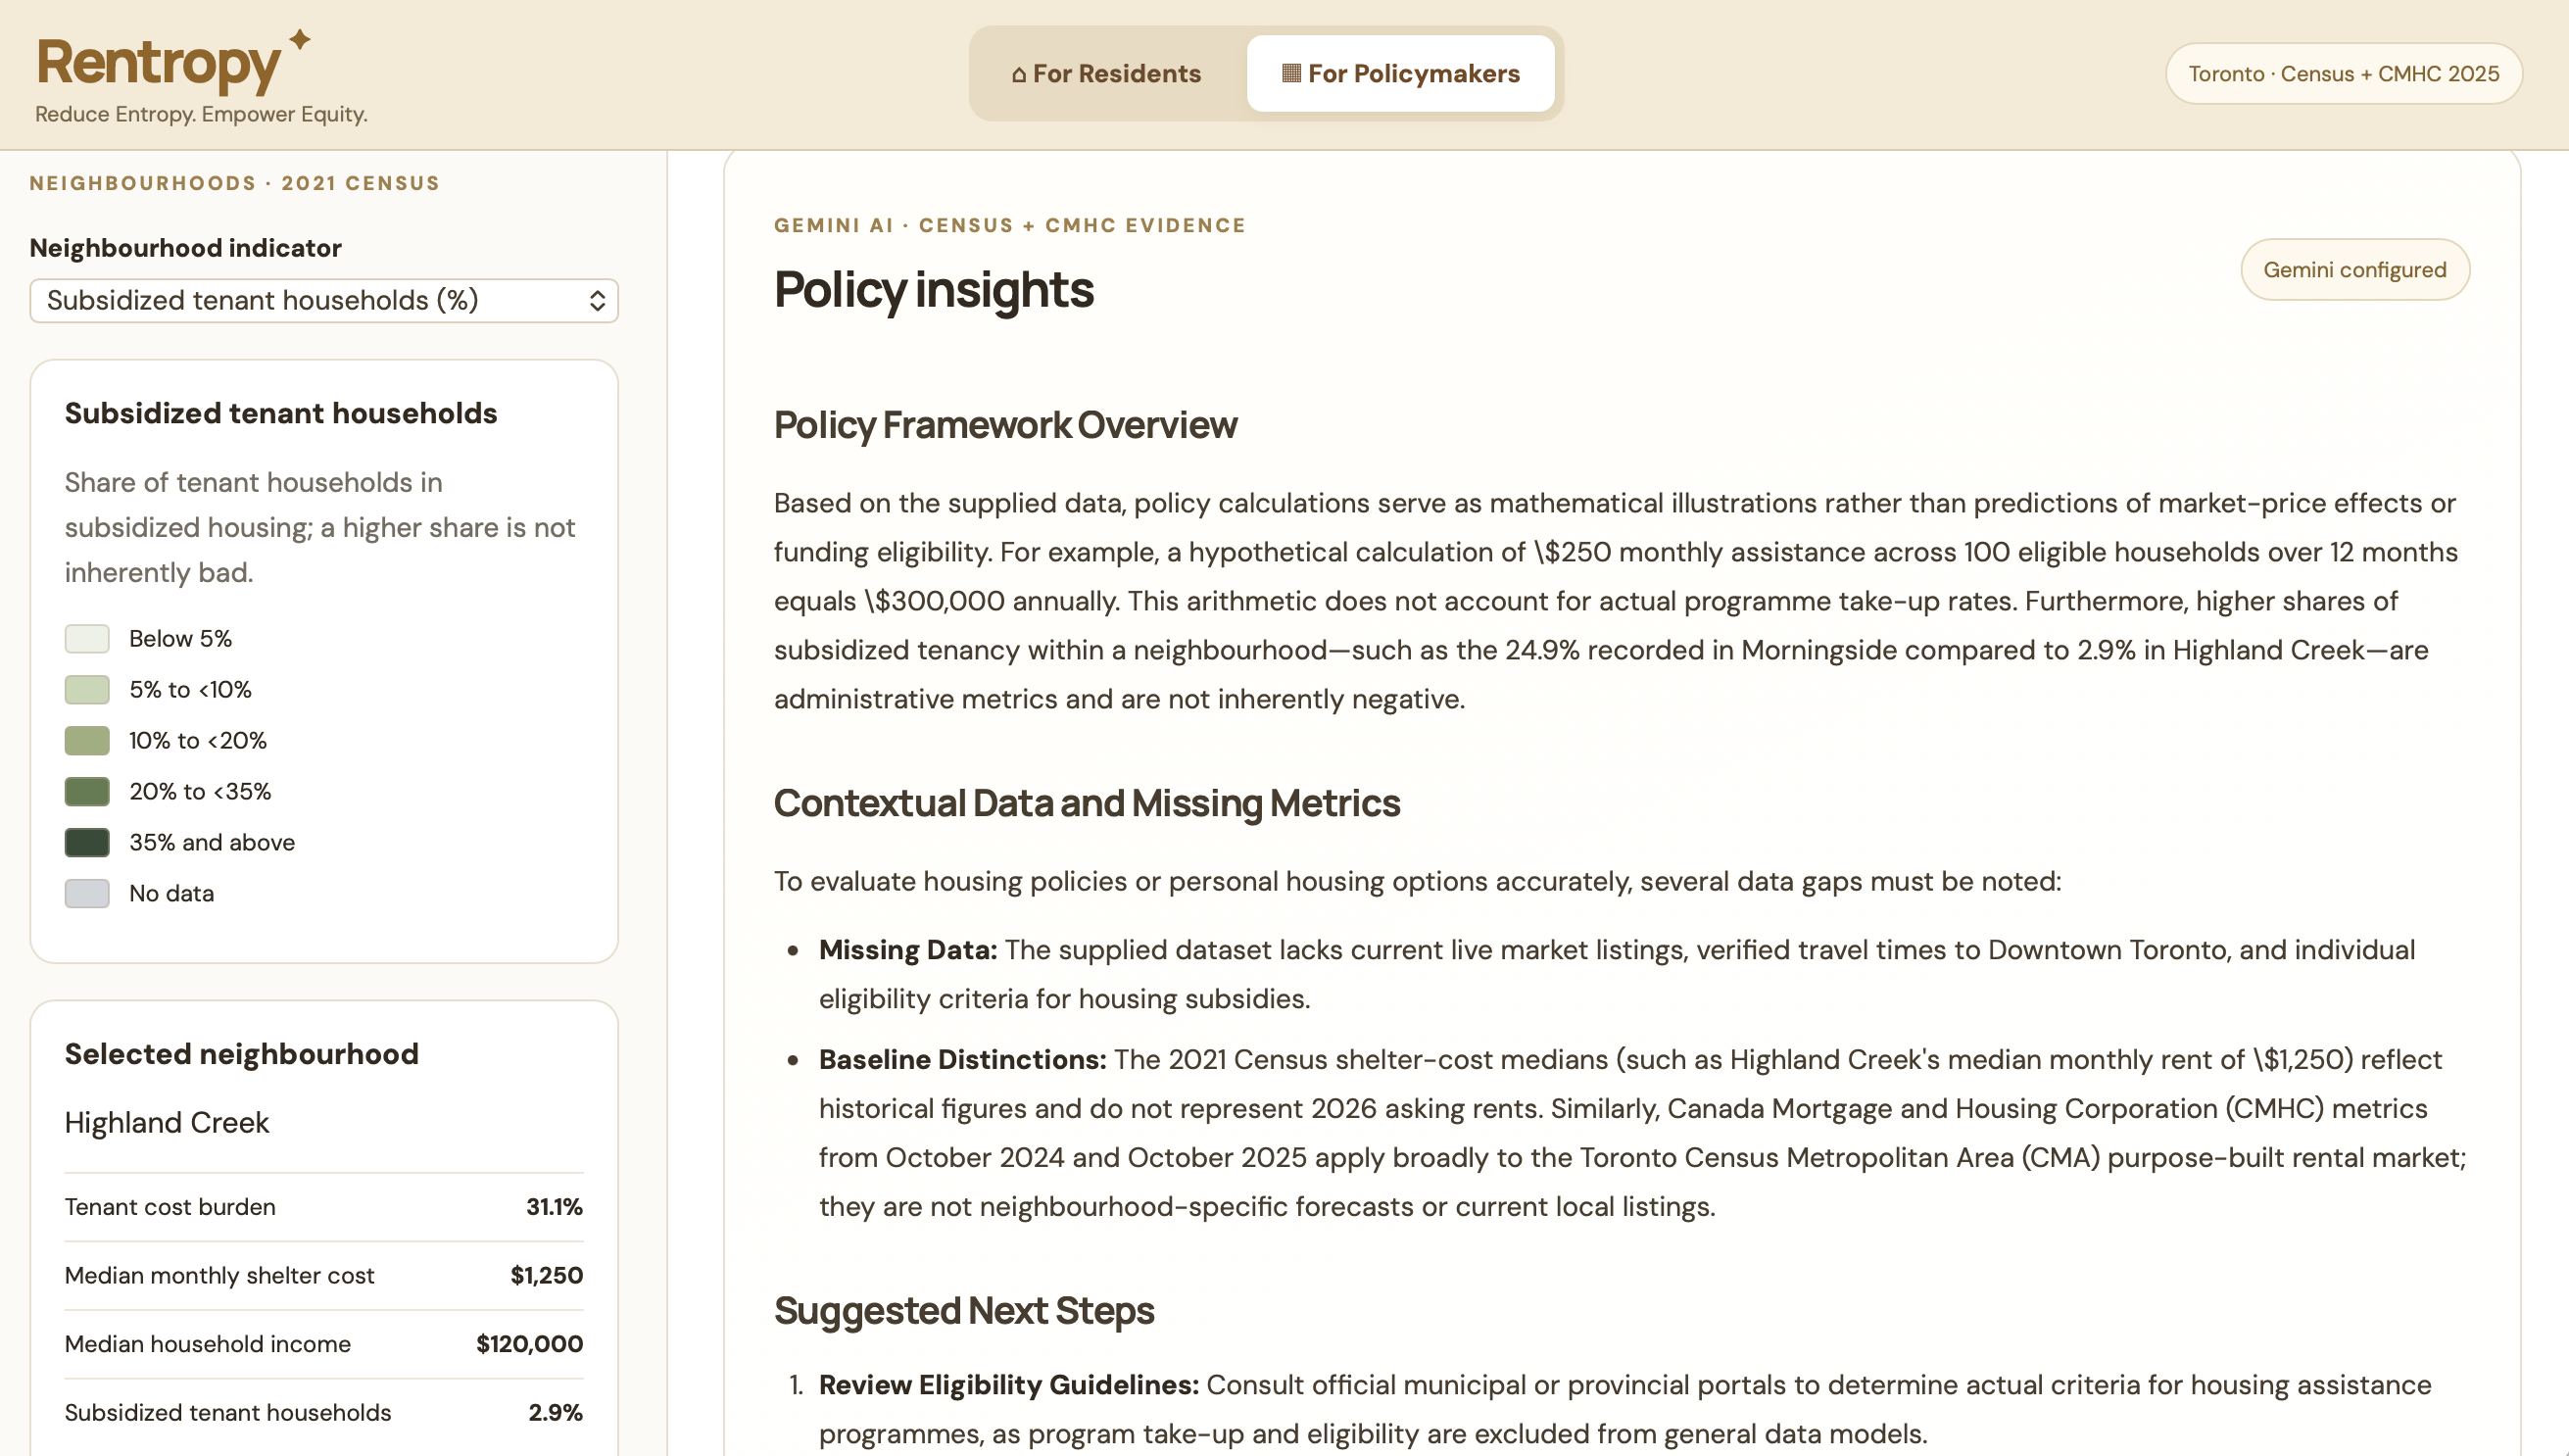
Sample Policy Insights Generated by Gemini
Inspiration
My inspiration came from Professor Fern Ramoutar's research project, Land Use Regulation and Housing Affordability, at the University of Toronto. Her research explores how land-use regulations and housing policies affect housing supply, affordability, and urban inequality.
Also, I need to rent an apartment near campus next year. This made the issue feel much more personal. I realized how difficult it can be to find affordable housing while balancing rent, location, and living expenses.
These two perspectives inspired me to ask: What if housing data could empower not only researchers and policymakers, but also everyday residents like me who are struggling to navigate housing affordability?
Toronto's housing crisis is not just about rising rents. It also reflects income inequality, geographic disparities, and complex policy decisions. I created Rentropy to bridge the gap between housing research, public policy, and the people who need this information to make real-life decisions.
What it does
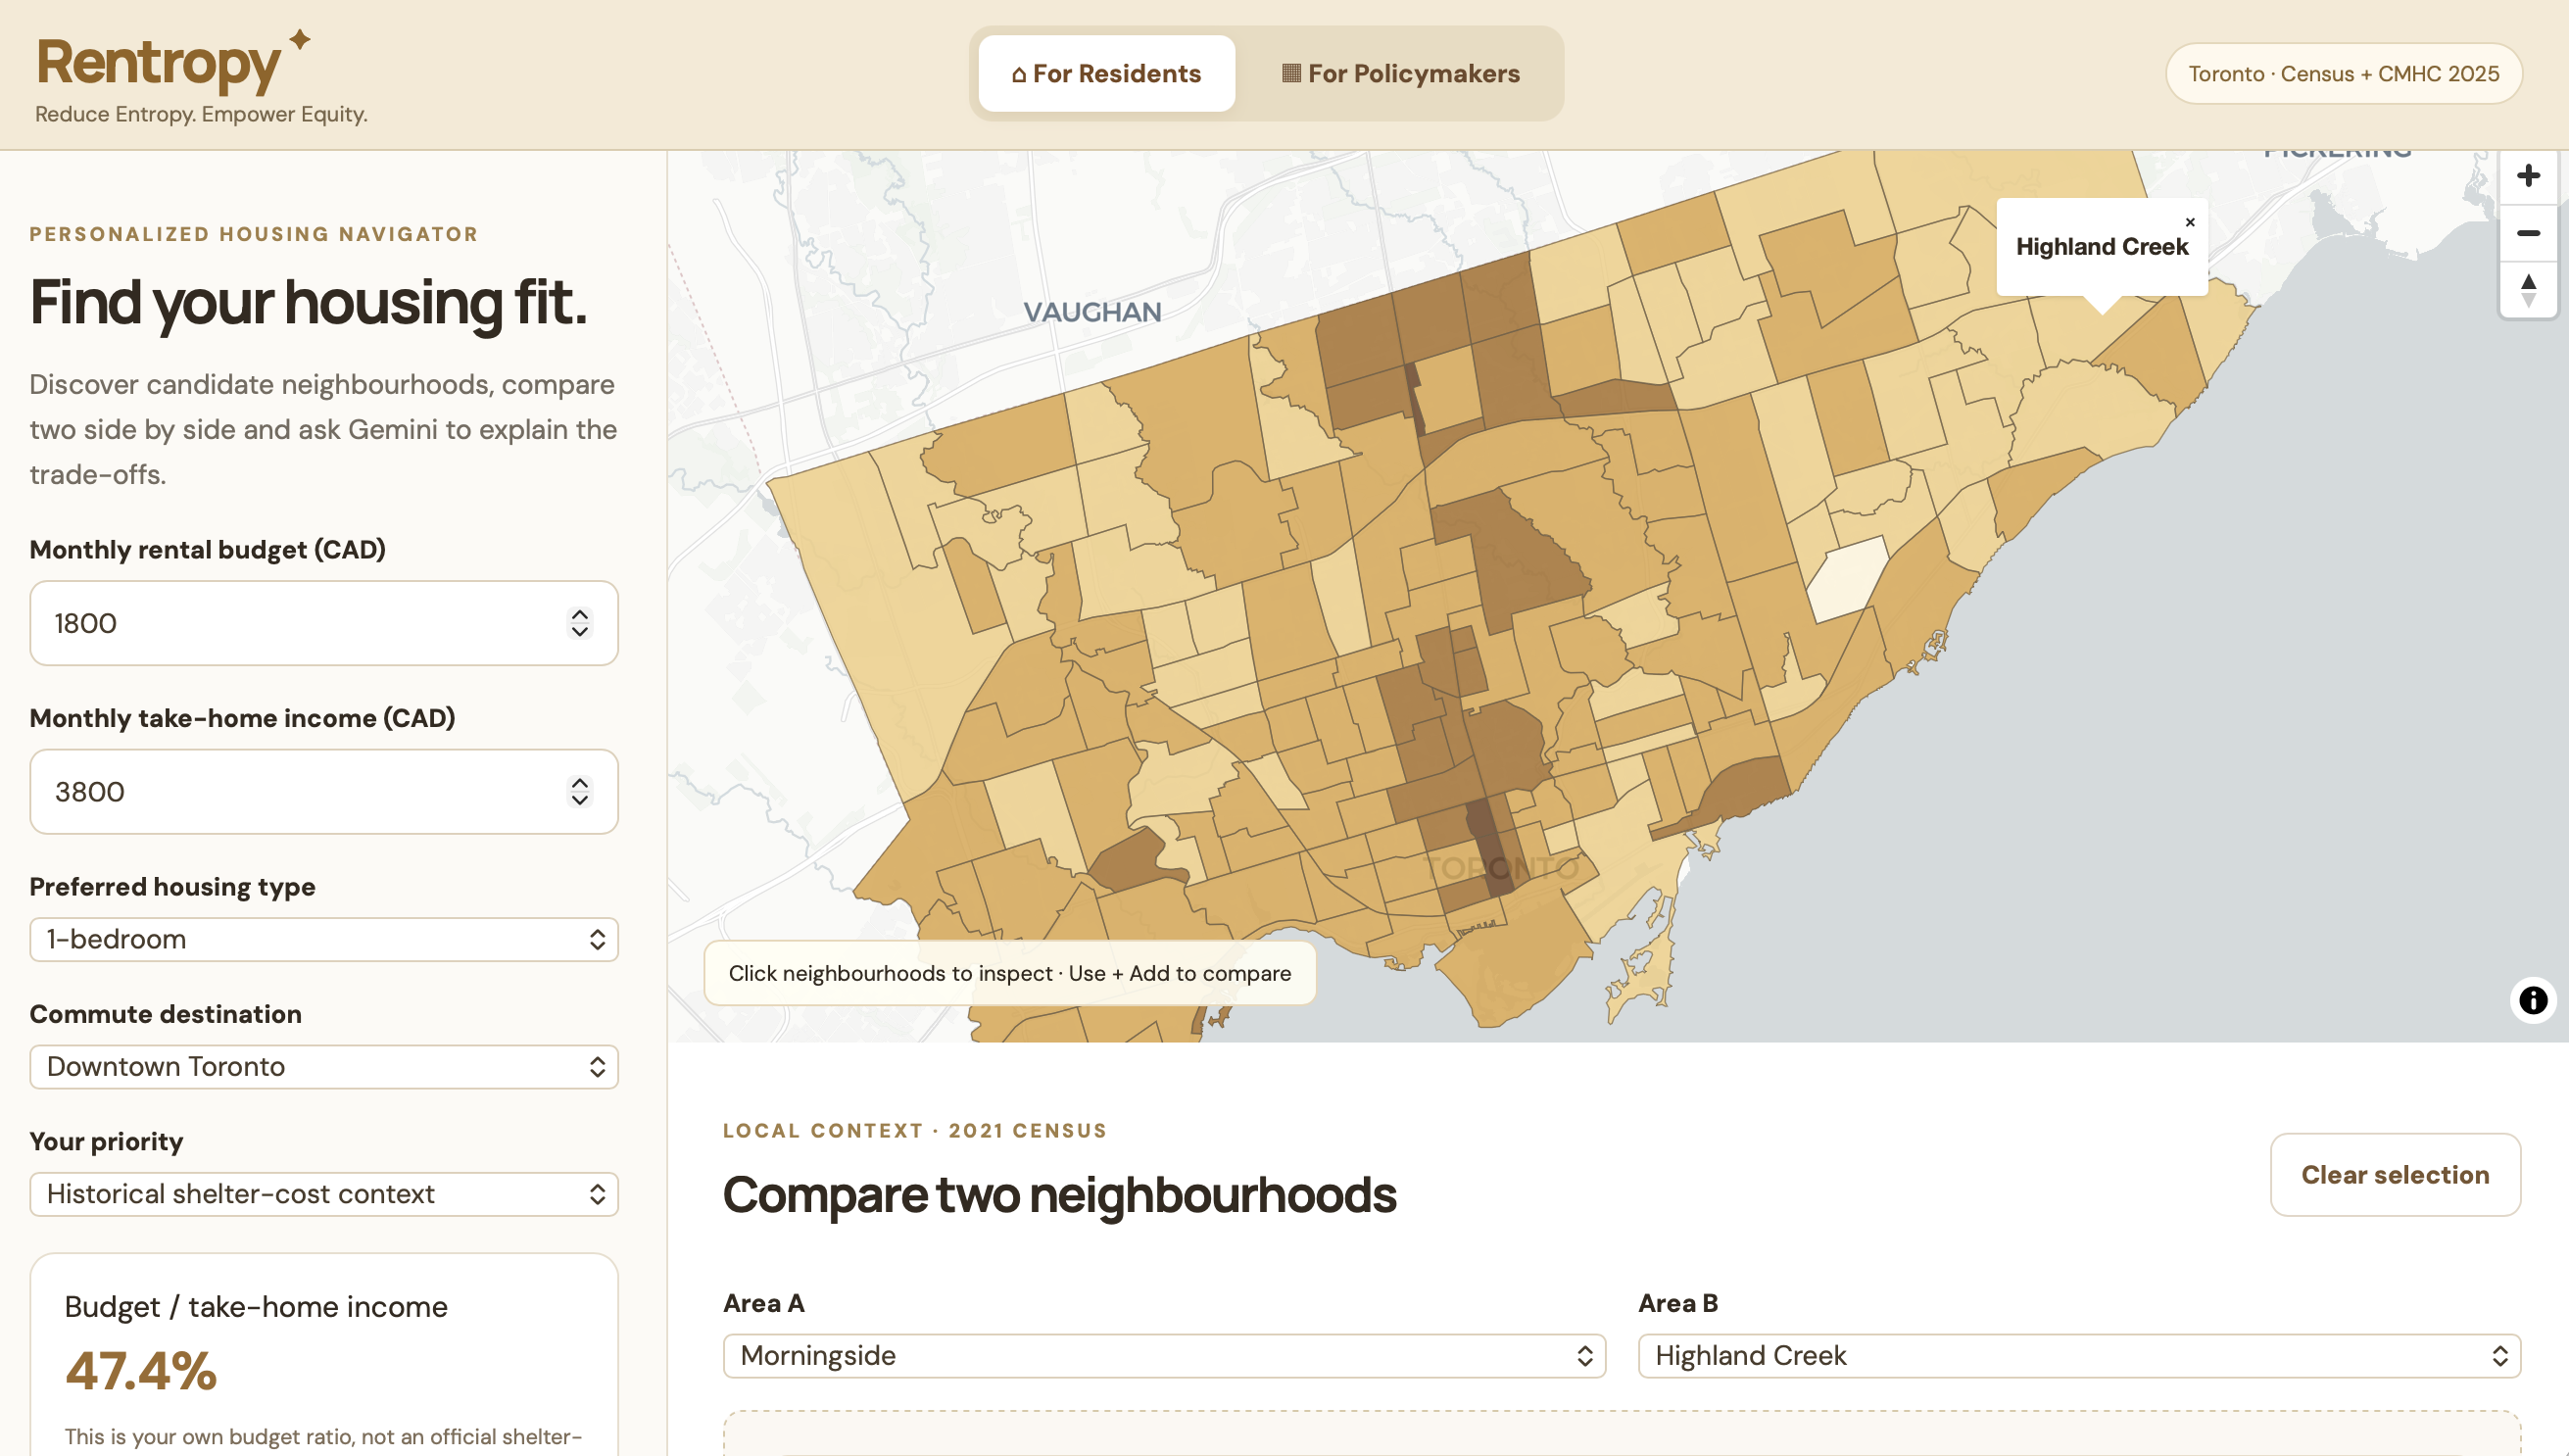
Rentropy is a Gemini-powered housing intelligence platform designed for two audiences: residents and policymakers.
For residents:
- Explore housing affordability across Toronto.
- Compare rental costs with income and housing budgets.
- Understand affordability predictions through personalized, AI-generated explanations.
- Identify areas that may better match their financial circumstances.
For policymakers:
- Visualize geographic disparities in housing affordability.
- Identify communities facing greater housing affordability challenges.
- Explore potential housing policy interventions.
- Receive AI-generated equity insights and policy recommendations.
Google Gemini acts as Rentropy's intelligent interpretation layer. Rather than simply generating generic chatbot responses, Gemini explains data-driven predictions, interprets affordability disparities, and helps policymakers reason through potential policy scenarios.
My mission is simple: Make housing data understandable, accessible, and actionable.
How I built it
I developed Rentropy with the help of OpenAI, combining full-stack web development, data analytics, machine learning, and generative AI.
Tech Stack:
- Python: Housing data processing and affordability analysis.
- Flask: Backend API and application logic.
- HTML, CSS, JavaScript: Interactive frontend development.
- Google Gemini API: Personalized affordability explanations, housing equity analysis, and policy recommendations.
- TigerData / PostgreSQL: Structured housing data storage and retrieval.
- Machine Learning: Rental affordability predictions and pattern analysis.
- Geospatial Visualization: Interactive exploration of housing affordability across Toronto.
I designed the architecture to separate quantitative analysis from generative AI interpretation. Gemini receives structured housing information and analytical results, allowing it to produce contextual explanations rather than relying solely on general knowledge.
Challenges I ran into
Sleep deprivation and time pressure. 😇 As a solo hacker, I had to balance coding, debugging, learning new technologies, and preparing the final demo.
Unexpected technical issues were definitely frustrating! 😭 At first, Gemini kept throwing
ServerErrorand503 UNAVAILABLEerrors, and I spent hours debugging my code, thinking I had done something wrong. Eventually, I discovered that the free tier only allowed 20 requests per day for the model I was using! After all that debugging, it turned out I'd also hit the API limit. Definitely a lesson learned the hard way...Learning unfamiliar technologies was another challenge. I had little experience with Flask, TigerData, and the Gemini API before this hackathon, so I had to learn how to use them while building Rentropy. It was stressful trying to figure everything out in such a short amount of time, but I learned a lot through trial and error!
Accomplishments that I'm proud of
I'm proud of transforming an academic research question into a civic technology prototype with practical applications in my 1st Hackathon.
My biggest accomplishment is connecting individual housing affordability with broader housing equity challenges.
Instead of building a conventional housing dashboard, I designed Rentropy to combine predictive analytics with Gemini-powered explanations and policy insights.
Developing this project independently also challenged me to take ownership of the entire development process, from identifying the problem and designing the user experience to implementing the technical architecture.
What I learned
I learned that AI for social impact is not just about building intelligent models; it is about making their outputs understandable, responsible, and useful.
Through this project, I strengthened my skills in integrating generative AI with data analytics, backend development, and interactive web interfaces.
More importantly, I learned how to combine my computer science skills with ideas from economics and urban planning to build something that can tackle real-world problems.
What's Next for Rentropy
I plan to expand Rentropy with more Toronto housing datasets and improve the accuracy of affordability analysis and future predictions.
I also want to add commute accessibility and transportation data, so residents can compare travel times, transit routes, and commuting costs to schools or workplaces.
Another goal is to include neighbourhood-level crime statistics from Toronto Police Service open data, with clear explanations of data limitations and population differences to avoid misleading comparisons or unfairly labelling communities.
For policymakers, I hope to build more advanced interactive policy simulations to explore how housing supply, rental assistance, and land-use regulations might affect affordability.
I'll also focus on explainable AI, data transparency, and equity analysis, making it easier for users to understand the evidence and limitations behind the results.
My long-term goal is to make Rentropy a bridge between housing research, public policy, and the people most affected by housing inequality.
Rentropy — Turning housing data into decisions, and insights into equity.
Built With
- flask
- gemini
- html5
- javascript
- python
- tigerdata


Log in or sign up for Devpost to join the conversation.