Inspiration
Finding the right home or investment property is often a frustrating process driven by guesswork, biased broker advice, and fragmented information. While raw data exists, it is rarely accessible or visually understandable for the average person. We wanted to democratize real estate analytics. Our inspiration was to build a tool that answers the most critical questions—Where are the affordable areas? Which localities have the highest job growth?—and presents them through a beautiful, intuitive, and instantly readable visual dashboard.
What it does
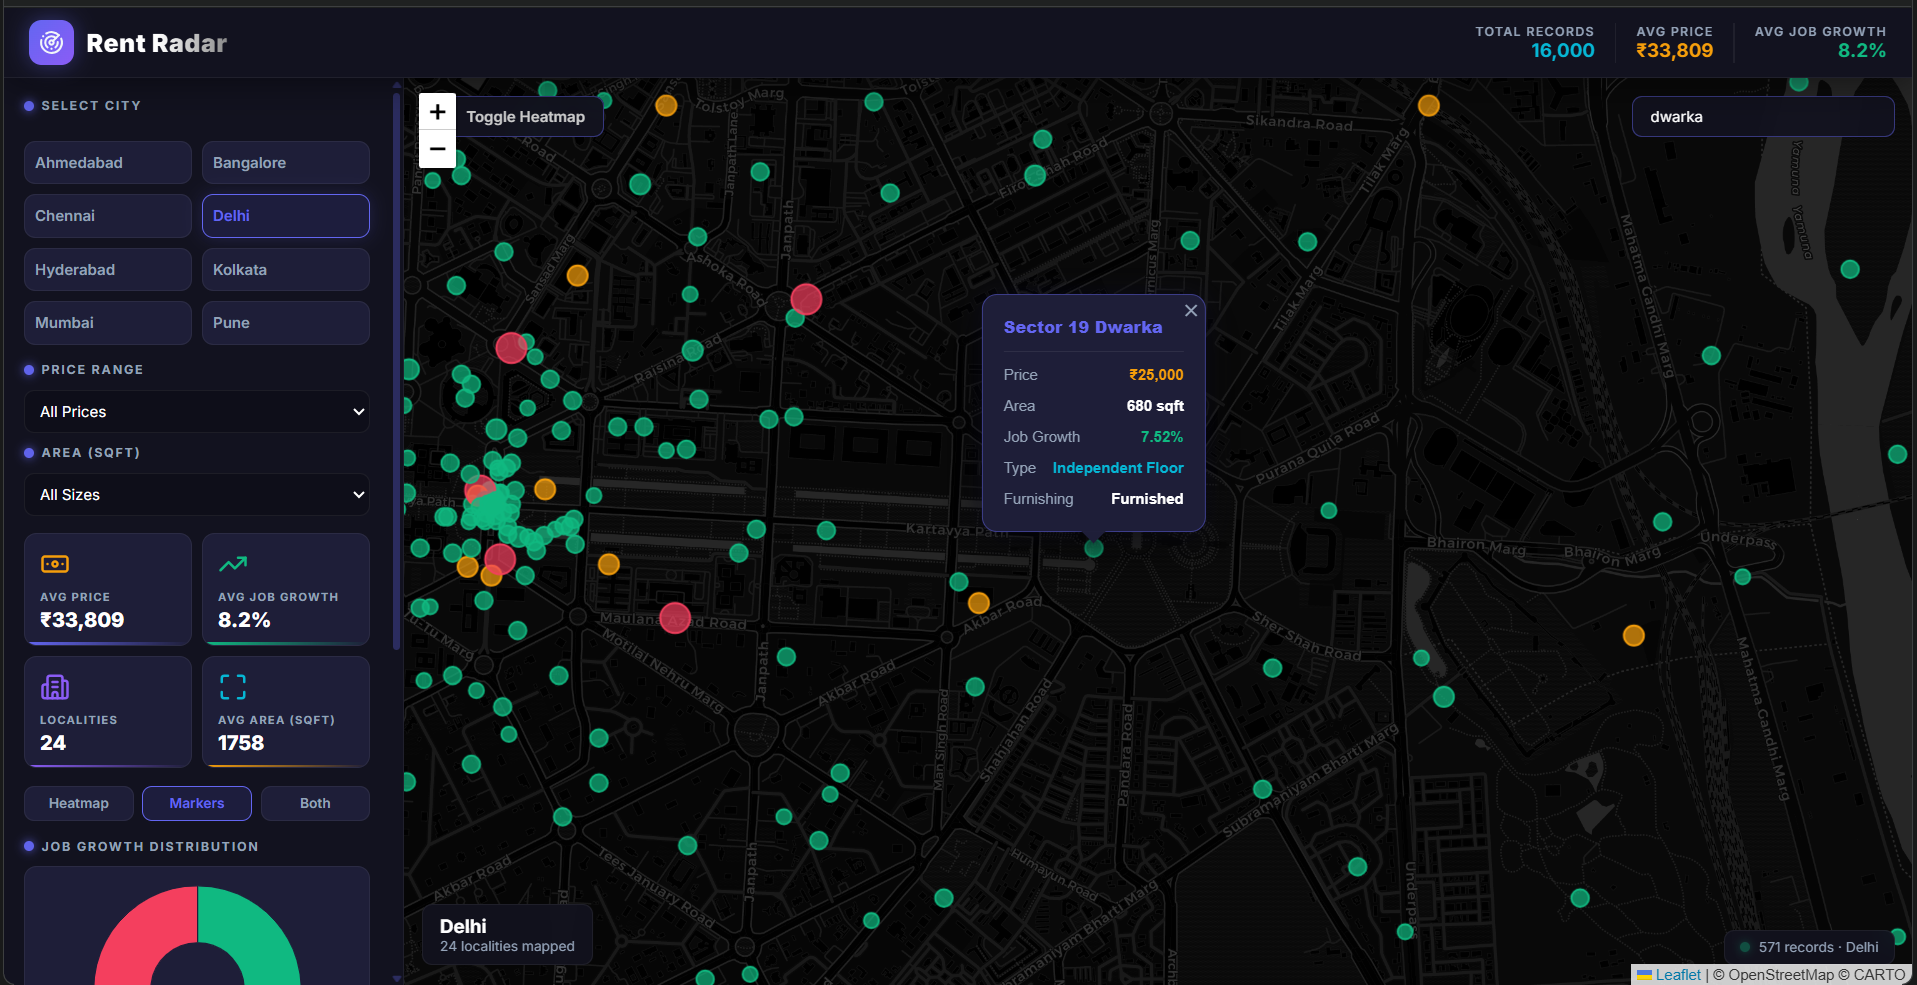
Rent Radar is a serverless, interactive property intelligence dashboard. It visualizes massive datasets of real estate listings across major Indian cities.
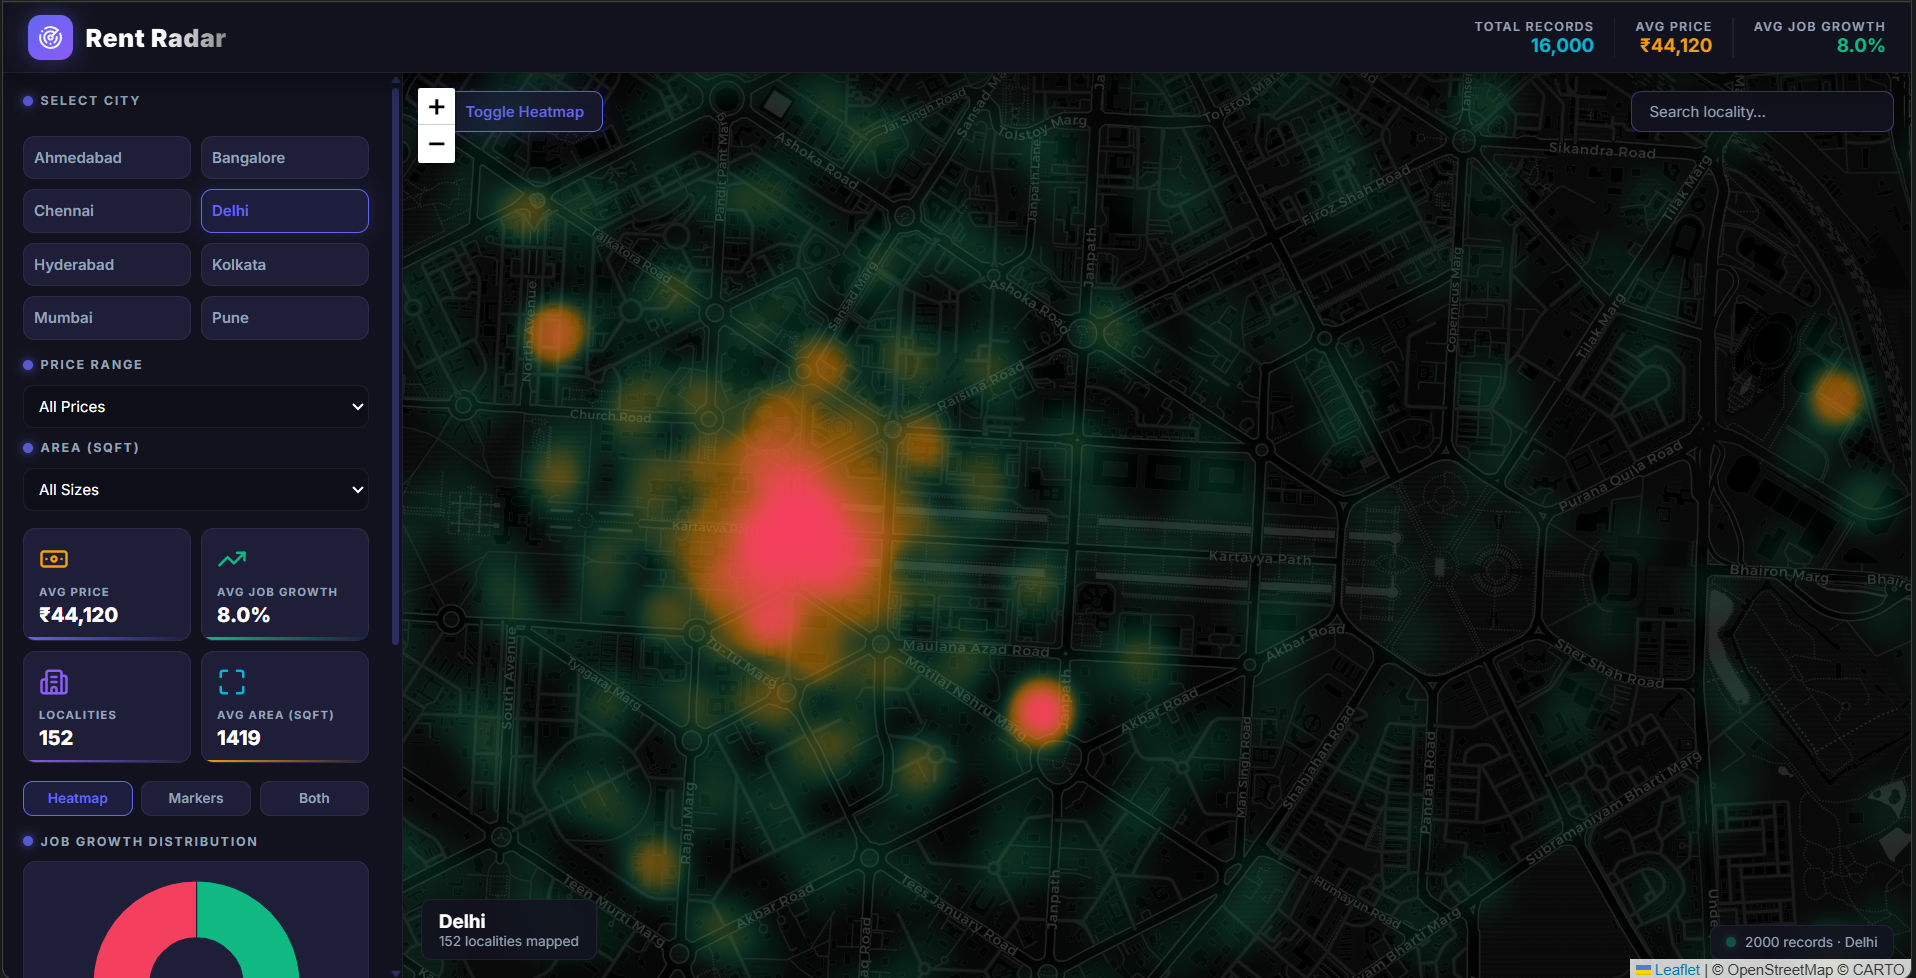
Surface Heatmaps: Visually highlights price intensity across different neighborhoods.
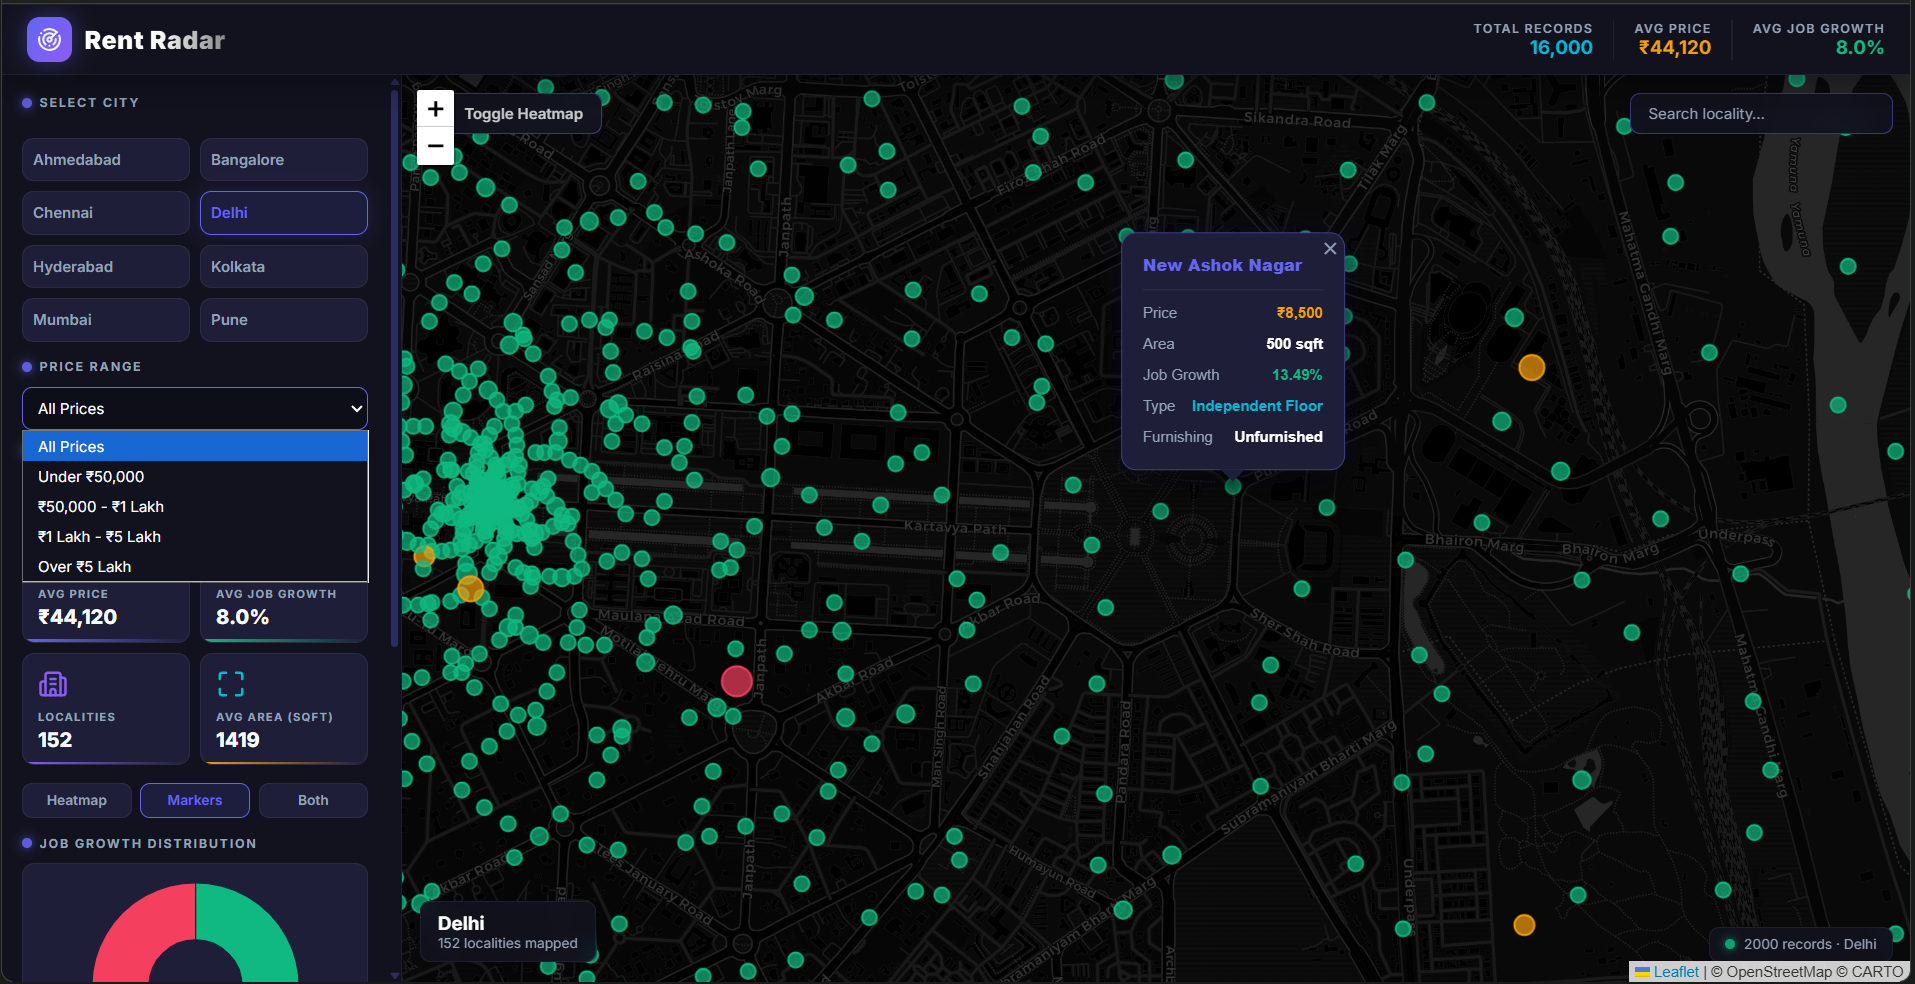
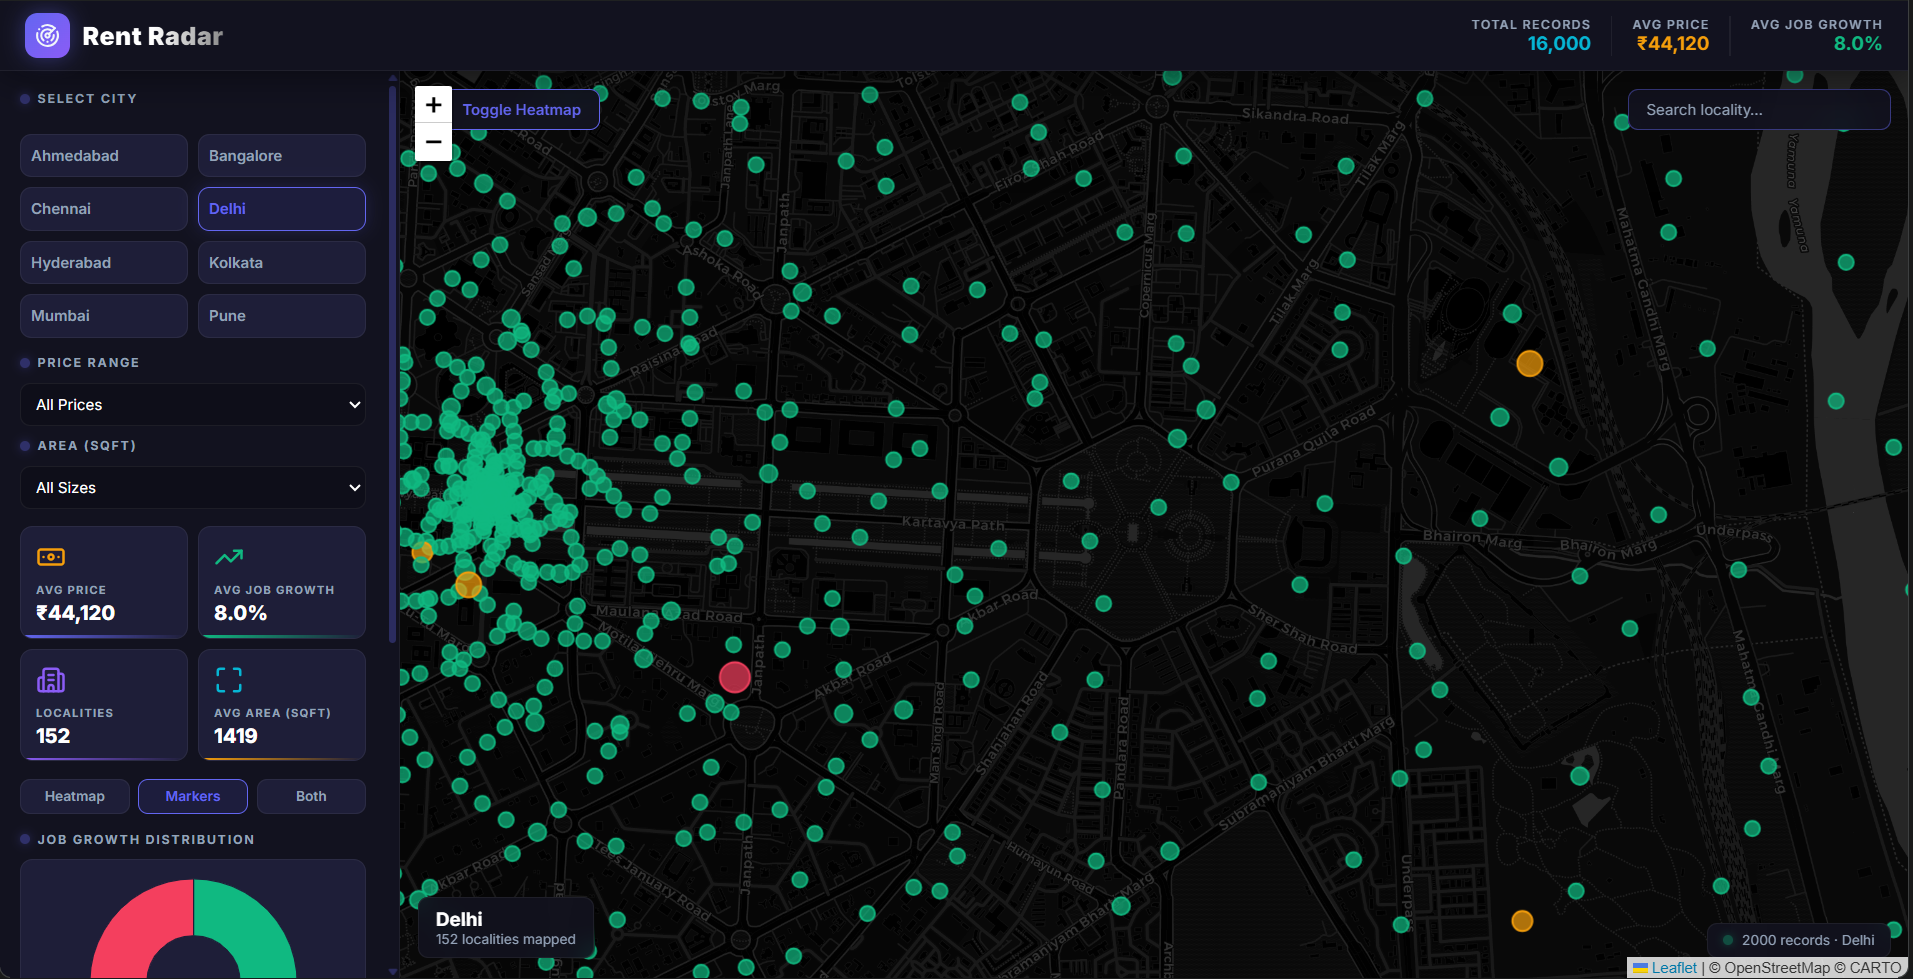
Interactive Markers: Users can click on specific properties to view deep metrics like Rent, Area, Job Growth, and Furnishing type.
Dynamic Dashboard: A side panel instantly calculates and updates key performance indicators (KPIs) and renders Google Charts to show job growth distribution and property types based on the currently viewed map area.
How we built it
We engineered GeoVision to be blazing fast, 100% free to operate, and entirely serverless.
Frontend UI/UX: Built with pure HTML5, CSS3, and Vanilla JavaScript. We designed a custom 'Dark Mode' UI to give it a premium, analytical SaaS feel.
Mapping Engine: To avoid credit-card-gated APIs, we utilized open-source Leaflet.js paired with CartoDB's 'Dark Matter' tile layer.
Data Visualization: We integrated Google Charts API to create dynamic pie and bar charts, fulfilling our goal of utilizing robust Google Technologies.
The Serverless Data Engine: Instead of building a traditional Python backend to parse our massive 17MB CSV dataset, we used PapaParse.js to stream and process the data entirely on the client-side browser.
Hosting: Deployed seamlessly on Google Firebase Hosting
Challenges we ran into
The "Null Island" Bug: Initially, mapping async JSON data caused our coordinates to break, sending all our property markers to (0,0) (the ocean off the coast of Africa). We solved this by implementing strict data validation before rendering the map layers.
Data Overload & Browser Freezing: Rendering over 17,000 data points crashed the DOM. We solved this by writing a chunking algorithm that randomly samples and renders a representative subset (e.g., 2000 records) per city, maintaining both data integrity and a smooth 60fps UI.
Architecture Pivot: Halfway through, we realized a Python-based backend serving JSON would introduce latency. We made a hard pivot to parse the CSV directly in the browser. It was a risky move, but it made the app significantly faster and eliminated server costs.
Accomplishments that we're proud of
Zero-Cost Scalability: We successfully built a data-heavy application that costs exactly $0 to run and host.
Stunning UI: We are incredibly proud of the cyberpunk-inspired dark theme that makes boring CSV data look like a high-tech radar system.
Overcoming API Restrictions: We creatively bypassed expensive mapping APIs by leveraging powerful open-source alternatives while still strictly meeting the hackathon's "Google Technologies" requirement via Firebase and Google Charts.
What we learned
Client-Side Power: We learned just how powerful modern browsers are at data processing. Processing 17MB of raw CSV data on the client-side without a backend was a huge eye-opener.
Geospatial Data Handling: We gained deep insights into handling latitude/longitude coordinates and visualizing them via heatmaps and spatial clustering.
Resilience: We learned the importance of pivoting quickly when a specific architecture (like our initial backend plan) isn't working under a strict time limit.
What's next for rent radar
Live API Integration: Replacing the static CSV with live API hooks to fetch real-time property prices from platforms like MagicBricks or Housing.com.
Predictive AI: Integrating a Machine Learning model to forecast rent prices for the next 5 years based on upcoming infrastructure (like new metro lines).
User Accounts: Allowing users to save their favorite localities and set price drop alerts using Firebase Authentication and Cloud Firestore.

Log in or sign up for Devpost to join the conversation.