Inspiration
The transition to renewable energy can be complex and data-driven. RenewSim was inspired by the need to simplify this complexity into an interactive learning experience. We wanted to help students, educators, and sustainability advocates visualize how environmental factors and energy sources interact in real-time.
What it does
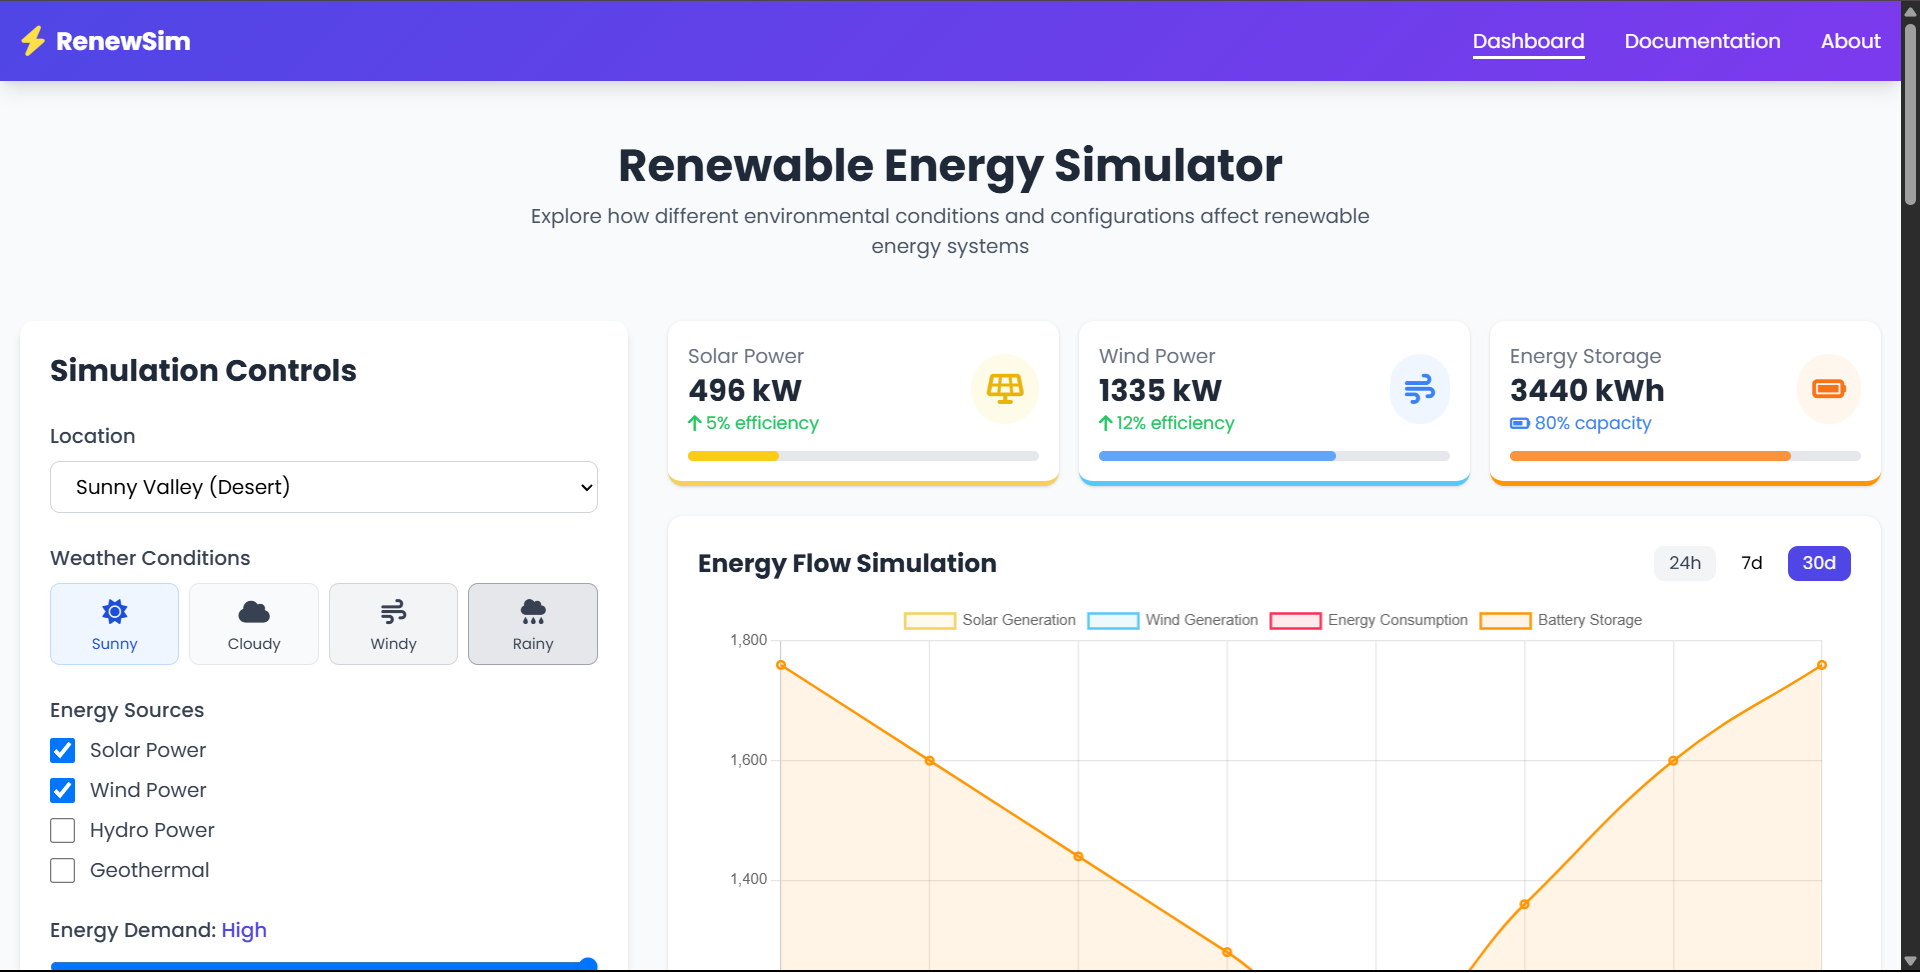
RenewSim is a web-based renewable energy simulation platform. It allows users to:
- Choose environmental scenarios (e.g., desert, coastal, mountain)
- Adjust weather conditions like sunny, cloudy, or rainy
- Enable or disable energy sources (solar, wind, hydro, geothermal)
- Set energy demand and storage capacity
- View live updates on power generation, consumption, and system efficiency
How we built it
We built RenewSim using a modern frontend stack:
- HTML5, CSS3, and JavaScript for structure and interactivity
- Tailwind CSS for styling
- Chart.js for energy flow data visualization
- GSAP for smooth animations
- Font Awesome for intuitive icons
Key logic includes energy production algorithms and simulation response functions based on user inputs.
Challenges we ran into
- Designing an intuitive UI for a technically complex simulation
- Creating a realistic energy output model for each source under varying conditions
- Maintaining performance while updating multiple data charts and UI components in real-time
Accomplishments that we're proud of
- A responsive and visually engaging dashboard that effectively models complex energy systems
- Real-time simulation based on user-selected scenarios
- Educator/test-case-friendly design with clear visualization of renewable interactions
What we learned
- How to simulate dynamic environmental systems in the browser using JavaScript
- Deeper understanding of how renewable energy sources perform under different conditions
- Effective use of modern frontend frameworks for building interactive dashboards
What's next for RenewSim
- Add real-time weather API integration to simulate actual conditions
- Implement carbon savings calculations
- Export simulation data to CSV/PDF reports
- Add user authentication and dashboards to track usage patterns and simulations over time
- Extend to simulate grid interactions and smart metering
Built With
- css3
- html5
- javascript
- tailwind


Log in or sign up for Devpost to join the conversation.