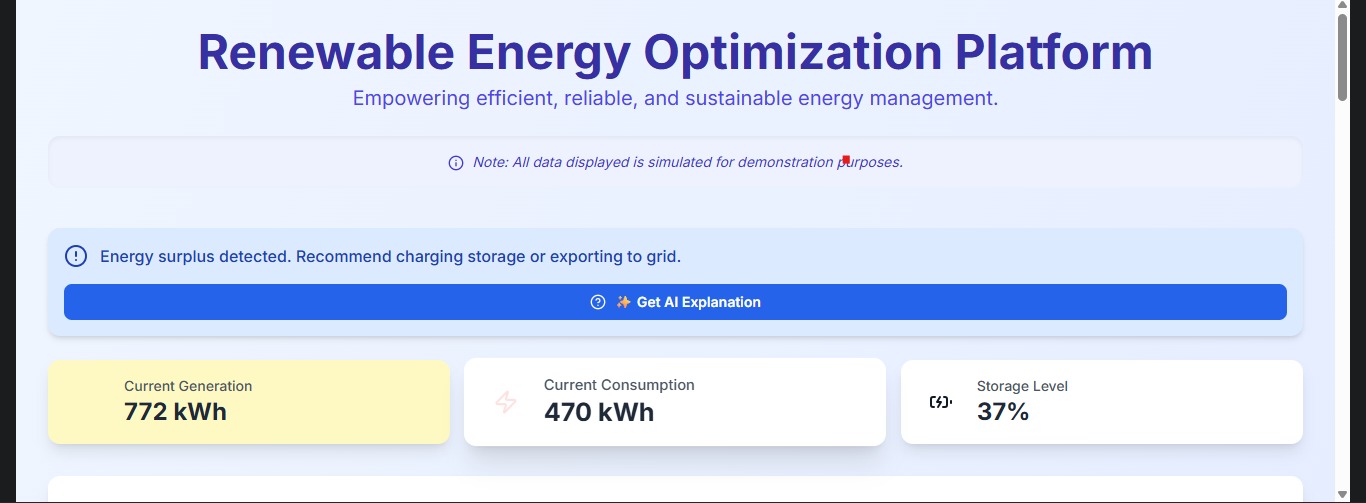
Our Renewable Energy Optimization Platform Story The Spark of Inspiration The idea for the Renewable Energy Optimization Platform was born from a deep concern for our planet's future and a fascination with the potential of technology to address pressing environmental challenges. We recognized that while renewable energy sources like solar and wind are crucial, their intermittent nature poses significant challenges to grid stability and efficient utilization. We envisioned a world where every kilowatt-hour generated from clean sources is maximized, where energy waste is minimized, and where communities can actively participate in a smarter, more sustainable energy ecosystem. The sheer complexity of balancing dynamic supply with fluctuating demand, especially with distributed energy resources, presented an exciting intellectual puzzle that we were eager to solve.
What We Learned Along the Way Building this platform was a journey of continuous learning. We delved deep into various domains, from the intricacies of energy grids and smart meter data to the nuances of machine learning models for forecasting and optimization. We learned about:
Time-Series Data Management: The critical importance of efficient ingestion, storage, and processing of high-volume, real-time time-series data.
Machine Learning for Prediction: How different ensemble models like LSTM and gradient boosting can be tailored for accurate demand forecasting, and the significance of metrics like MAE and RMSE in evaluating their performance.
Grid Protocols and Interoperability: The necessity of understanding standards like MQTT, IEC 61850, OpenADR, and IEEE 2030.2 to ensure seamless communication and control across diverse energy assets.
User Experience (UX) in Complex Systems: How to translate complex data and technical operations into an intuitive, actionable dashboard that empowers operators without overwhelming them. This involved a lot of iteration on KPI design, chart visualization, and alert presentation.
The Power of AI for Actionable Insights: Integrating large language models (LLMs) like Gemini to provide human-readable explanations and proactive recommendations proved to be a game-changer, moving beyond just data display to intelligent guidance.
How We Built It Our approach was modular and iterative, focusing on building a robust foundation while progressively adding intelligent features.
Core Data Simulation: We started by creating a reliable simulation layer for real-time and historical energy data (generation, consumption, storage). This allowed us to develop and test the front-end and initial logic without needing live hardware.
React Frontend with Tailwind CSS: We chose React for its component-based architecture, which facilitated modular development, and Tailwind CSS for rapid, responsive UI development. This allowed us to quickly build the dashboard layout, KPI cards, and chart components.
Basic Visualization: Initial efforts focused on rendering the simulated data into live charts (bar charts, line charts, pie charts) to provide real-time monitoring and resource breakdowns. We prioritized clear, color-coded visuals.
Simulated Features: We implemented placeholder functionalities for "Custom Reports" and "Smart Grid Integration" to outline future capabilities and ensure the overall architecture could accommodate them.
Integrating LLMs (Gemini API): This was a pivotal step.
Optimization Suggestions: We integrated the Gemini API to take current simulated metrics (generation, consumption, storage) and generate concise, actionable optimization recommendations. This involved crafting effective prompts to guide the LLM's output.
Alert Explanations: We extended the LLM integration to provide detailed explanations and suggested actions for simulated energy alerts. This added a crucial layer of intelligence for diagnosing and responding to anomalies.
Refinement and Polish: Throughout the process, we continuously refined the UI/UX, ensuring responsiveness, interactivity, and visual appeal, adding subtle animations and clear messaging.
Challenges We Faced Developing this platform, even in its simulated form, came with its share of challenges:
Managing State Complexity: With multiple real-time data streams and interactive elements, managing React's state effectively to avoid unnecessary re-renders and ensure data consistency was a constant challenge. This led to the "Maximum update depth exceeded" error, which we resolved by carefully managing useCallback dependencies.
Simulating Realistic Data: Generating believable and dynamic simulated energy data that reflected real-world patterns (e.g., solar generation peaking during the day, consumption fluctuating) was trickier than anticipated.
Crafting Effective LLM Prompts: Getting the Gemini API to consistently provide relevant, concise, and actionable recommendations required careful experimentation with prompt engineering. Balancing specificity with flexibility was key.
Visualizing Complex Data Simply: Condensing intricate energy metrics and forecasts into easily digestible charts and KPIs without oversimplifying the underlying information was an ongoing design challenge.
Scalability Mindset from the Start: Even though it's a simulated demo, designing the application with a modular architecture and anticipating future integration with real data pipelines (like Kafka, InfluxDB) required foresight and adherence to best practices.
Despite these challenges, the process was incredibly rewarding. Seeing the platform come to life, demonstrating how intelligent systems can contribute to a more efficient and sustainable energy future, reaffirmed our commitment to this vision.
Built With
- influxdb
- react
- snowflake
- tailwind


Log in or sign up for Devpost to join the conversation.