-
-
intro
-
arch
-
about the fix
-
diff frame-by-frame
Inspiration
A failed render is more than an infrastructure alert. It can block editorial review, waste GPU time, and force render supervisors, artists, and platform engineers to manually compare metrics, logs, traces, asset changes, and frame output. Most monitoring systems stop after showing that something is wrong. We wanted to build an agent that could connect a visible problem in the video to its operational cause, recommend a controlled fix, and verify the result before the shot returns to production.
What it does
RenderOps Director starts with a cinematic shot containing visible denoise artifacts and failed frames.
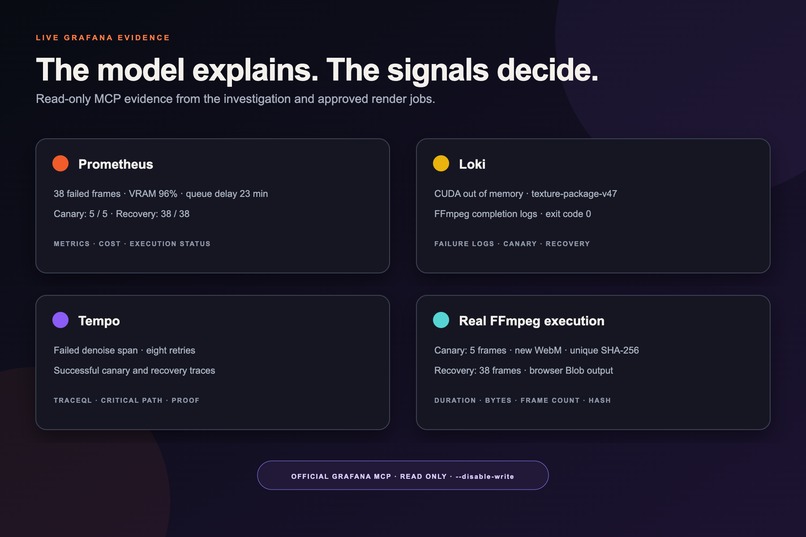
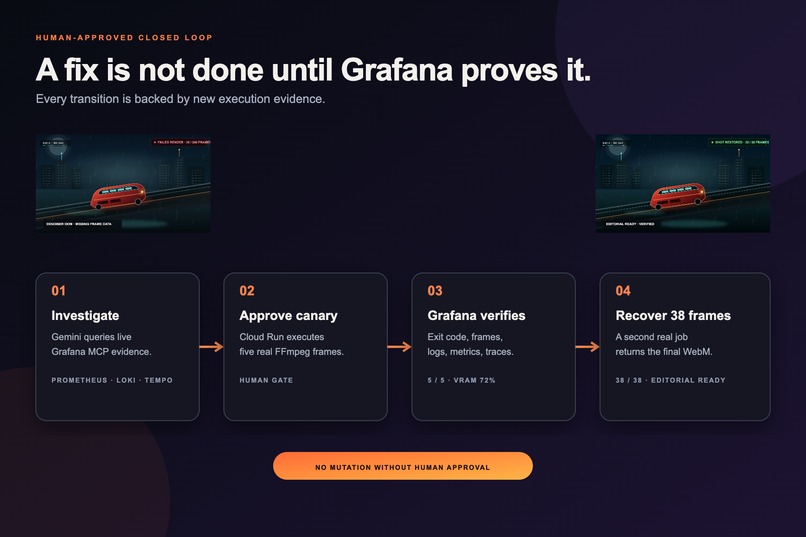
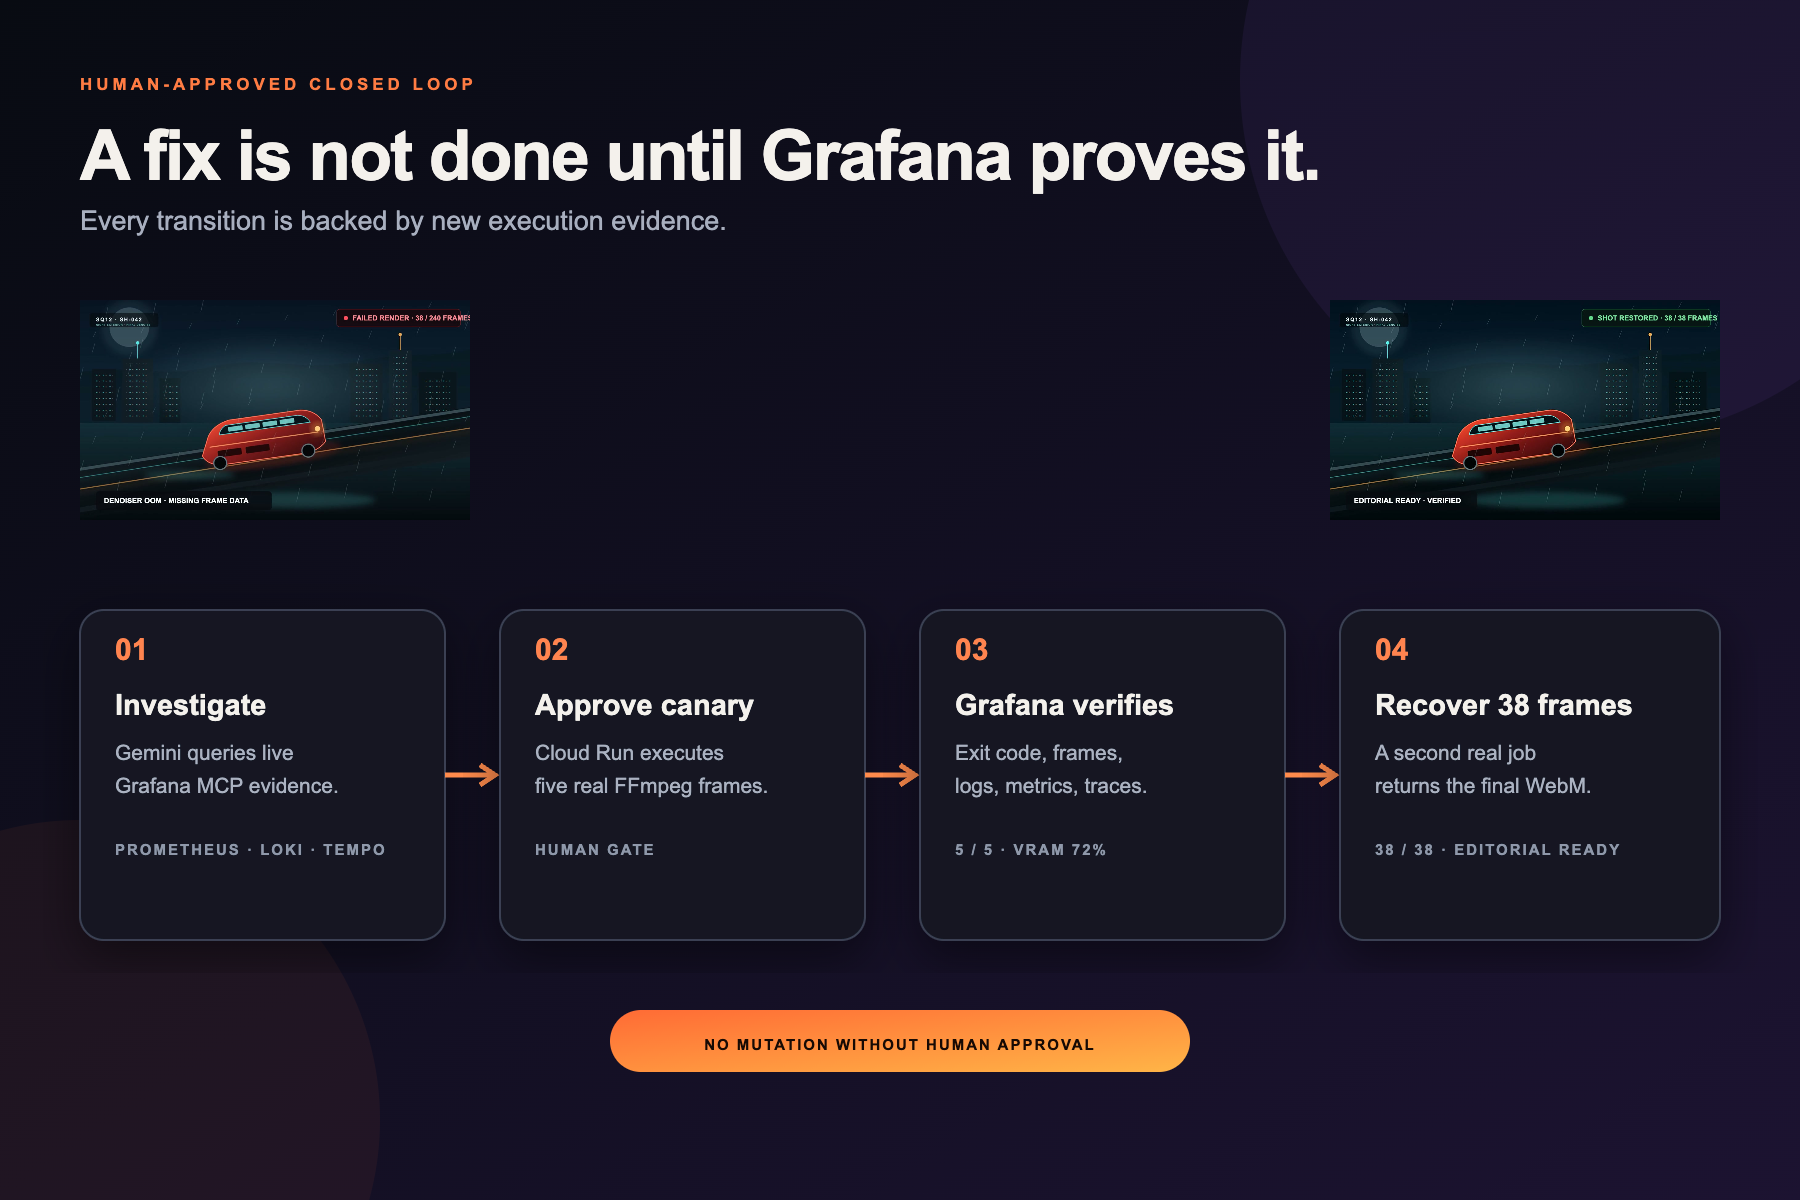
The operator launches an investigation. A Gemini agent uses the official Grafana MCP server to examine Prometheus metrics, Loki logs, and Tempo traces. It identifies the failed frame range, GPU memory pressure, the affected render pass, the asset version involved, the delivery risk, and the cost of different recovery options. The agent recommends a five-frame canary instead of immediately rerendering the whole shot. Nothing runs without human approval.
After approval, FFmpeg performs real media processing inside Google Cloud Run and creates a new WebM file. Execution details such as exit code, duration, frame count, output size, logs, and traces are sent to Grafana Cloud. The recovery remains locked until Grafana verifies the canary. A second approval processes the 38 failed frames. Grafana verifies the final execution, and the newly generated recovered shot is returned to the browser and marked ready for editorial review.
How we built it
The application is a Python FastAPI service deployed to Google Cloud Run.
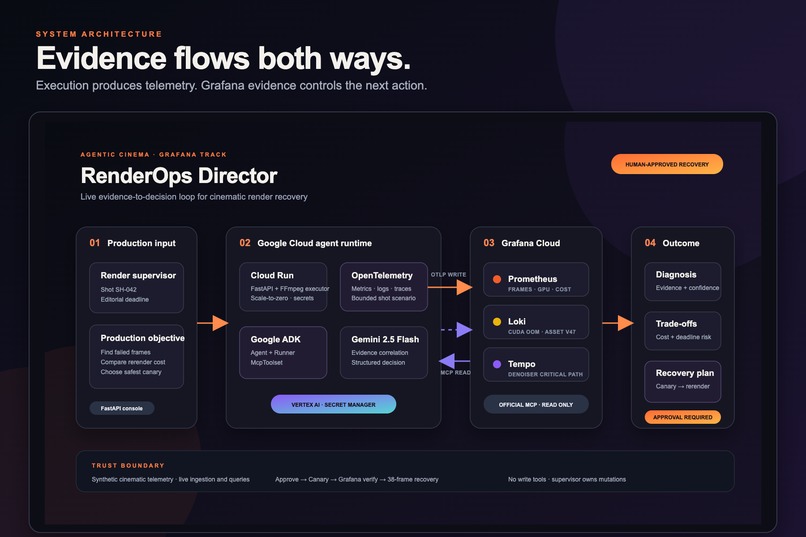
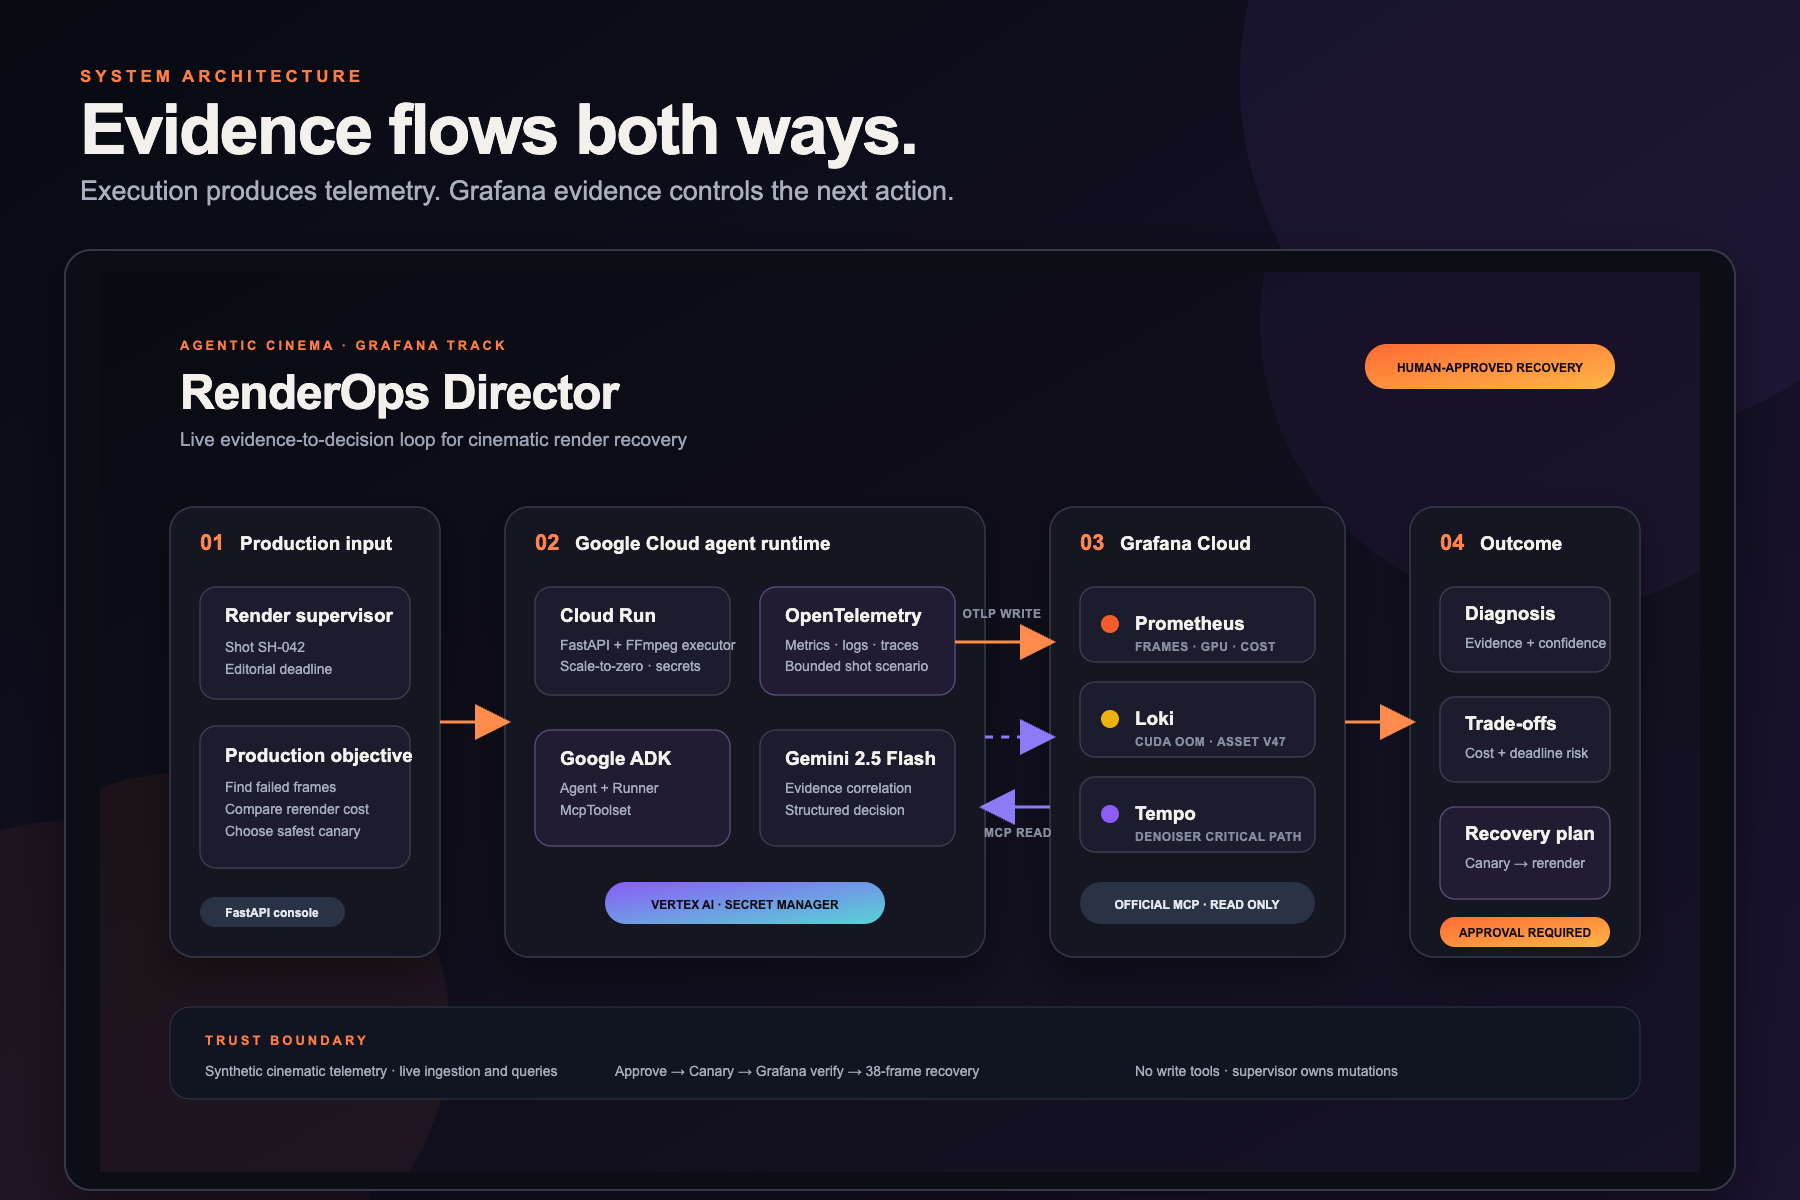
Google Agent Development Kit orchestrates the investigation, with Gemini 2.5 Flash running through Vertex AI. The agent connects to the official mcp-grafana server over stdio inside the Cloud Run container.
Render telemetry and actual execution data are sent through OpenTelemetry to Grafana Cloud:
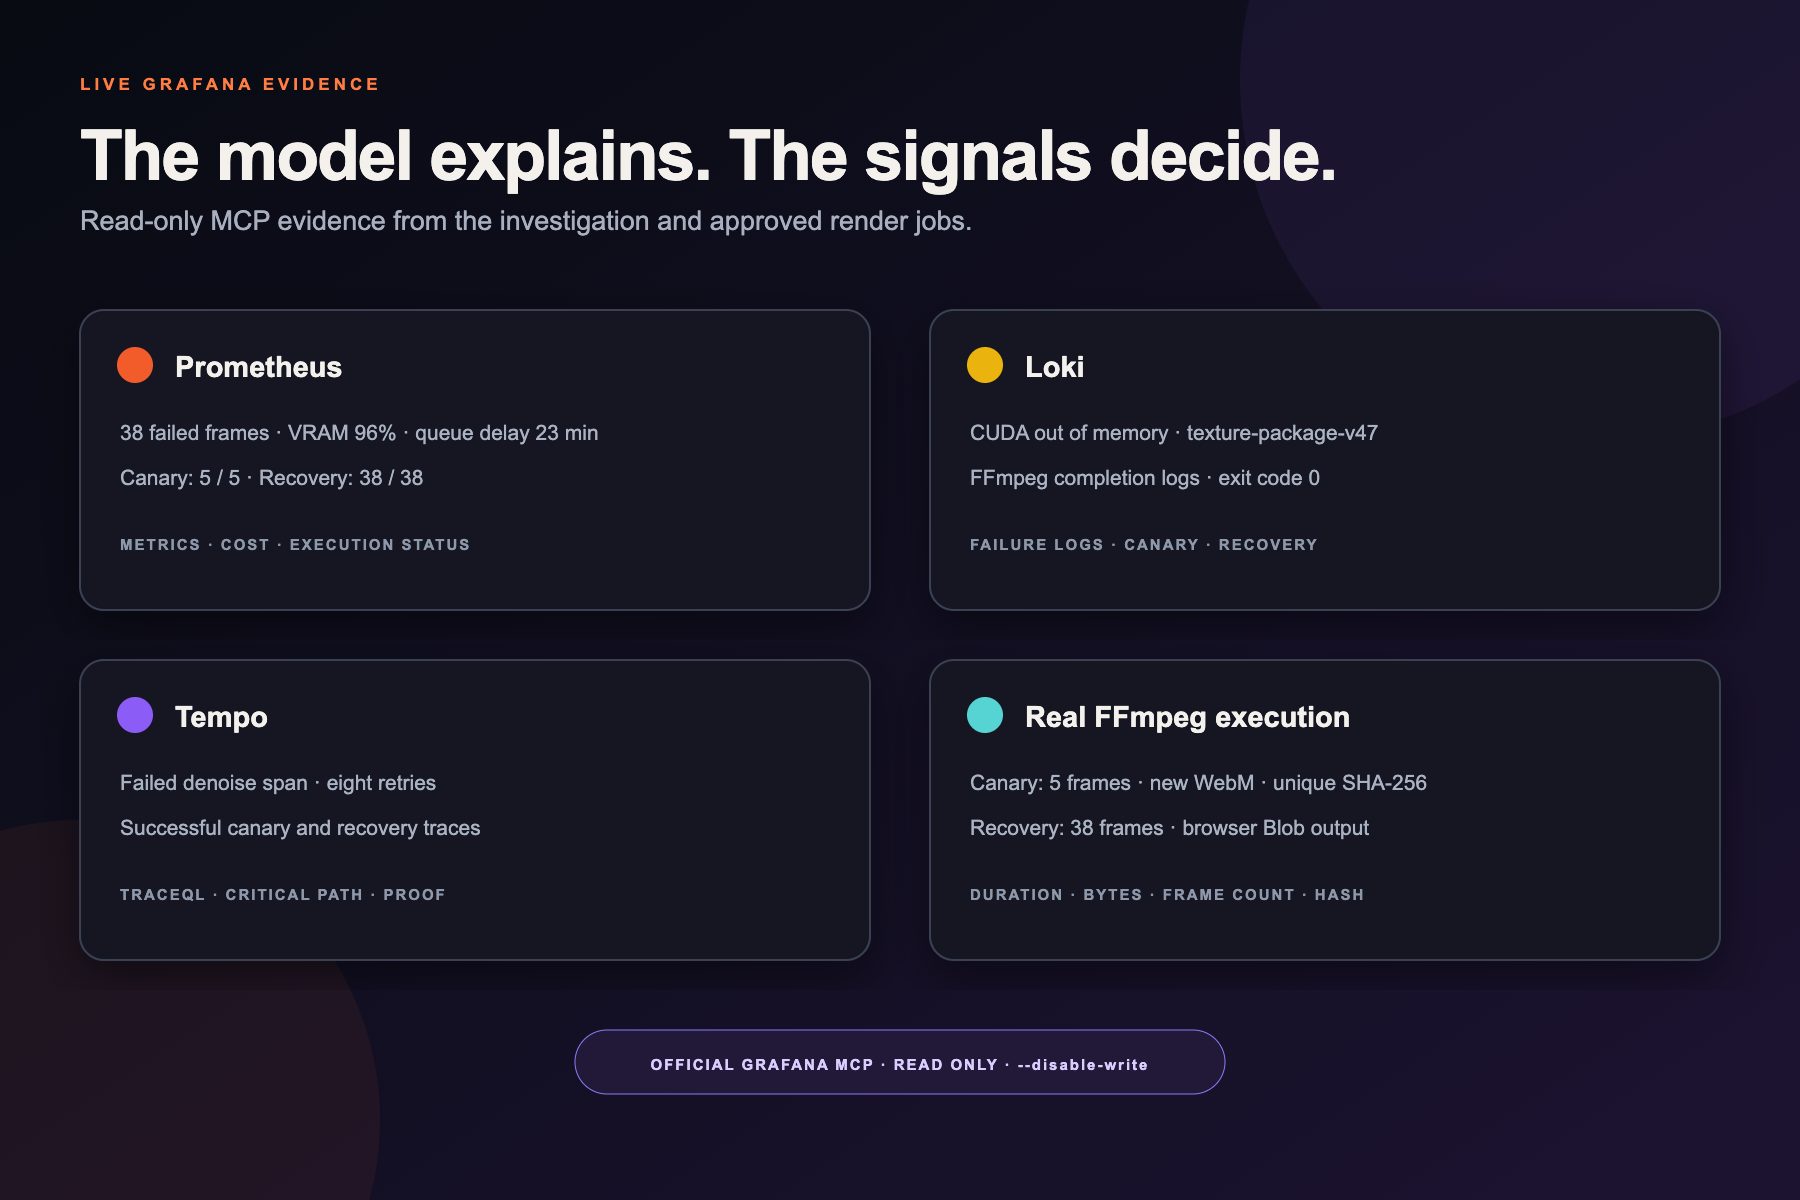
- Prometheus stores frame, GPU, queue, cost, and FFmpeg execution metrics.
- Loki stores renderer and media-processing logs.
- Tempo stores denoise, canary, recovery, and execution traces.
FFmpeg runs inside the same Cloud Run service after human approval. The generated media is returned directly to the browser as a Blob, rather than using a prepared static result.
The MCP connection is read-only and starts with --disable-write. Credentials are stored in Google Secret Manager.
Challenges we ran into
The first challenge was making the Grafana integration real. We did not want Grafana to be a logo or a screenshot. The application sends data to Grafana Cloud and then reads it back through official MCP calls before producing a decision.
Tool-heavy Gemini investigations sometimes finished without a complete final response. We solved this with a bounded primary-agent timeout and a parallel read-only MCP collector. If the exploratory agent does not produce valid structured output, a schema-constrained Gemini pass formats the actual MCP responses.
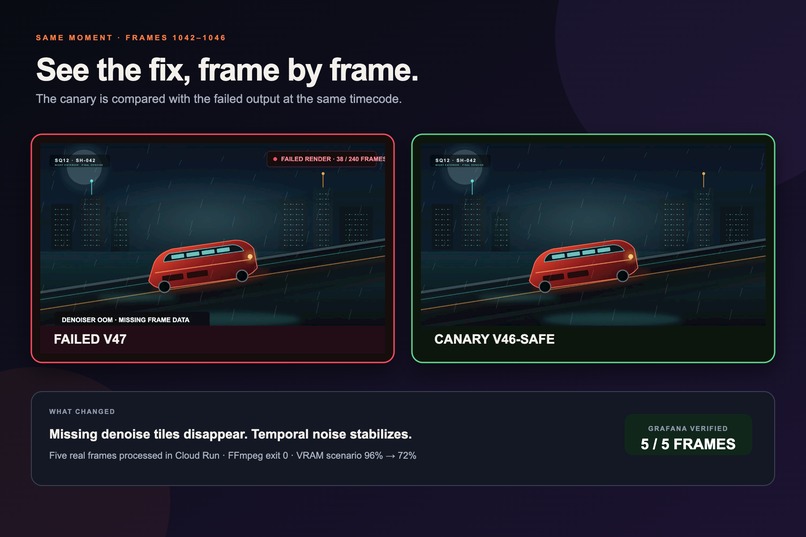
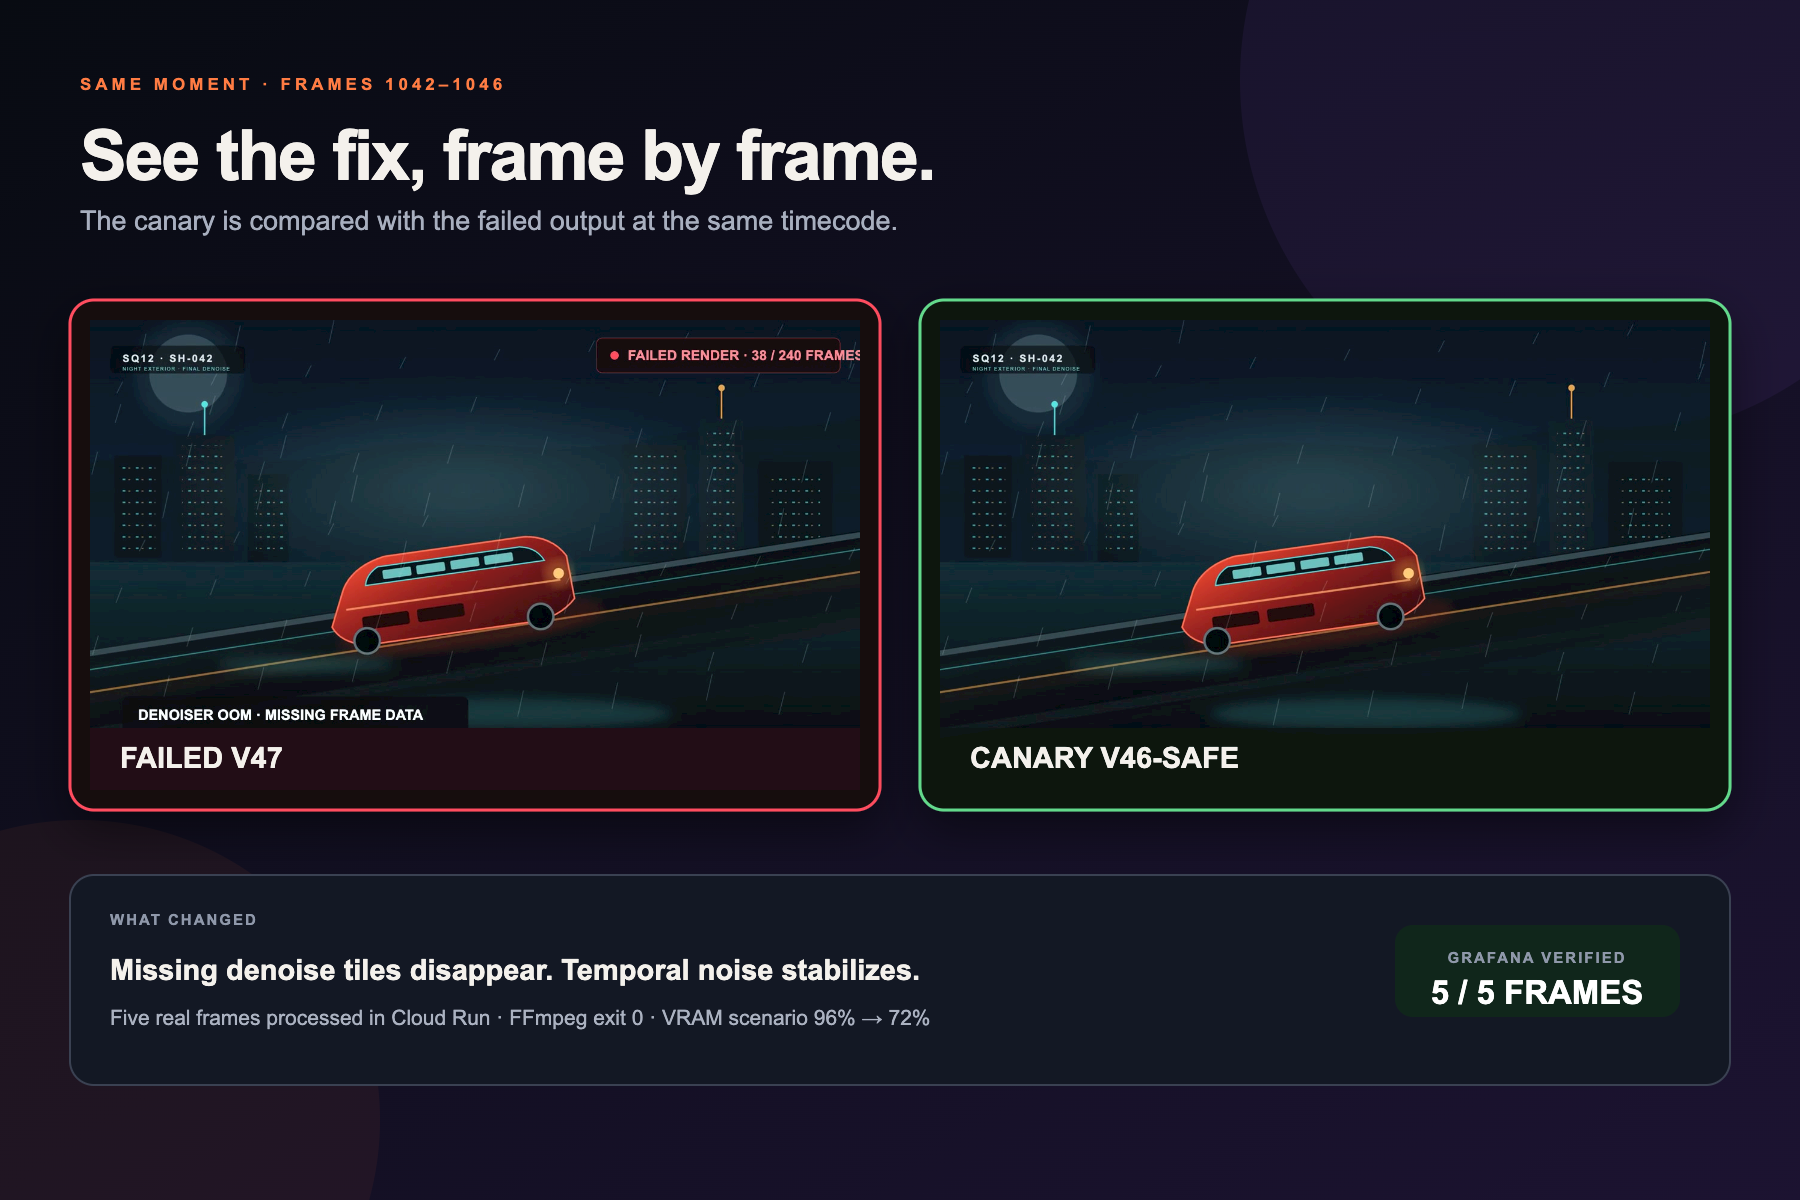
We also had to make the media problem tangible. A shot ID and a list of metrics were not enough, so we added the original plate, visible render artifacts, a failed-frame timeline, a synchronized canary comparison, and a final recovered video.
The last challenge was preserving causality. Canary and recovered media remain hidden until their corresponding approved execution and Grafana verification have completed.
Accomplishments that we're proud of
We built a complete live path from a visible media failure to a verified recovery. The public application uses Google ADK, Gemini, Vertex AI, Grafana Cloud, and the official Grafana MCP runtime. Prometheus, Loki, and Tempo are queried during investigation and after each approved recovery phase. Approved actions run real FFmpeg processing inside Cloud Run. They create new media files and export their actual execution evidence to Grafana.The workflow is human-controlled, reproducible without judge credentials, and protected from unverified or premature recovery actions.
What we learned
Observability becomes more useful when it is translated into a domain decision. A GPU memory metric alone does not tell a render supervisor what to do. Combined with failed frames, renderer logs, traces, asset versions, delivery risk, and cost, it can support a clear recovery plan.
We also learned that model reasoning should not control deterministic facts. Cost calculations, execution status, frame counts, and approval transitions are enforced by application code. Gemini explains and correlates the evidence, while Grafana and the execution runtime remain authoritative. Finally, showing the actual media matters. The problem, canary, and recovered shot make the operational evidence understandable to people outside an infrastructure team.
What's next for RenderOps Director
The next step is connecting the workflow to a real render scheduler such as OpenCue and to a production tracking system containing shot, sequence, and asset metadata. We would also add historical comparisons with previous successful renders, approval-backed renderer configuration changes, and automated verification after deployment to a real render farm.
The same pattern could support animation, visual effects, virtual production, game cinematics, and other GPU-intensive media pipelines.

Log in or sign up for Devpost to join the conversation.