-
-
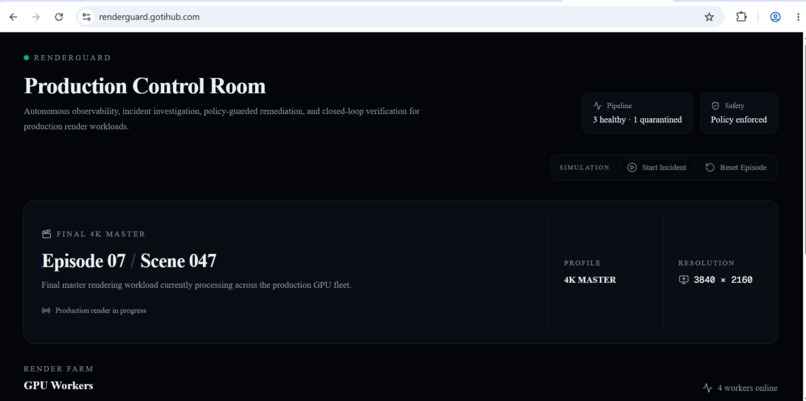
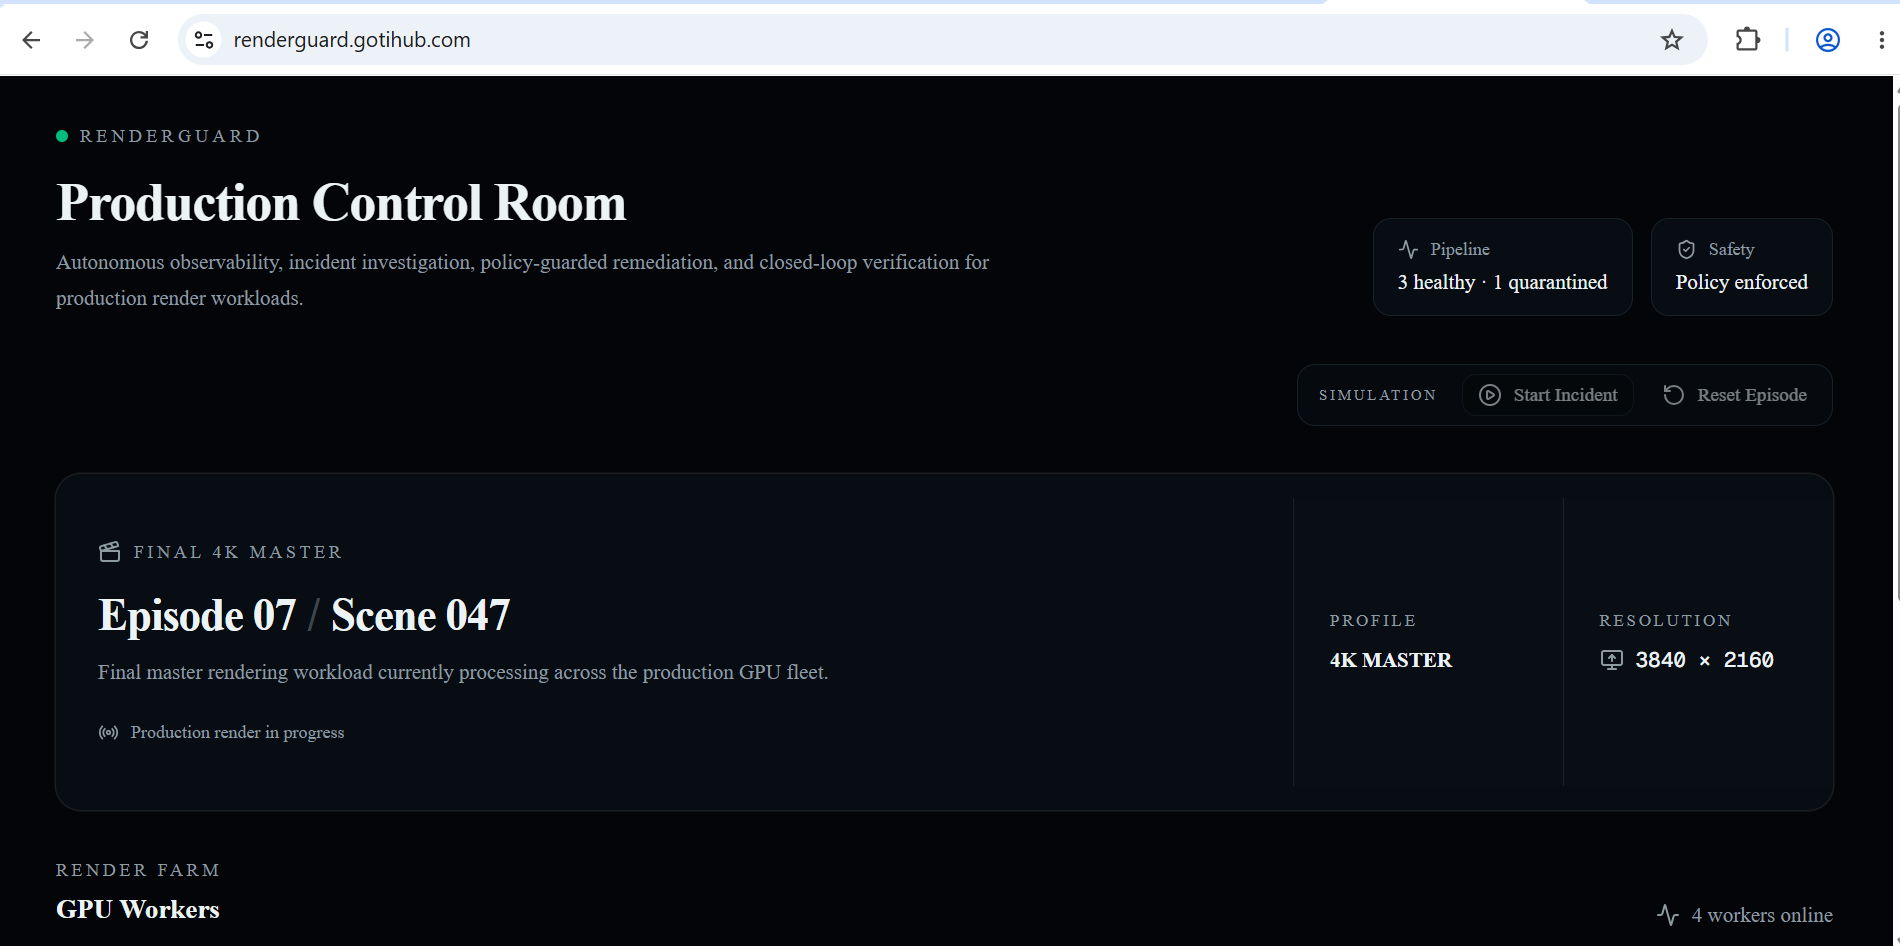
RenderGuard Production Control Room — monitoring the Final 4K Master across the production GPU render fleet.
-
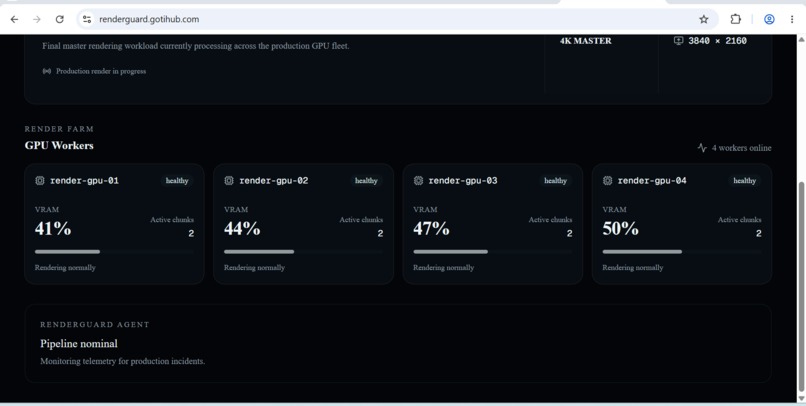
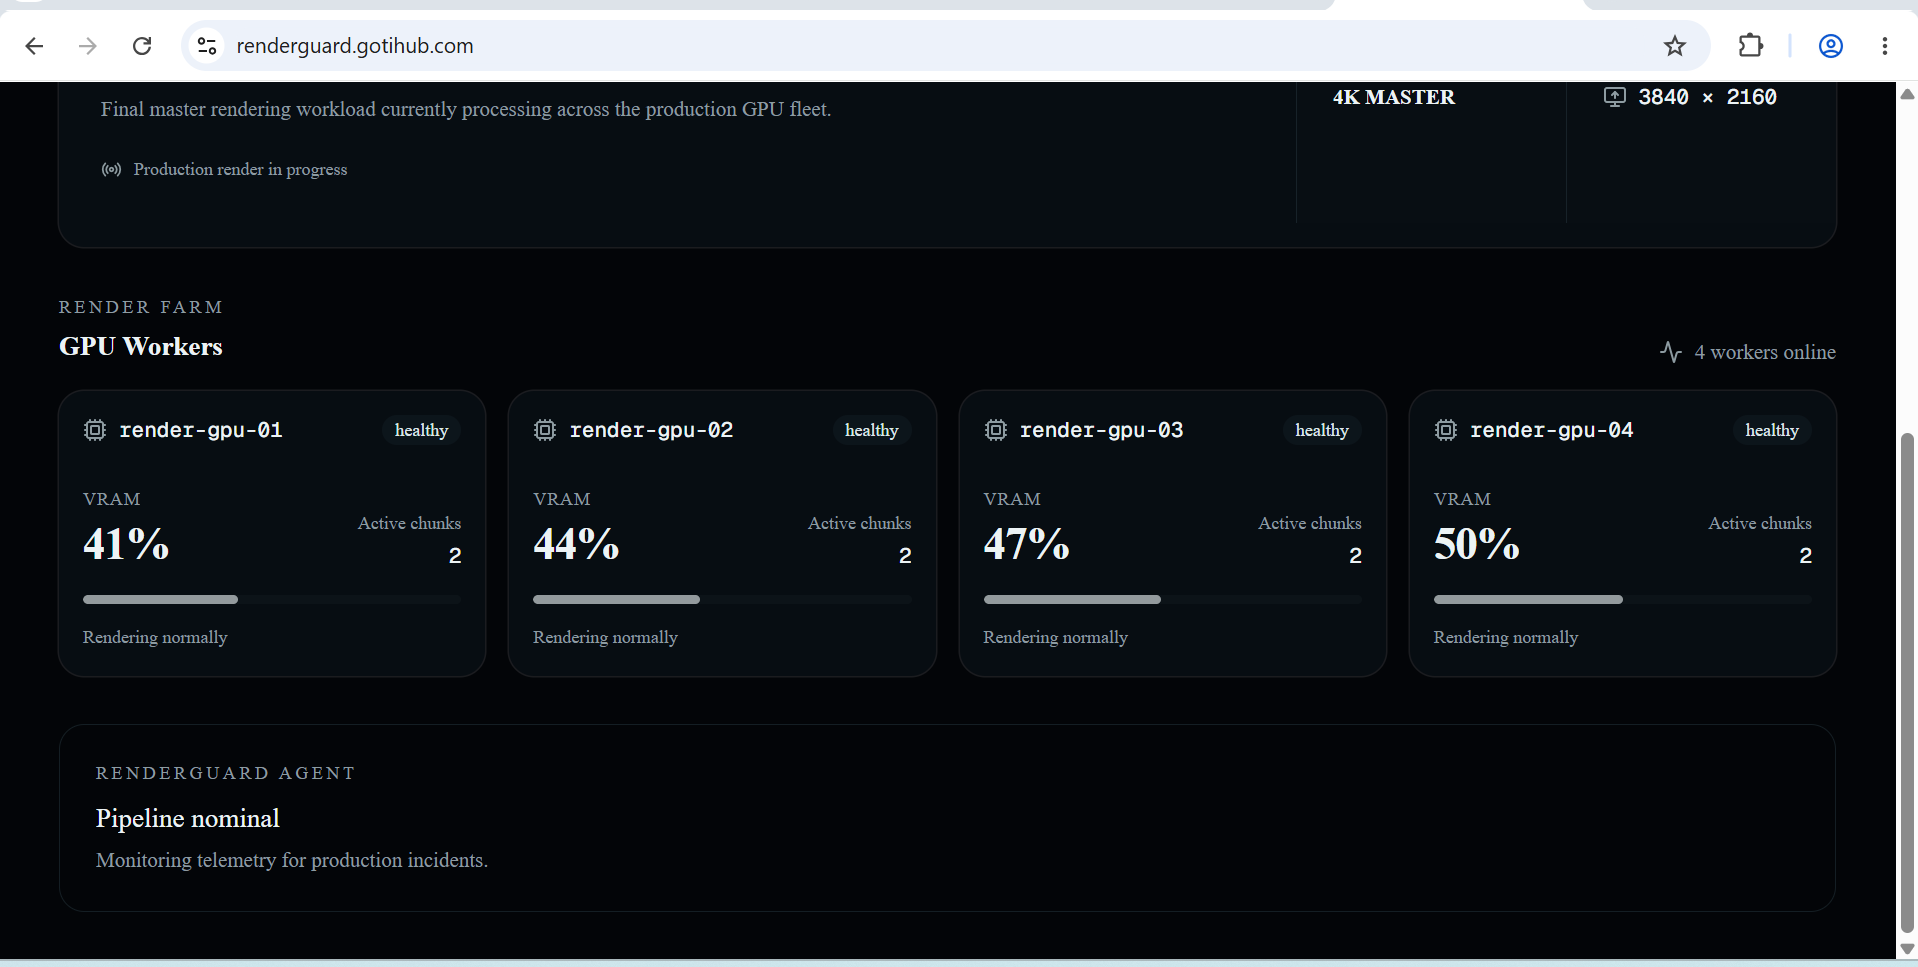
Four GPU workers processing the render normally before incident injection.
-
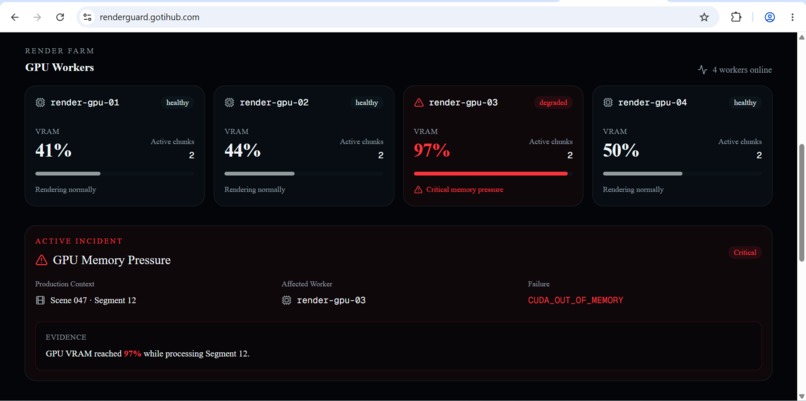
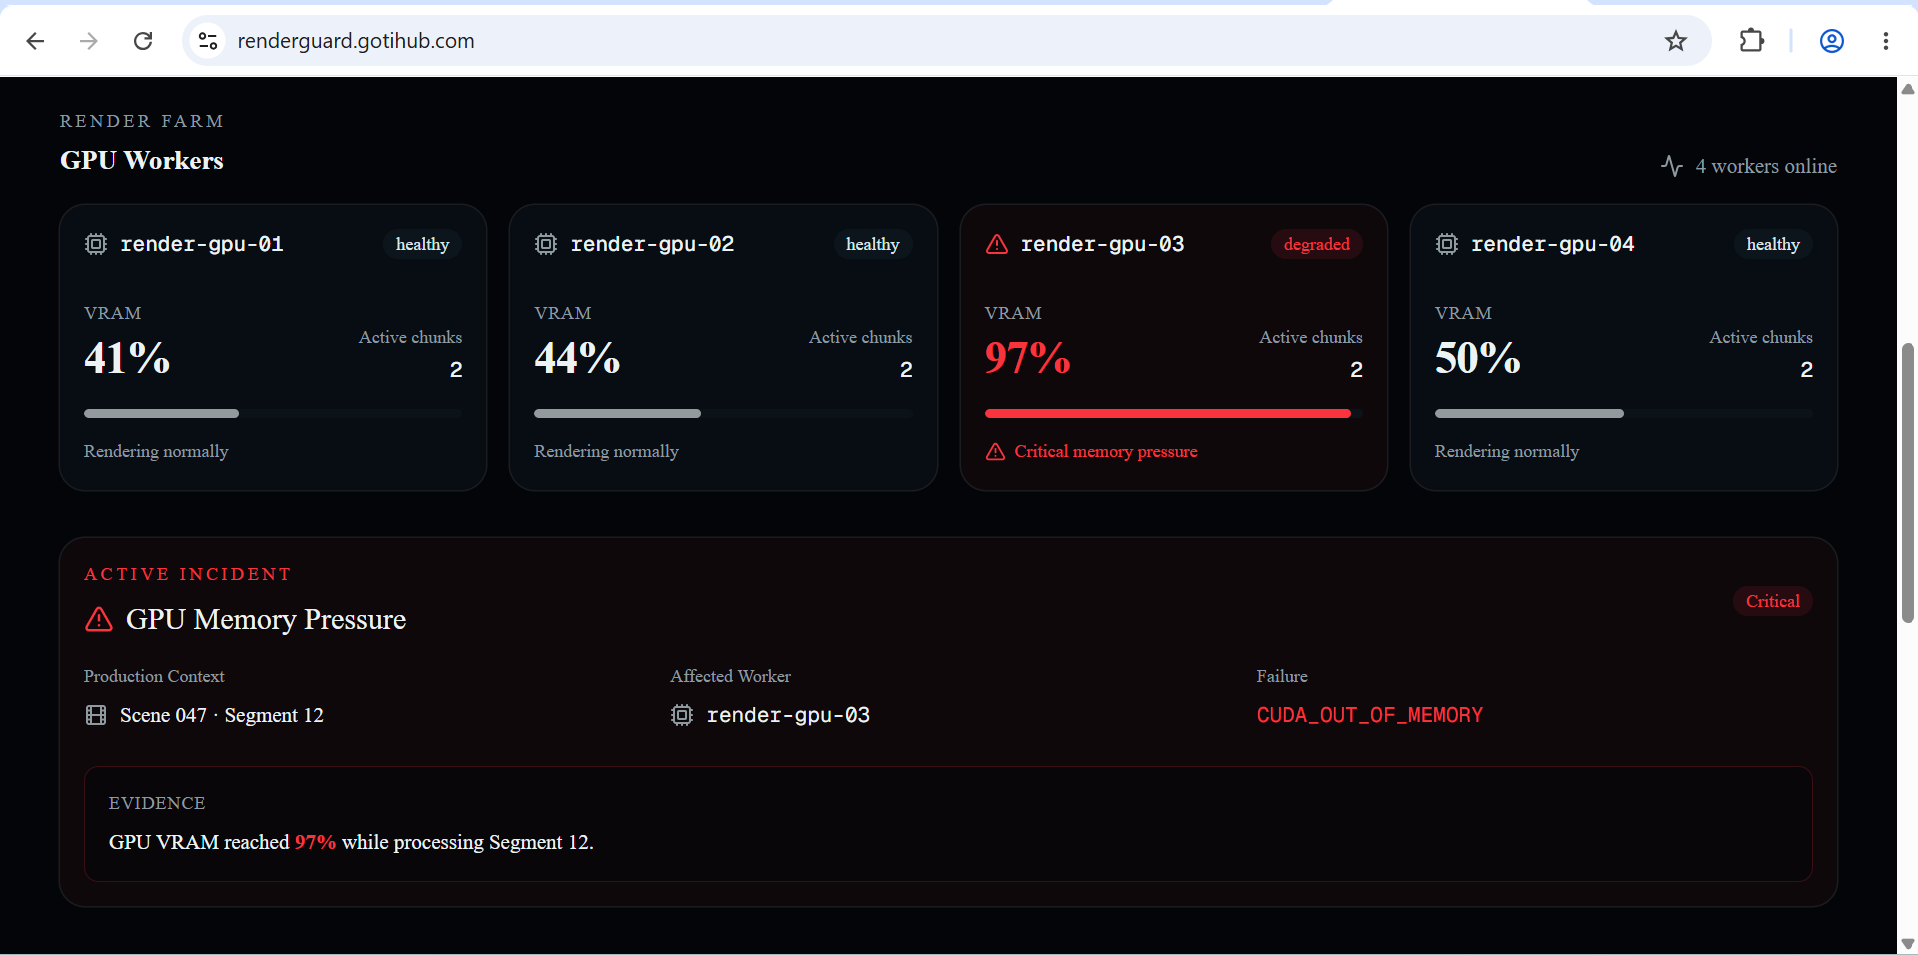
GPU memory pressure on render-gpu-03 reaches 97% VRAM, causing a CUDA_OUT_OF_MEMORY failure on Scene 047 · Segment 12.
-
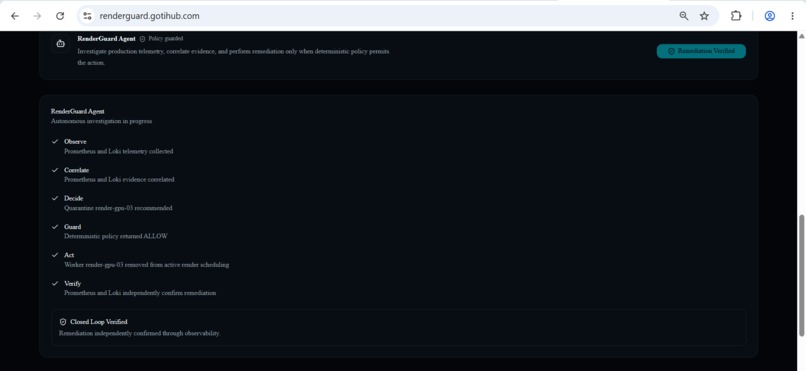
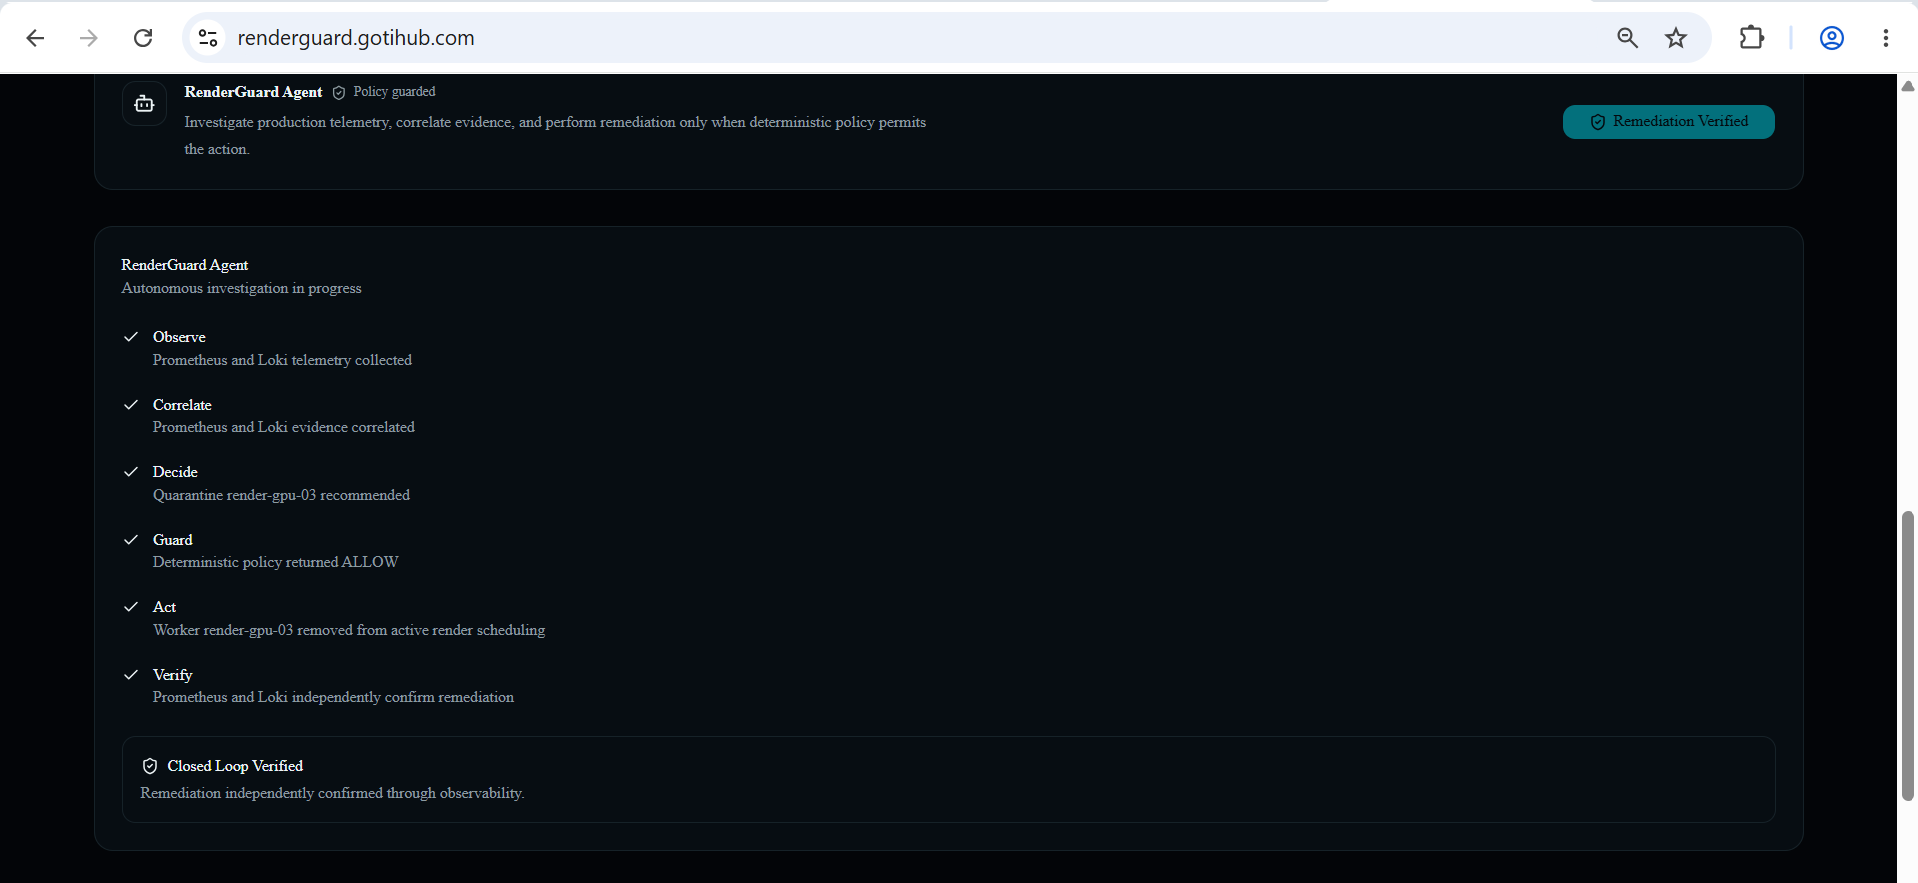
Gemini + Google ADK investigate, remediate within policy, and verify recovery through Grafana MCP.
-
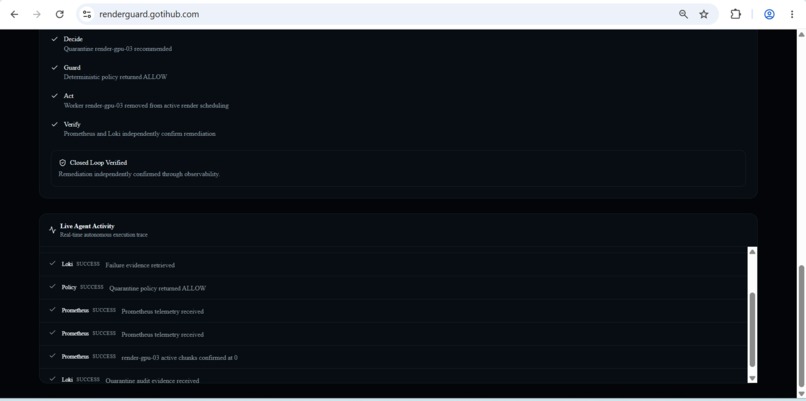
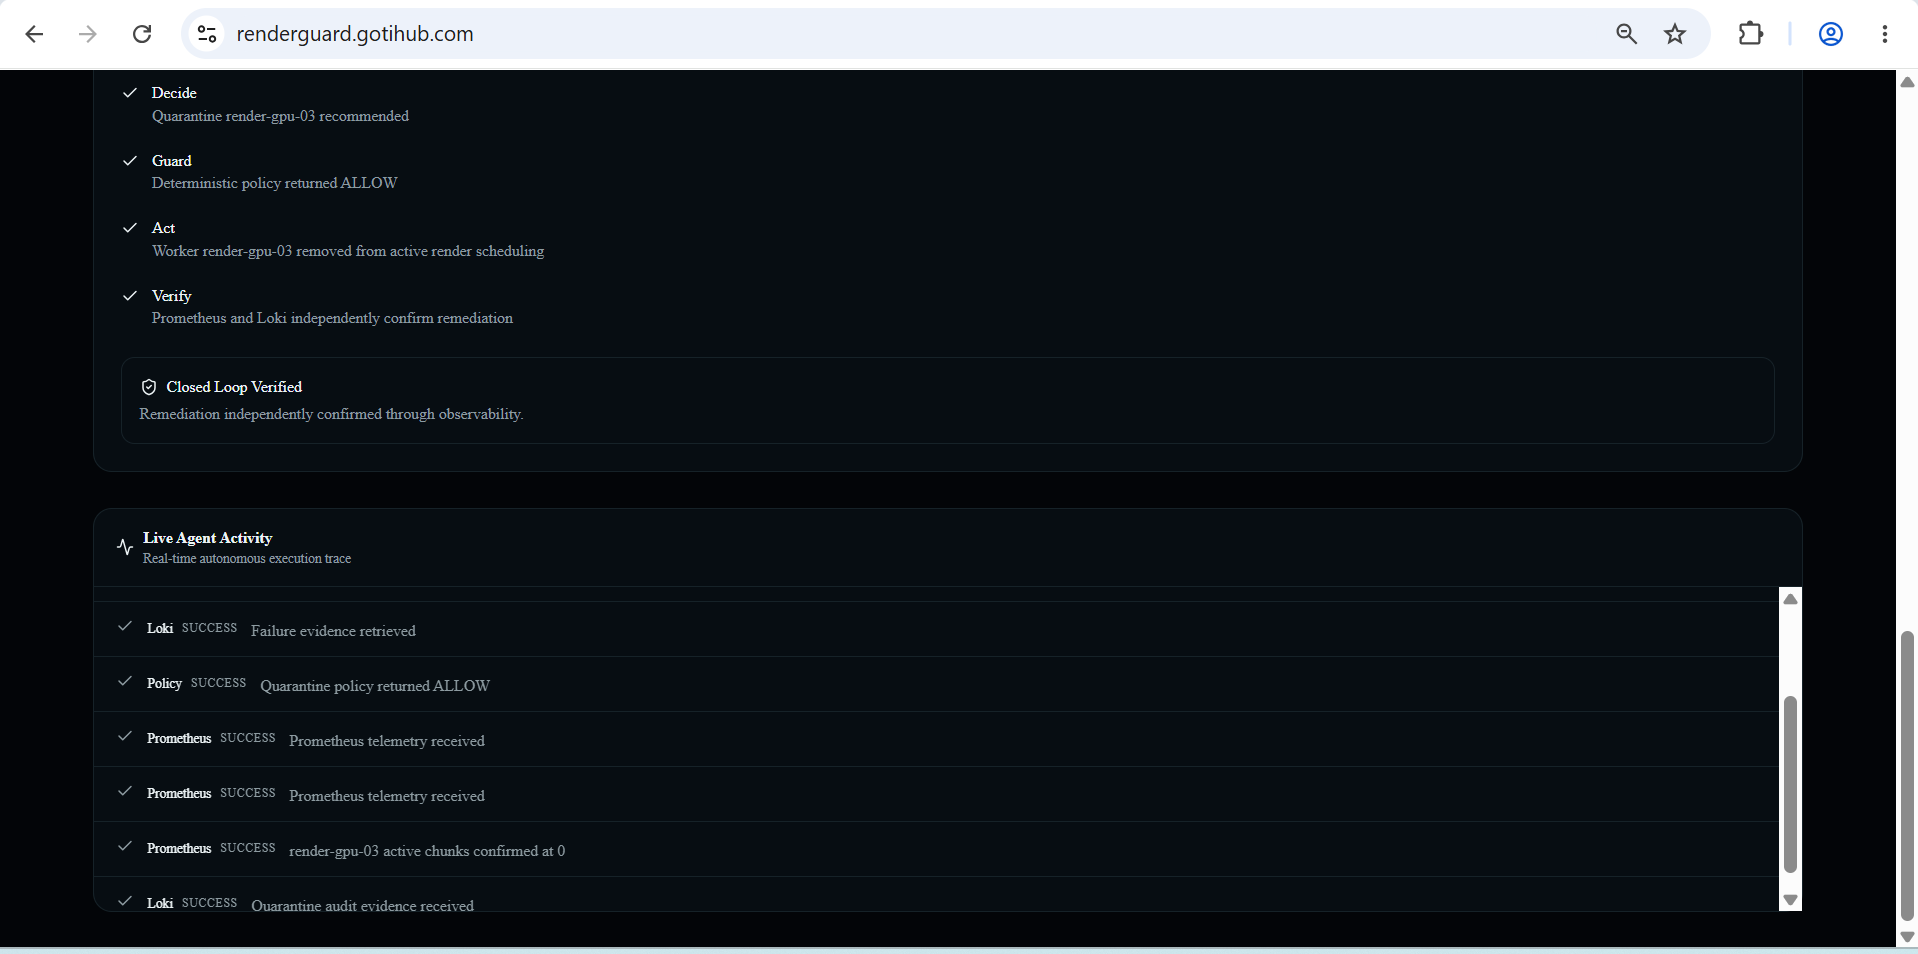
Live execution trace showing policy ALLOW, Prometheus verification of zero active chunks, and Loki quarantine audit evidence.
Inspiration
Modern film and VFX production depends on increasingly complex GPU rendering infrastructure. A single unhealthy worker during a 4K master render can create failed chunks, delayed work, and a difficult investigation across metrics and logs.
But we were interested in a harder problem than detecting failures.
As AI agents gain the ability to operate production systems, where should their authority stop?
An LLM may be capable of identifying a failing worker and recommending remediation, but we didn't want a system where a model could simply decide to mutate production infrastructure and then trust its own result.
That led to RenderGuard: an agentic production control room where Gemini reasons, deterministic policy authorizes, the pipeline acts, and Grafana independently verifies.
What it does
RenderGuard monitors a simulated production GPU fleet processing a 4K MASTER render for Episode 07 / Scene 047.
During the demo, render-gpu-03 develops critical GPU memory pressure. VRAM reaches 97%, the worker becomes unhealthy, and a render chunk fails with CUDA_OUT_OF_MEMORY.
A Gemini 2.5 Flash agent built with Google ADK investigates the incident using real production telemetry through Grafana MCP.
It queries Prometheus metrics to identify the unhealthy worker, then correlates the anomaly with structured Loki logs containing the affected scene, render segment, resolution, and failure reason.
When the evidence supports quarantine, Gemini can propose the remediation — but it cannot authorize it.
A deterministic safety policy evaluates the worker state, VRAM pressure, and failed chunks before allowing or denying the action.
If allowed, RenderGuard quarantines the worker.
But the workflow doesn't end when the API returns success.
The agent returns to Grafana and independently verifies that:
- the worker has zero active render chunks
- Loki contains the corresponding
worker_quarantinedevent
Only then does RenderGuard declare the incident resolved.
How we built it
RenderGuard is built as three independently deployable services on Google Cloud.
The production control room is a Next.js + TypeScript application running on Cloud Run behind Google's external HTTPS load balancer.
The rendering control plane is a FastAPI service running separately on Cloud Run. It models the GPU worker fleet, exposes deterministic failure simulation and remediation capabilities, and produces production telemetry.
Metrics are exported through OpenTelemetry to Grafana Cloud, while structured production events are delivered to Loki.
The investigation agent uses Gemini 2.5 Flash on Vertex AI with Google ADK.
Instead of giving Gemini fabricated telemetry in its prompt, we integrated the official Grafana MCP server. The agent autonomously queries Grafana Cloud Prometheus and Loki during an investigation and correlates those independent signals before reaching a conclusion.
Remediation is deliberately separated from observability.
Grafana MCP is read-only, while the only mutation exposed to the agent is a narrow quarantine_worker capability protected by deterministic application policy.
The complete production loop is:
Observe → Investigate → Correlate → Decide → Guard → Act → Verify
And the core architectural principle is:
Gemini reasons. Policy authorizes. The pipeline acts. Grafana independently verifies.
Challenges we ran into
One of the most interesting challenges appeared during closed-loop verification.
After RenderGuard successfully quarantined the failing worker, the control API immediately reported zero active chunks — but Grafana still temporarily reported the previous value of two.
The agent correctly refused to declare the incident resolved.
The problem wasn't remediation. It was eventual consistency between control-plane state and exported observability state.
Instead of weakening verification or trusting the remediation response, we changed the agent to retry independent telemetry verification.
On the next observation cycle, Prometheus reported zero active chunks and Loki confirmed the quarantine event.
We also encountered a production integration issue when starting the official Grafana MCP server inside the ADK Cloud Run service. Cloud initialization and Grafana datasource discovery exceeded ADK's default MCP startup timeout.
We traced the runtime behavior and increased the MCP session startup allowance rather than bypassing MCP.
Both problems reinforced the same principle:
Production agent systems need to handle real infrastructure behavior, not just ideal demo paths.
Accomplishments that we're proud of
We're most proud that RenderGuard is not a scripted chatbot demonstration.
Gemini autonomously discovers and queries real Grafana Cloud telemetry through the official Grafana MCP integration.
Prometheus and Loki provide independent evidence for the investigation.
The remediation path is protected by deterministic policy rather than prompt instructions alone.
And most importantly, RenderGuard does not equate successful execution with successful recovery.
It independently verifies the outcome before closing the incident.
The entire workflow runs across deployed Google Cloud services and a live Grafana Cloud observability stack, with a public production control room.
What we learned
The biggest lesson was that reasoning and authorization are different responsibilities.
An AI model can be excellent at interpreting evidence and proposing an action without being the component that decides whether that action is permitted.
We also learned that closed-loop agents need to understand eventual consistency.
An API response, metrics backend, and log backend do not necessarily agree at the same instant.
Finally, MCP became much more meaningful to us than simply being a tool interface.
In RenderGuard it creates a clean operational boundary:
Pipeline → writes telemetry
Agent → reads telemetry through MCP
This gives the agent access to real operational evidence without giving the observability interface uncontrolled write authority.
What's next for RenderGuard
RenderGuard currently demonstrates the architecture using a deterministic GPU rendering environment and a controlled VRAM-exhaustion incident.
The next step would be connecting the same agentic control loop to real render schedulers and GPU infrastructure.
We would expand the deterministic policy engine and support additional production incidents such as:
- stalled render workers
- repeated chunk failures
- abnormal render latency
- GPU capacity pressure
- multi-worker degradation
We would also introduce stronger production identity boundaries, approval workflows for higher-risk remediation, persistent incident history, and richer multi-worker recovery strategies.
The long-term idea is broader than automated remediation.
We want RenderGuard to explore what accountable autonomy can look like inside real media-production infrastructure.
Built With
- alloy
- artifact-registry
- cloud-build
- cloud-run
- docker
- fastapi
- gemini-2.5-flash
- google-agent-development-kit
- google-cloud
- grafana-cloud
- grafana-mcp
- loki
- next.js
- opentelimetry
- prometheus
- python
- react
- secret-manager
- typescript
- vertex-ai

Log in or sign up for Devpost to join the conversation.