-
-
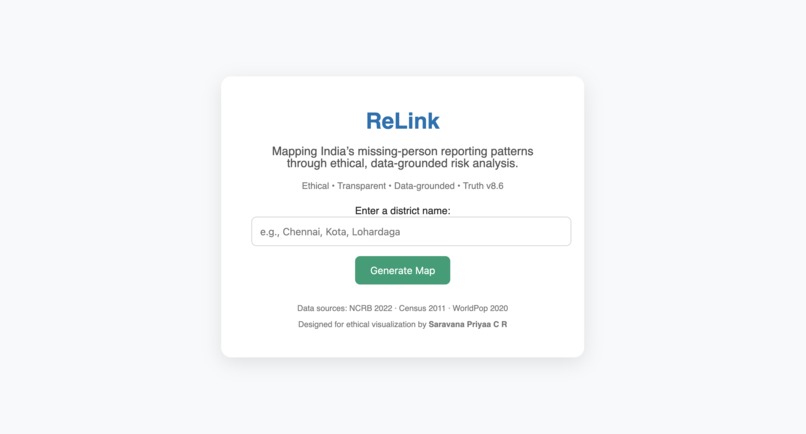
ReLink — Mapping truth through data. Ethical AI turning missing-person statistics into transparent, human insights.
-
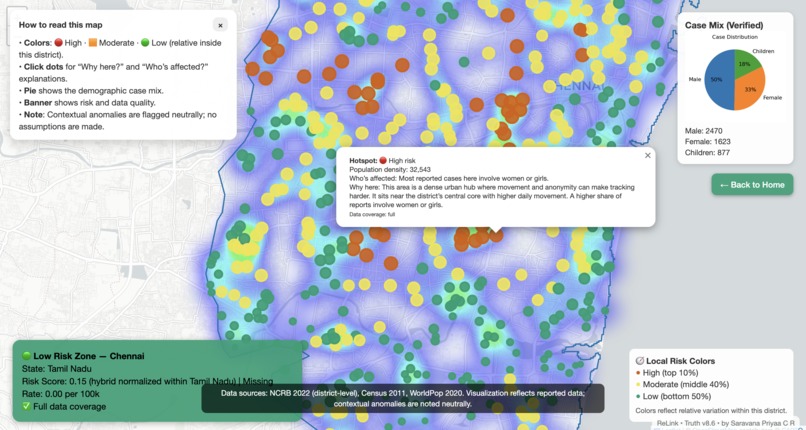
Low Risk Zone — Balanced awareness, strong recovery, and stable reporting. Data grounded, human centered.
-
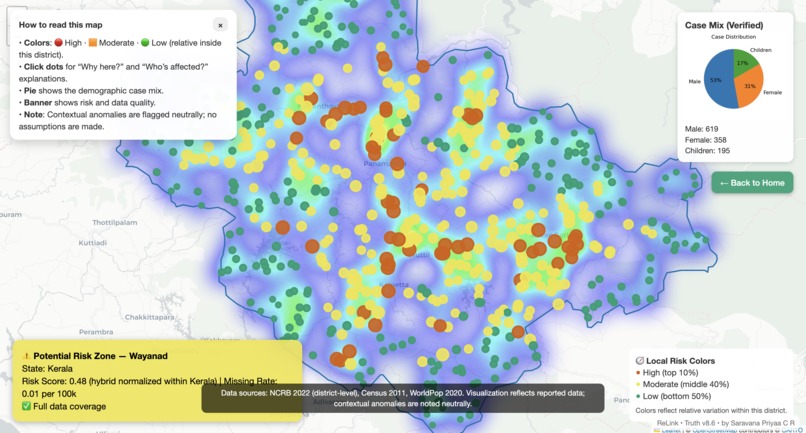
Moderate Risk Zone — Subtle patterns emerging. ReLink uncovers silent vulnerabilities beneath stable surfaces.
-
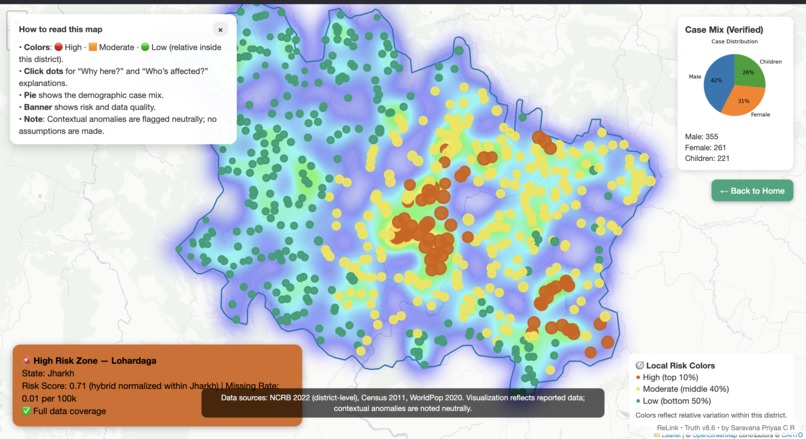
High Risk Zone — Clear data spikes, not alarm. ReLink reveals truth transparently, guiding awareness ethically.


ReLink — Ethical AI Mapping for Missing-Person Risk (Truth v8.6)
A transparent, population-aware geospatial intelligence system for understanding missing-person patterns responsibly.
Inspiration
Missing-person data is available in many countries, but rarely in a form the public can understand. It is usually trapped in PDFs, spreadsheets, or fragmented reports with no geography, no context, and no way to interpret structural risk.
ReLink was created to bridge the gap between data and empathy. The goal was to show where vulnerabilities concentrate, why patterns appear, and how population and demographics influence missing-person reporting — without prediction, sensationalism, or harm.
What ReLink Does
ReLink transforms region-level missing-person statistics into an interactive, ethical AI map powered by geospatial analysis.
With a single region selection, it generates:
1. Ethical Hotspot Maps
Colorblind-safe heatmaps highlighting High / Moderate / Low risk areas within the district.
2. Hybrid, Fairness-Aware Risk Scoring
A custom normalization engine blending:
- 70% within-state/context normalization
- 30% national/global normalization
This prevents misleading spikes in small or low-population regions.
3. Human-Language Explanations
Each hotspot includes:
- “Why here?” (mobility, density, workforce composition)
- “Who’s affected?” (gender/age case mix)
- Notes on reporting consistency
All phrased neutrally and ethically.
4. Population-Density–Aware Sampling
Uses WorldPop raster data to understand whether a hotspot aligns with dense urban areas or structural factors.
5. Fail-Safe Rendering Logic
Fallback geometry sampling ensures that even small or coastal regions render correctly.
6. Demographic Case Mix Chart
A simple chart showing male/female/child proportions.
ReLink converts static datasets into interpretable, transparent public intelligence.
How It Works (Functionality Overview)
- User selects a district or region.
- System loads boundary geometry + tabular data.
- Raster engine samples 1000+ population-density points.
- Hybrid normalization computes fair scores.
- Folium generates the interactive heatmap.
- Renderer builds explanations, charts, banners, and anomaly notes.
- Map is exported as a temporary HTML file for display.
How to Run (Local Setup)
These are the exact commands to run ReLink locally:
git clone https://github.com/saravanapriyaa21/relink.git
cd relink
python3 -m venv relink-env
source relink-env/bin/activate     # macOS / Linux
pip install -r requirements.txt
cd relink_core
python app.py
Then open:
http://127.0.0.1:5000
How I Built It (Execution)
Data Sources
- NCRB 2022 (district-level missing-person counts)
- Census 2011 (literacy, workforce, gender ratios)
- WorldPop 2020 (1 km population density raster)
- District boundary GeoJSON
Processing Pipeline
- Unified tabular + raster + geo data
- Computed missing-person rates per 100k population
- Smoothed inconsistencies in partial-reporting districts
- Designed hybrid log-normalization for fairness
- Vectorized raster sampling for speed
- Built interactive maps using Folium + Matplotlib
Engineering Highlights
- Explainable AI engine generating neutral textual explanations
- Anomaly detector highlighting unexpected values responsibly
- Geometry fallback logic for coastal or irregular districts
- Colorblind-safe UI based on the Okabe–Ito palette
Challenges I Overcame
1. Merging Different Data Types
Census tables, raster layers, and GeoJSON shapes required custom alignment.
2. Raster Edge Failures
Micro-districts caused raster boundary errors, solved using bounding-box sampling and fallback modes.
3. Ethical Language Design
The system avoids blame, assumptions, or sensational wording, relying on strict narrative rules.
4. Performance Optimization
Vectorization, caching, and simplified geometry improved generation speed.
Accomplishments
- Built a stable, nationwide district-level mapping system
- Achieved zero-crash rendering even with incomplete geometries
- Developed human-friendly, ethical AI explanations
- Designed accessibility-friendly color schemes
- Integrated tabular, raster, and vector data into one pipeline
- Added data provenance, help sections, and contextual notes
What I Learned
- How to build interpretable, ethical geospatial AI
- How to integrate raster, vector, and demographic datasets
- The importance of narrative framing in sensitive datasets
- How to design robust fallback logic in geospatial systems
- That transparency is sometimes more impactful than complexity
What’s Next (Future Roadmap)
ReLink Edge (Mobile App)
A lightweight, offline-capable version using TensorFlow Lite.
Multi-Country Support
Extend the pipeline to any country with minimal adjustments.
Real-Time Dashboards
Use open-data APIs for periodic refresh.
Privacy-Preserving Techniques
Add differential-privacy-based aggregation.
Post-Disaster Adaptation
Visualize missing-person patterns during crises or displacement events.
Tech Stack
Python, GeoPandas, Rasterio, Folium (Leaflet.js), Matplotlib, Pandas, NumPy Hybrid log-normalization engine Explainable AI narrative system Okabe–Ito colorblind-safe visualization
Summary
ReLink (Truth v8.6) is an ethical, population-aware geospatial intelligence system that transforms missing-person data into clear, defensible hotspot maps. It does not predict individuals or assign blame. It reveals structural risk patterns responsibly, transparently, and compassionately.
Tagline
ReLink: Bringing transparency and empathy to missing-person data, anywhere in the world.

Log in or sign up for Devpost to join the conversation.