-
-
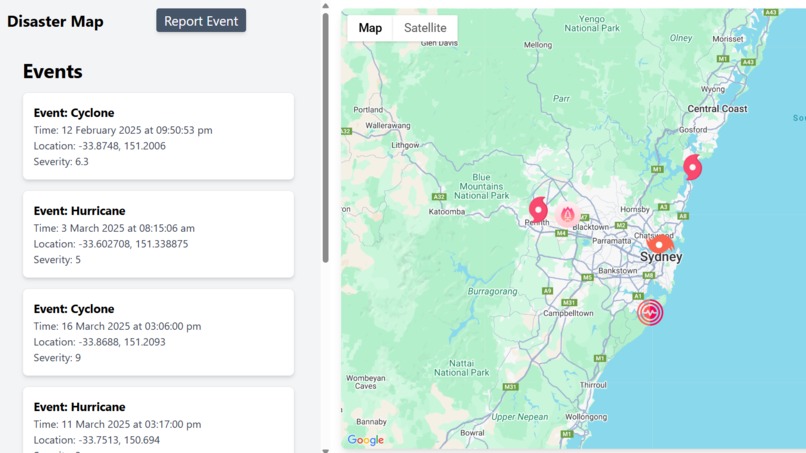
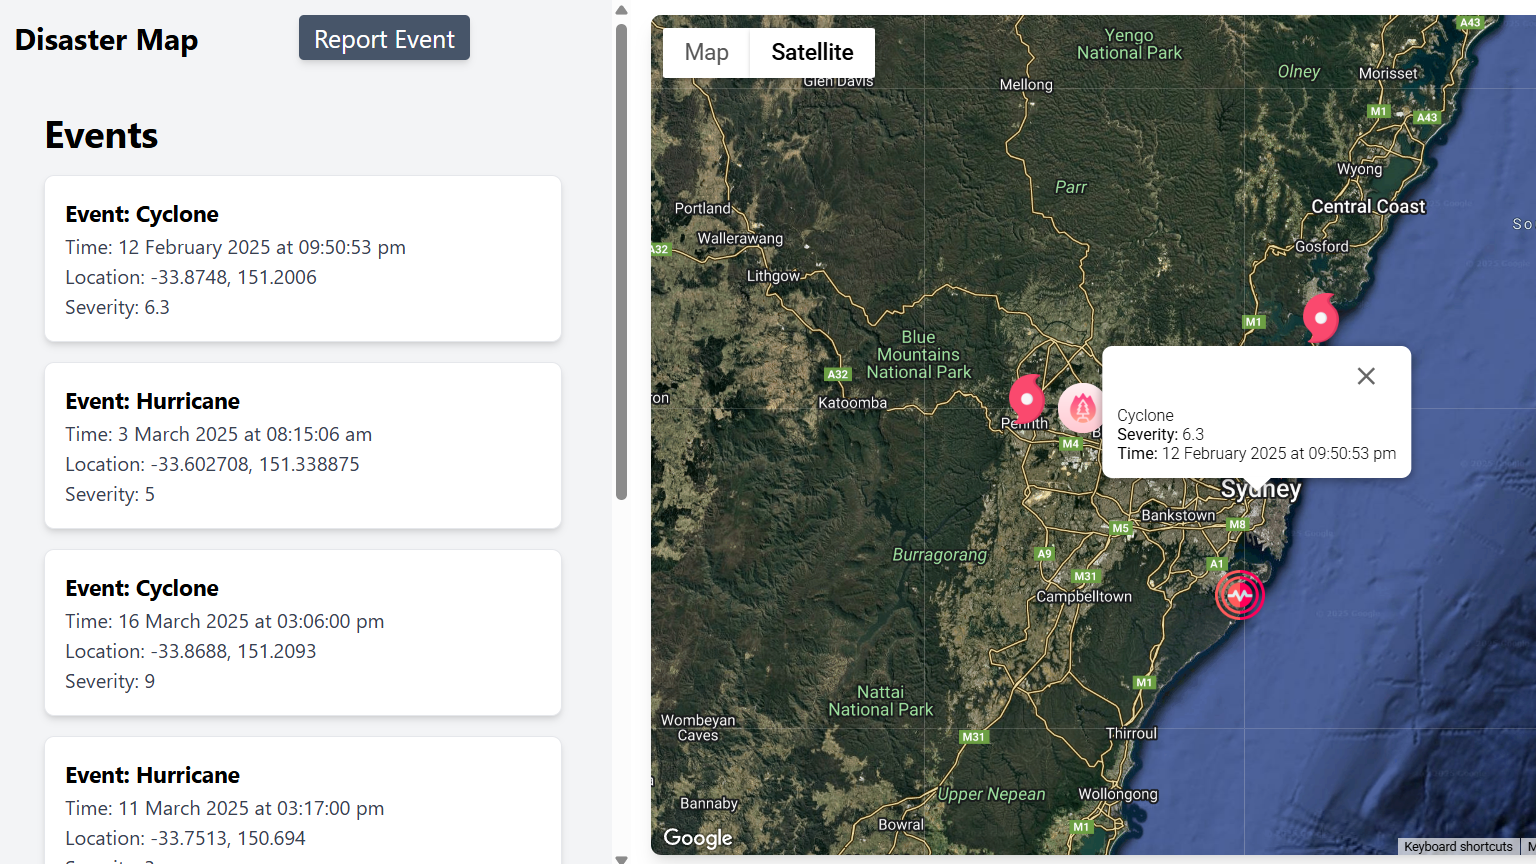
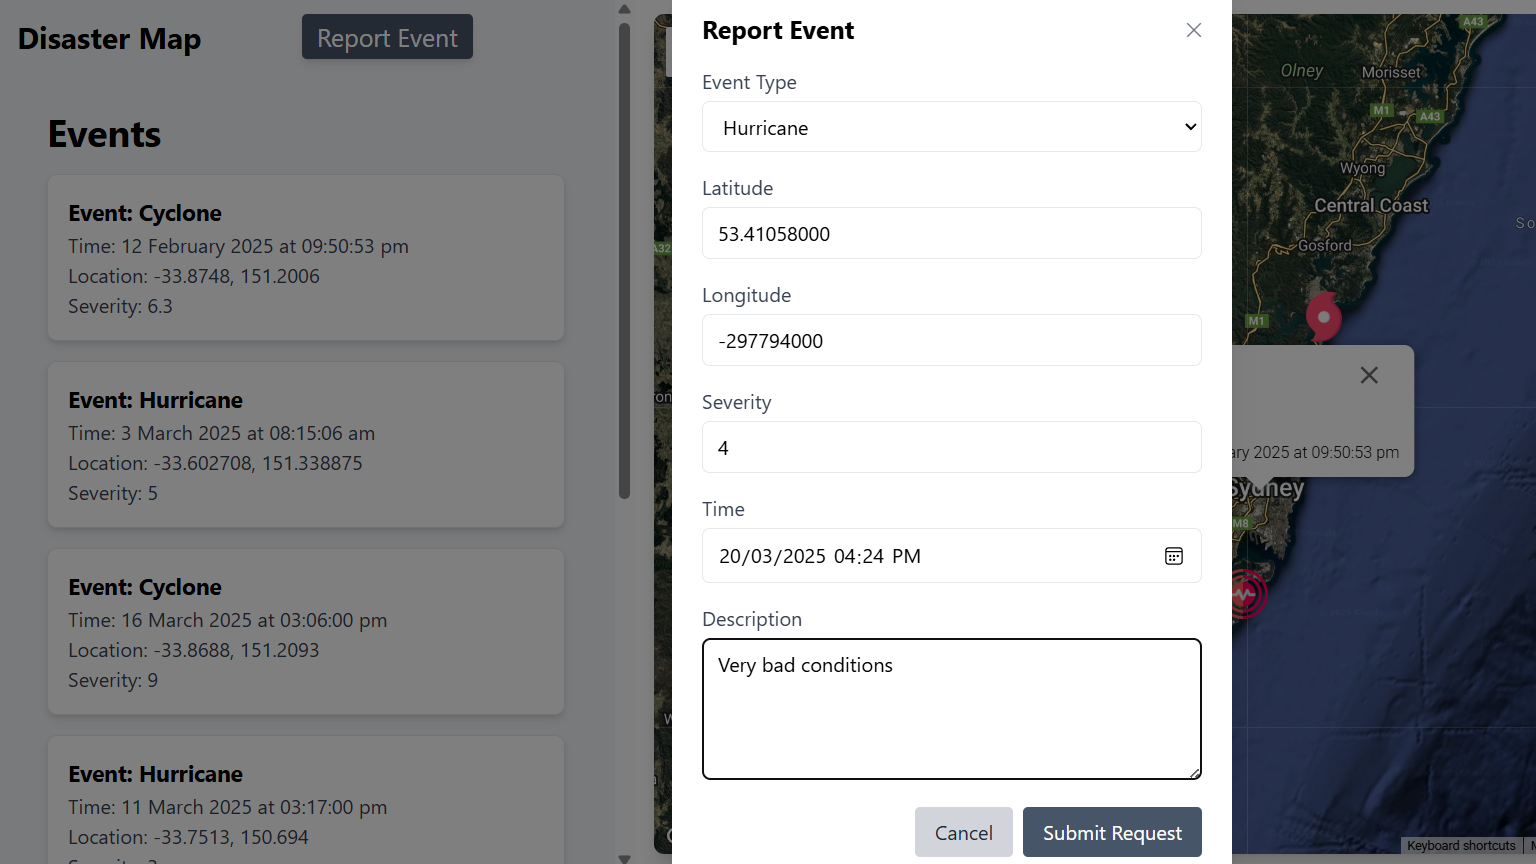
Map with disasters
-

Markers can be clicked to show information
-
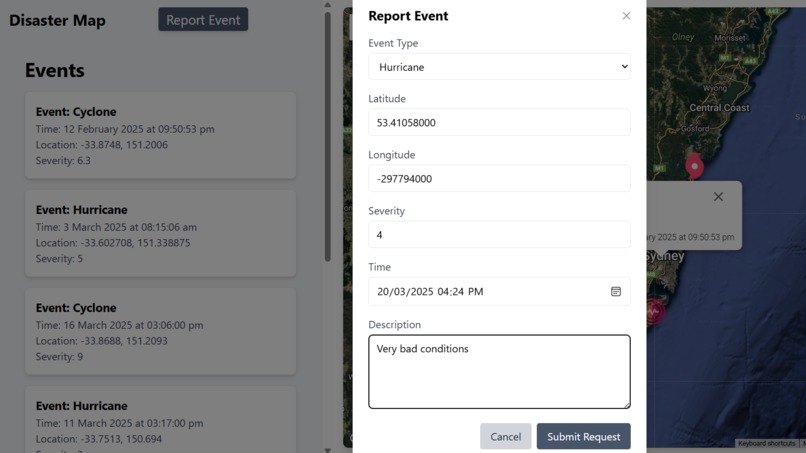
Can report a disaster to add to the map
-
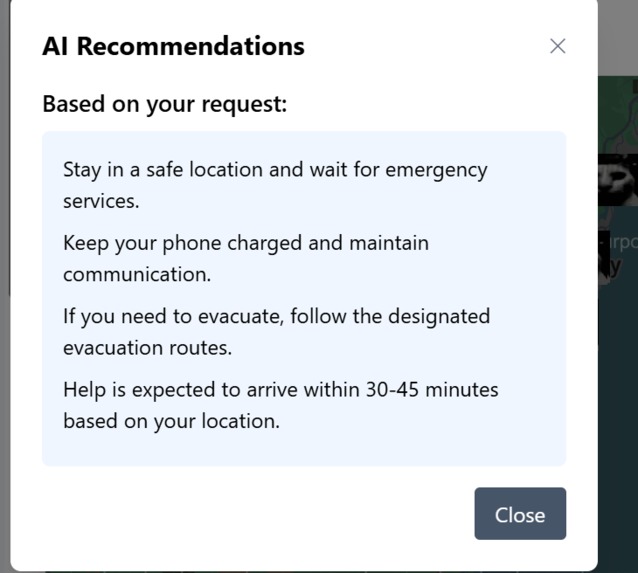
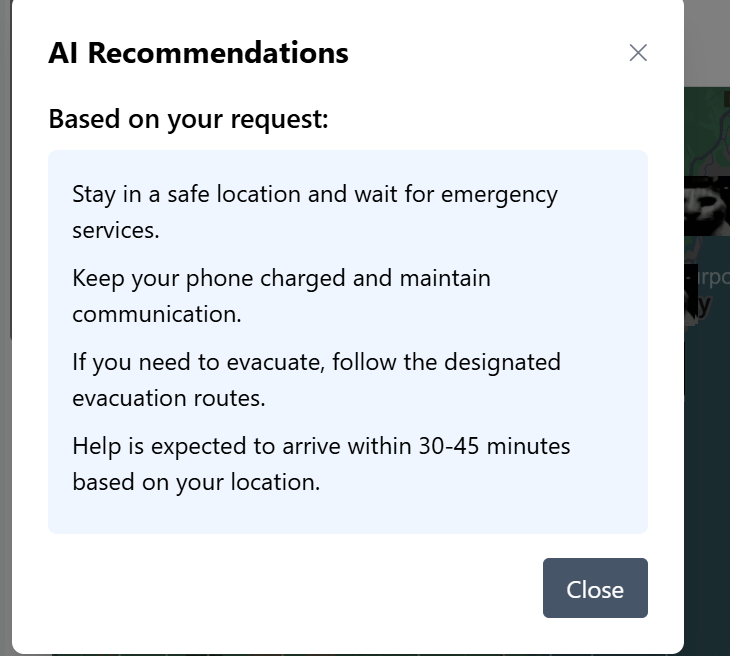
Using AI to provide users with helpful information (not actual AI just for demonstration)

Inspiration
Every year there are around 400 natural disasters happening worldwide from cyclones to earthquakes to bushfires which affect the lives of thousands of people. With information being available from different resources and platforms it can leave people ill-informed, underprepared or struggling to find help.
Our team wanted to address this by creating an online crowd disaster relief platform that allows users to access all the needed information on a disaster in one place, connect people to responders and allow users to mark weather incidents and disasters on the map.
What it does
Unlike other web apps that display alerts about disasters and extreme weather events, our web app allows users to interact with the map by marking incidents for others to see and avoid such as flooded roads, fallen trees, hail and other extreme weather events as soon as they happen.
- Features an interactive map that shows the disasters location and severity
- Allows users to upload/mark a weather incident on the map
- Contact information of responders and their status
- Information on how to prepare, avoid/minimise danger
- Information on where to get help and available shelters being set up
How we built it
This is our tech stack:
Frontend:
React using JavaScript with CSS for styling and google maps API to display the map.
Backend:
Firestore from Firebase google database which is cloud-based NoSQL database that is scalable and requires minimum backend implementation as it is document based and offers simple queries to fetch data.
APIs and services:
- Google maps API
- Firebase SDK
Challenges we ran into
Our main challenge we had was with authentication of users and how to verify what they marked on the map to be a true weather event as this is crowdsourced data and false reports will mislead others. To ensure accurate reports they would need to be cross-checked with other sources or verified by admin. To combat this requires much more development time and research. At this stage the markers added to the map are not being verified.
Accomplishments that we're proud of
The main accomplishment that makes us proud is the interactive map we have that not displays the events but also allows users to make reports and show them on the map. Our UI design is also simple and clean allowing for easy navigation around the page. Having created a minimum viable product in less than two days is an achievement that could only be done through the different skills of our team from design to development and problem solving.
What we learned
Through this project we have learnt new skills such as implementing APIs through the use of google maps to integrate on our platform and displaying disaster locations. Along with Firestore we learnt how to use a cloud-based database to allow for real-time data to added and displayed on the map, making it interactive with users.
What's next for ReliefHub
As a minimum viable product there is still a long way for ReliefHub to become what it was originally designed to be. We need to implement users' verification and moderation of reports made by cross checking them and even allow users to upload pictures as part of the verification but also for other users to see as part of the real time updates.
In addition, we would like to integrate AI in order to allow us to generate useful information for users about each event they click on such nearest help available and how to avoid the danger. This will enhance the user experience as information can be generated for each report made without having users or admin to manually add them and will provide a seamless experience.
Built With
- firebase-sdk
- firestore
- google-maps
- javascript
- react

Log in or sign up for Devpost to join the conversation.