-
-
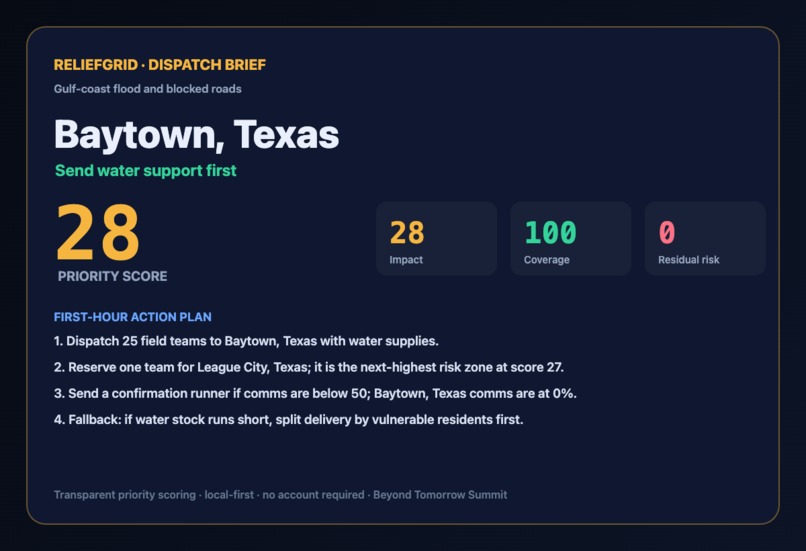
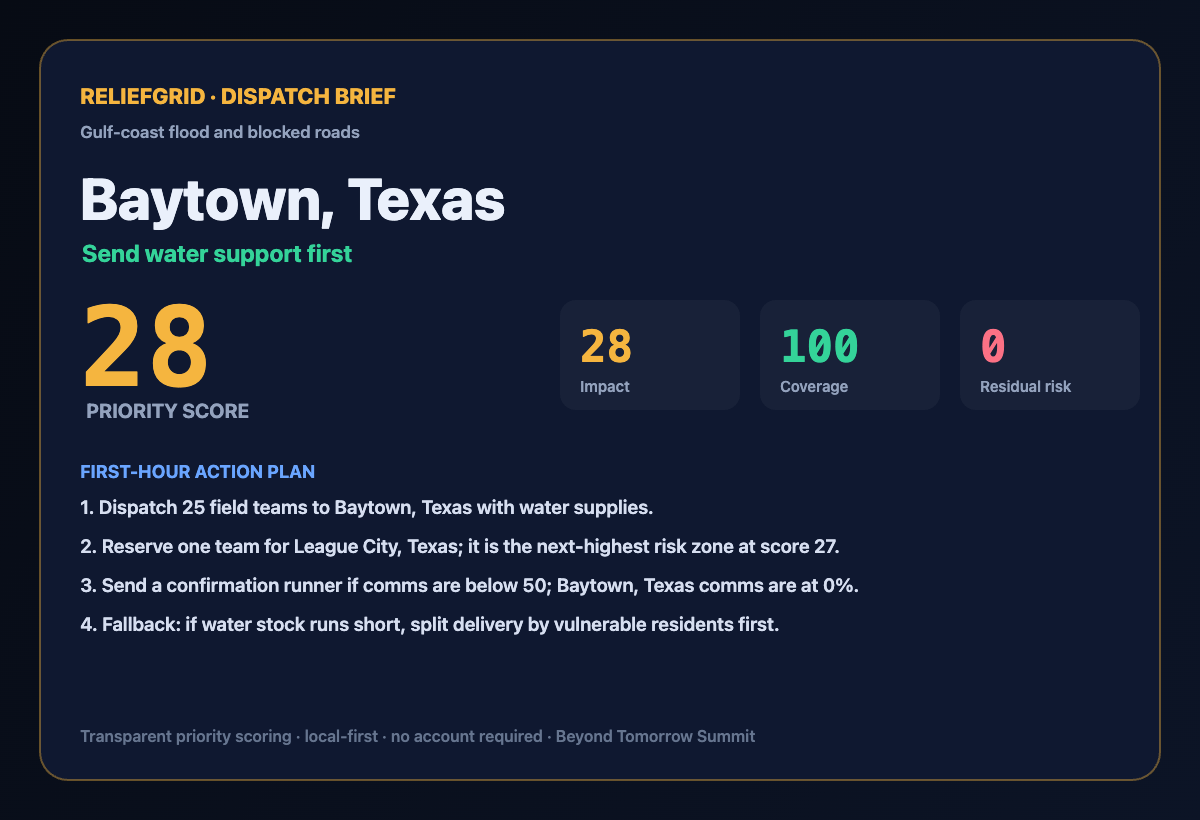
Dispatch brief: top zone, priority score, and a first-hour action plan, computed live from real Open-Meteo data.
Inspiration
Local emergencies rarely fail because nobody cares. They fail because the team has incomplete signals, scarce supplies, weak communications, and no shared sense of which neighborhood to help first. We wanted a tool that makes that first tradeoff explicit and defensible, grounded in real data instead of a hand-waved demo.
What it does
ReliefGrid helps local emergency teams decide where limited supplies should go first. It turns crisis signals into a dispatch brief: the top response zone, why it is first, which supplies to send, a first-hour action plan, and a fallback if the plan slips.
Every response zone is a real place. Its coordinates, population, and travel distance are pulled live from the public Open-Meteo geocoding API, and a heat or flood severity signal is derived from live weather (apparent temperature or precipitation). Nothing is fabricated. The only operator-entered signals are the two with no public real-time feed (percent vulnerable residents and percent working comms), and the interface labels every field as live, derived, or operator-reported so the data provenance stays honest.
You can search and add any real location, adjust the operating window and resource pool, and watch the priority queue, response map, and three headline metrics (impact, coverage, residual risk) recompute on every change. Commit a dispatch to keep an auditable history, copy the brief, or export it as a PNG.
How we built it
ReliefGrid is a real full stack. The backend is a FastAPI service that computes the priority scoring server-side with a transparent, unit-tested rule (severity, vulnerable residents, exposure, comms reliability, resource fit, and travel friction, scaled by how tight the operating window is), exposed as a documented REST API at /docs. A SQLite database via SQLAlchemy 2.0 persists incidents, zones, and every committed dispatch as a timestamped audit trail. An Open-Meteo integration (httpx) geocodes real places, pulls live weather, and computes great-circle distances; demo scenarios seed from a cached real-data snapshot so the app always opens populated, and new locations are fetched live on demand. The frontend is a single-page app built with vanilla ES modules and the Canvas API. A Dockerfile and Render blueprint give one-click deploy, with a keep-alive workflow and a 29-check QA gate.
Challenges we ran into
Keeping the data honest was the hard part. There is no public real-time feed for supplies on hand, comms reliability, or percent vulnerable residents, so instead of inventing those we made them explicit operator inputs and labelled every field by provenance. We also hit a reliability issue on the free host: its disk is ephemeral, so a restart wiped the database and boot-time geocoding occasionally rate-limited, leaving incidents with no zones. We fixed it by seeding from a committed real-data snapshot and auto-reseeding whenever zones go missing, so a wiped instance repairs itself.
Accomplishments that we're proud of
Real data, not dummy data: live geocoding and weather for every zone, with transparent provenance on every field. A genuinely inspectable scoring rule instead of a black box. A real backend and database with persistence and an audit trail, not a single-screen toy. And a self-healing deployment that always comes up populated.
What we learned
We learned how much credibility comes from being honest about data: clearly separating what is measured, what is derived, and what a human reports makes the tool more trustworthy than pretending everything is automatic. We also learned to design seeding and deployment for failure (ephemeral disks, rate limits) so the live demo stays reliable.
What's next for ReliefGrid
Multi-team hosted coordination, real river-discharge flood modelling, optional integrations for live shelter and clinic capacity, and shareable dispatch links so a whole response team works from the same priority order.
Built With
- canvas
- css
- docker
- fastapi
- html
- httpx
- javascript
- open-meteo
- pydantic
- python
- sqlalchemy
- sqlite
- uvicorn

Log in or sign up for Devpost to join the conversation.