Inspiration
What it does
How we built it
Challenges we ran into
Accomplishments that we're proud of
What we learned
What's next for ReliefGrid
Inspiration
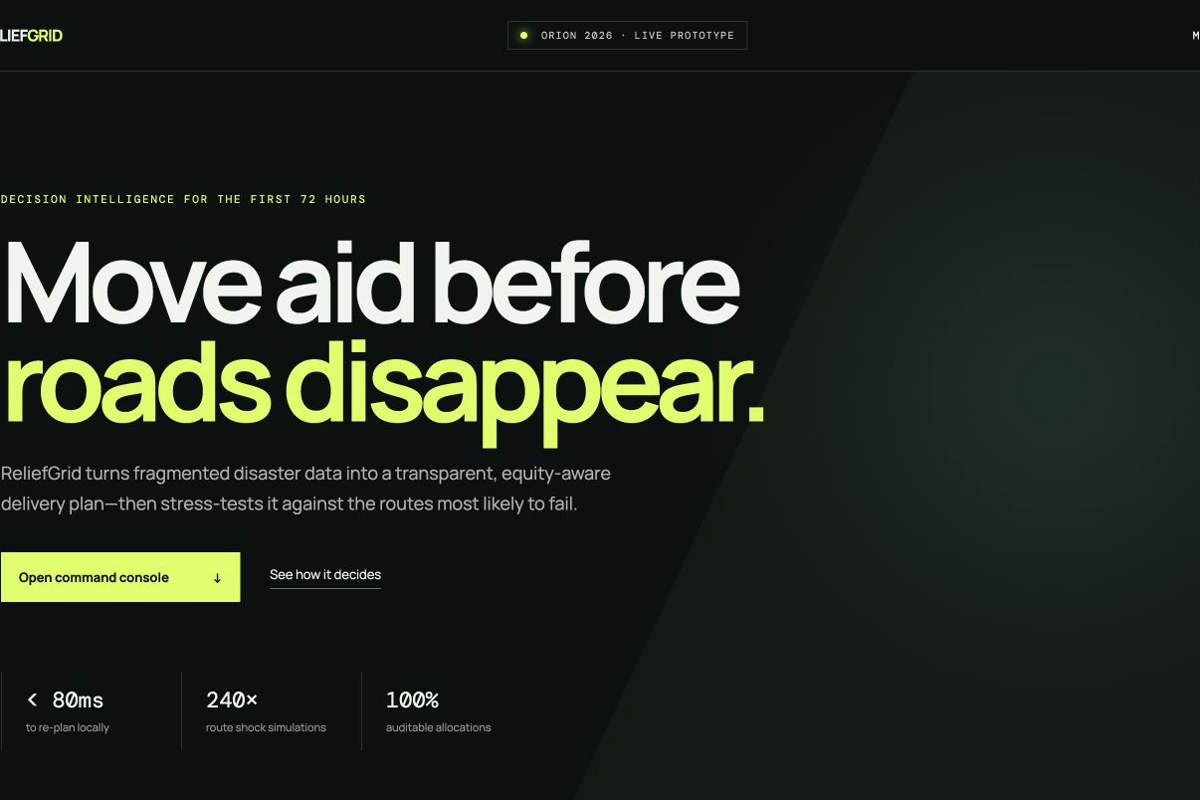
The first 72 hours of a disaster are an optimization problem with human consequences. A throughput-only plan can quietly sacrifice remote or vulnerable communities; a route plan that assumes every road remains open can collapse on contact with reality. ReliefGrid makes those assumptions visible and challengeable.
What it does
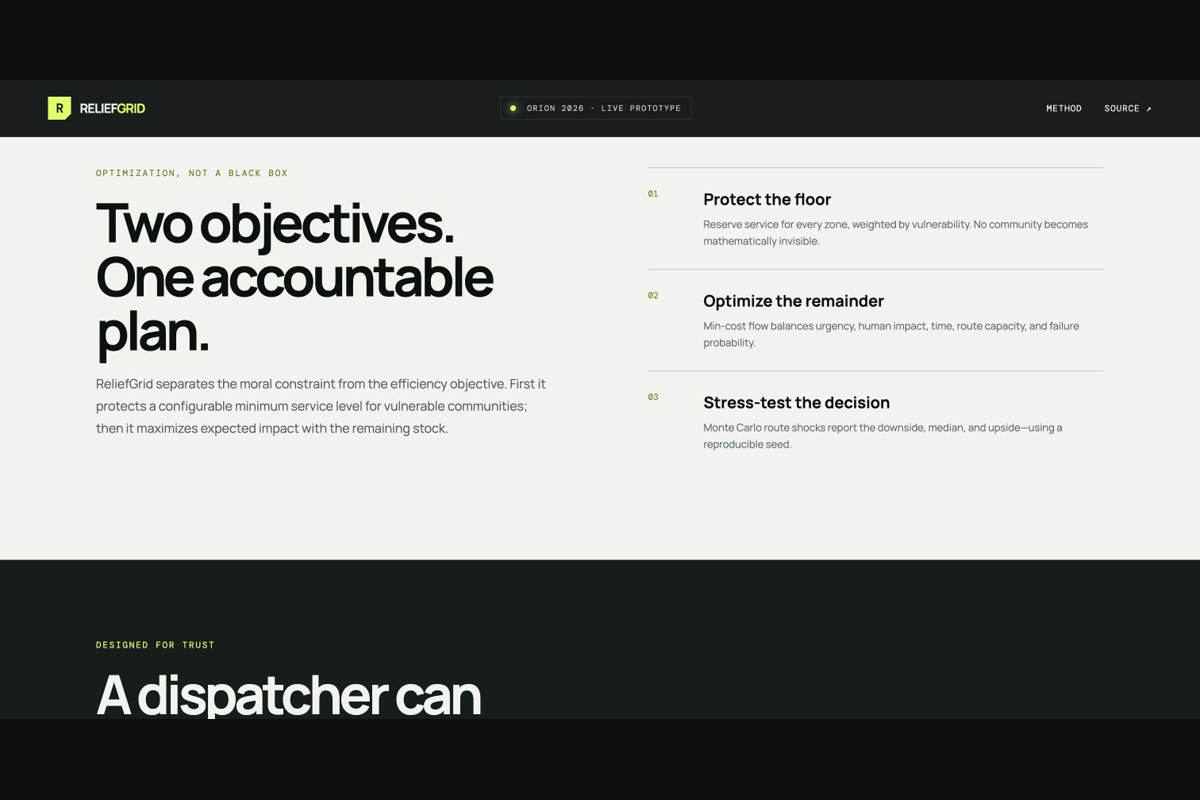
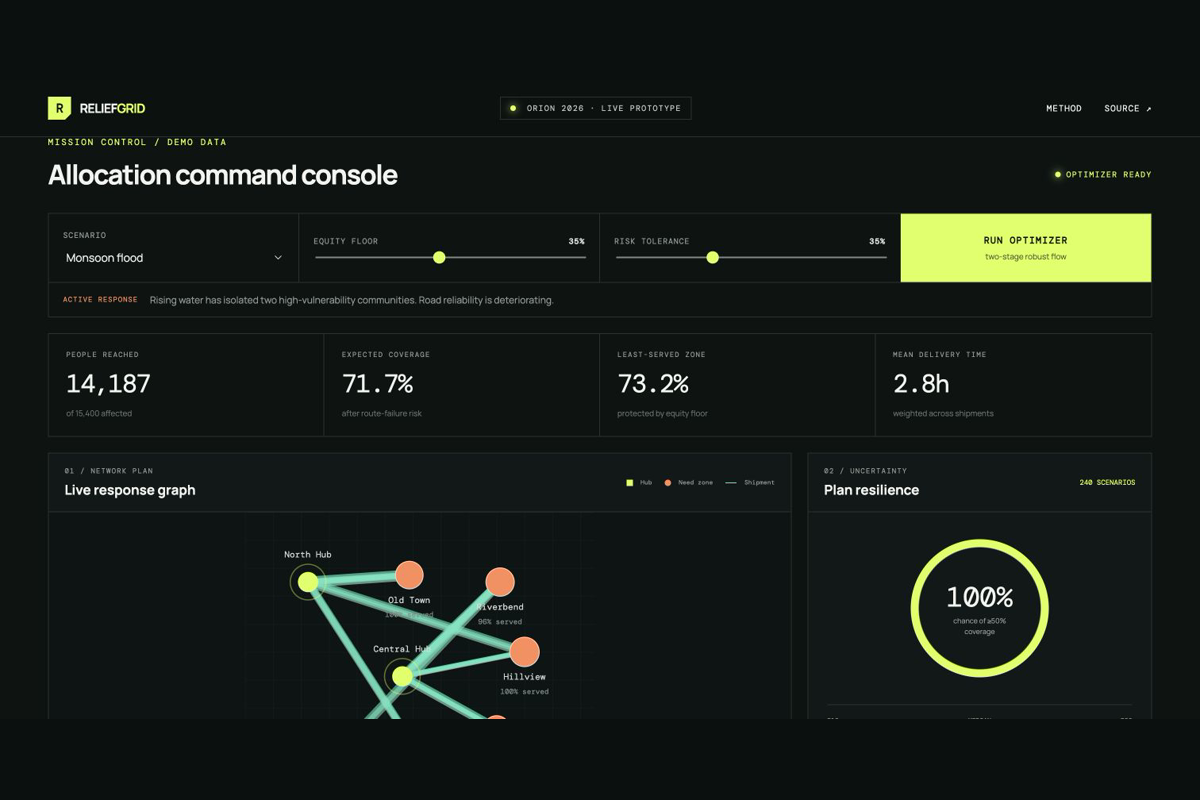
ReliefGrid allocates water, medical, and shelter kits from multiple depots to affected communities. The dispatcher chooses an explicit equity floor and route-risk tolerance. ReliefGrid first protects a minimum, vulnerability-weighted service target for every community, then uses min-cost flow to maximize expected human impact with the remaining inventory.
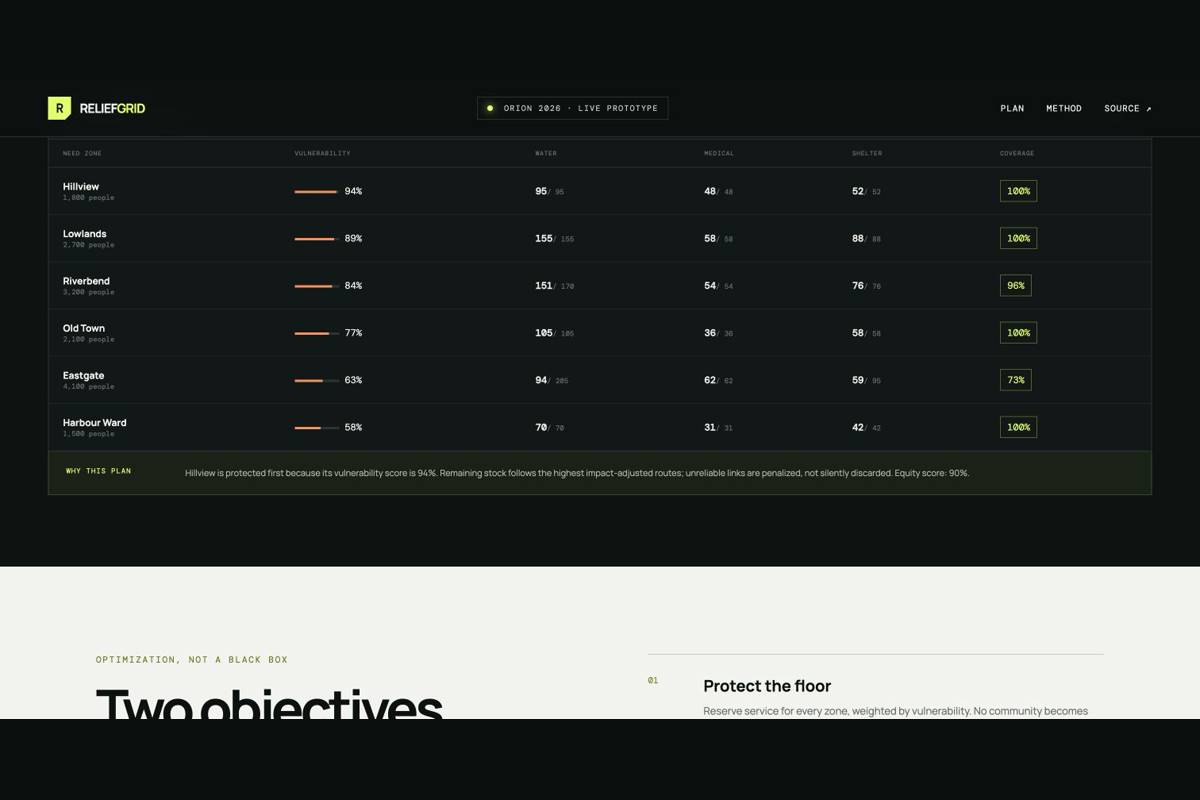
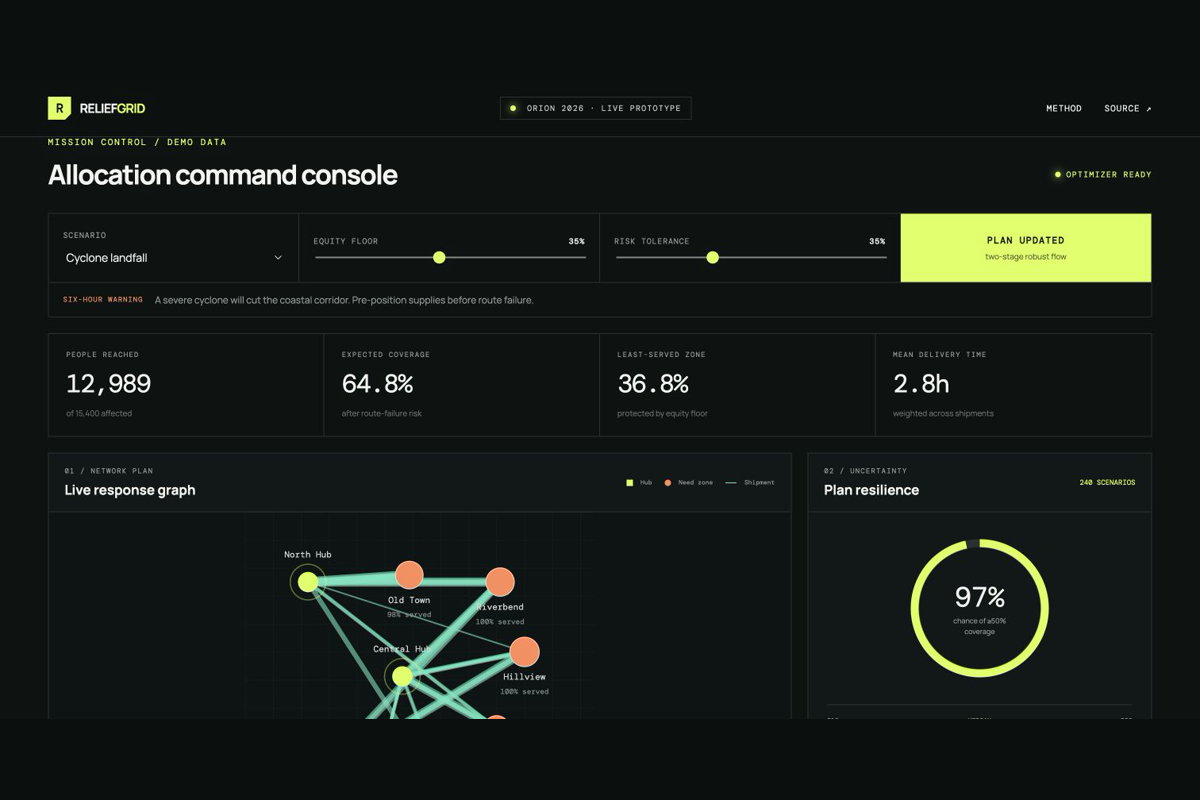
The command console shows the network plan, zone-by-zone deliveries, demand coverage, route reliability, mean delivery time, and the least-served community. It replays the complete plan across 240 reproducible route-disruption scenarios and reports P10, median, P90, and the probability of preserving at least 50% coverage.
How we built it
The browser-native engine constructs a source → depot → zone → sink network for every resource. Successive shortest augmenting paths, initialized with Bellman–Ford potentials, solve each constrained flow. Edge costs combine travel time, route reliability, urgency, vulnerability, and resource-specific impact. A lexicographic two-stage solve separates the equity constraint from the efficiency objective. A seeded Monte Carlo module stress-tests every selected route.
The interface is zero-dependency HTML, CSS, and JavaScript. It runs offline, needs no API key, collects no user data, exports plans as CSV, and includes automated constraint and reproducibility tests.
Challenges we ran into
The hard problem was keeping value judgments honest. Folding equity into one opaque score made it too easy for throughput to dominate, so we made equity a visible first-stage commitment. Negative benefit-adjusted edge costs also required a reduced-cost shortest-path implementation instead of a naive greedy allocator.
Accomplishments that we're proud of
- A real, capacity-constrained multi-resource optimizer that runs locally in milliseconds
- An explicit equity floor that prevents mathematically invisible communities
- Reproducible uncertainty analysis instead of a falsely precise optimal answer
- Automated tests for inventory, demand, boundedness, and determinism
- An accessible interface that lets non-specialists interrogate the plan
What we learned
Operations research is most useful when it exposes choices rather than laundering them into one score. Resilience is a distribution, not a single KPI: reporting downside and median performance changes the question from “is it optimal?” to “where could it fail?”
What's next
Next steps are CSV/GeoJSON ingestion, time-window and vehicle constraints, live road feeds, multi-period replenishment, responder accessibility testing, and an append-only decision log. ReliefGrid is decision support, not autonomous dispatch. This prototype uses synthetic data and makes no field-readiness claim.

Log in or sign up for Devpost to join the conversation.