
Inspiration
We want to empower voters by elucidating traditionally obscure sources of information and democratizing the access to this data. We built ReInform to help voters learn more about their congressmen, hold legislators accountable, and make politics more accessible to the disenfranchised.
What it does
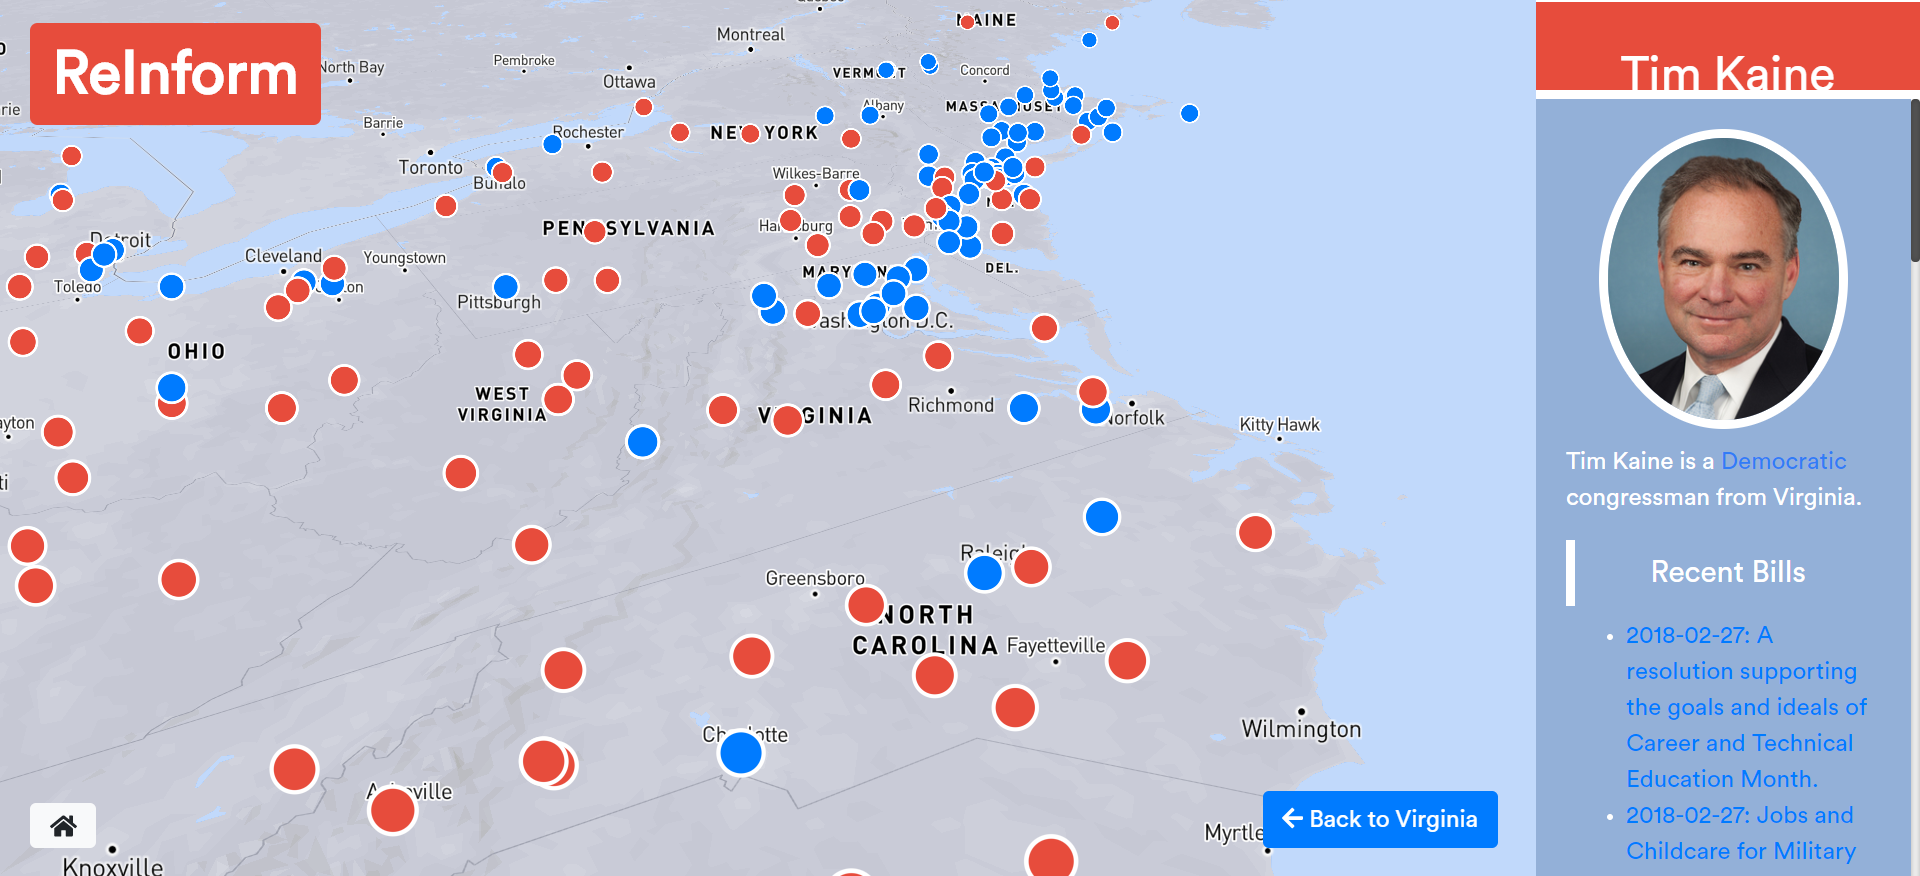
Our web app plots congressional representatives on a map in their respective districts all across the country. Users can travel from from state to state on the map to see how representatives are spread out in terms of location and party. Users can then click on the name or location of a representative to view information on their voting history, funding, and viewpoints. Users are also given each representative's contact information if they want to pursue further actionable steps.
How we built it
We used React and Mapbox on the frontend and Python Flask on the backend. We used APIs from various open government sources including Open Secrets, ProPublica, and more. We parsed through data from websites and extracted information to grab keywords and descriptions for congressmen and senators. We also programatically determined the legislative effectiveness of each representative by implementing a model developed by UVA's Center for Effective Lawmaking.
Challenges we ran into
We had issues getting all the data and connecting different APIs. Eventually, we came up with a solution to our API call cap-rate by scheduling regular data crawls and saving them to our server's local storage.
What's next for ReInform
We want to crowd source hot topics and make specific maps for certain issues. We also want to make this an educational tool for families and schools.


Log in or sign up for Devpost to join the conversation.