-
-
Logo design
-

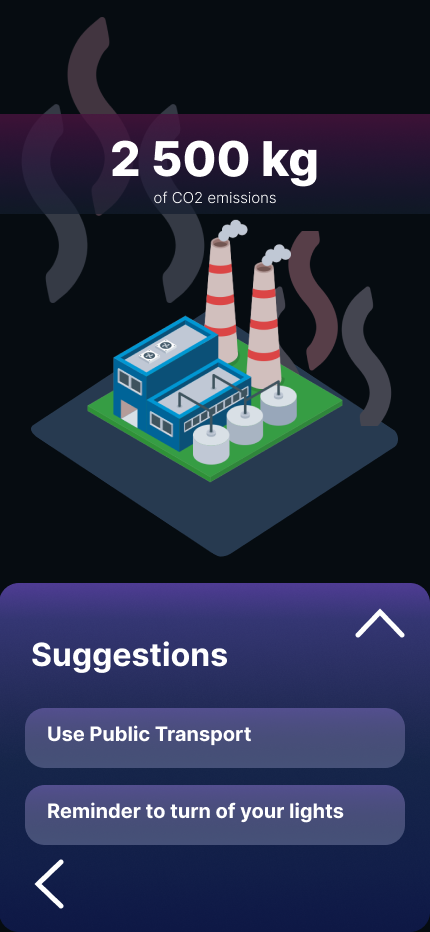
Overall report
-
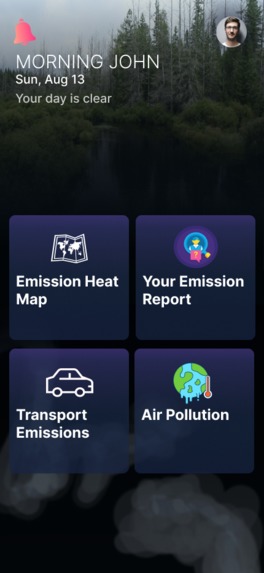
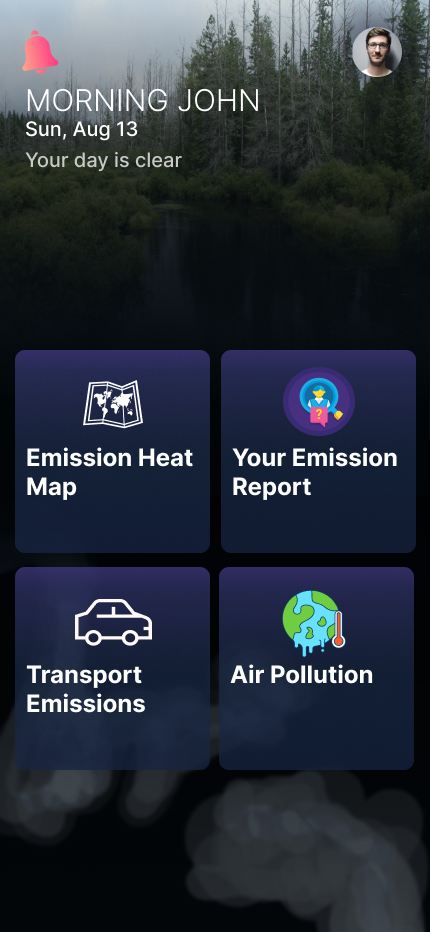
Main menu
-

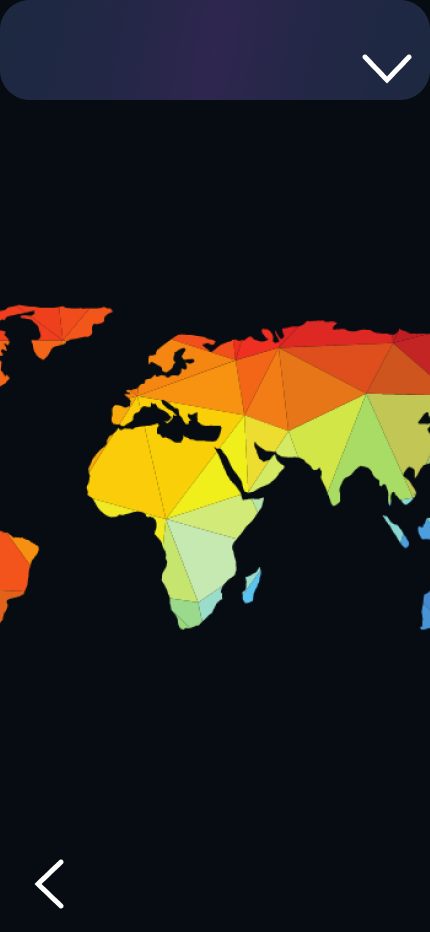
Emissions heat map
-
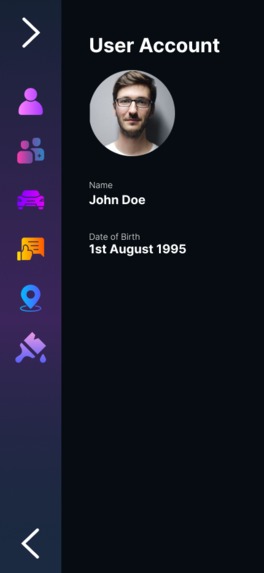
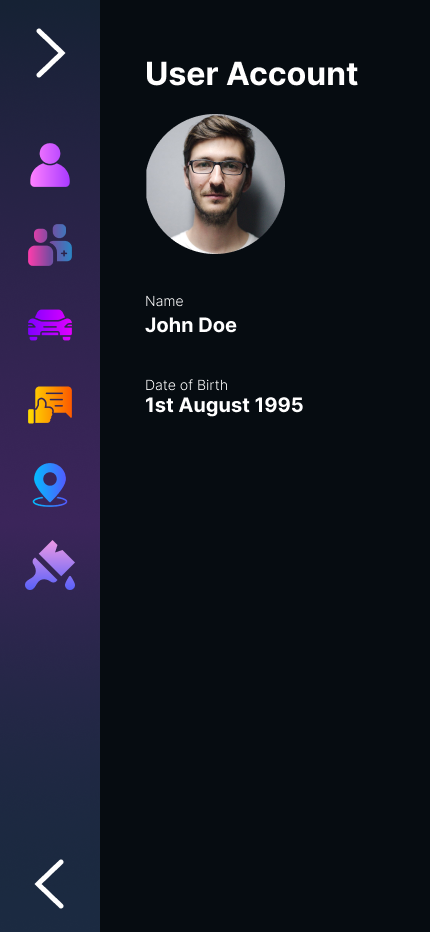
User settings
-

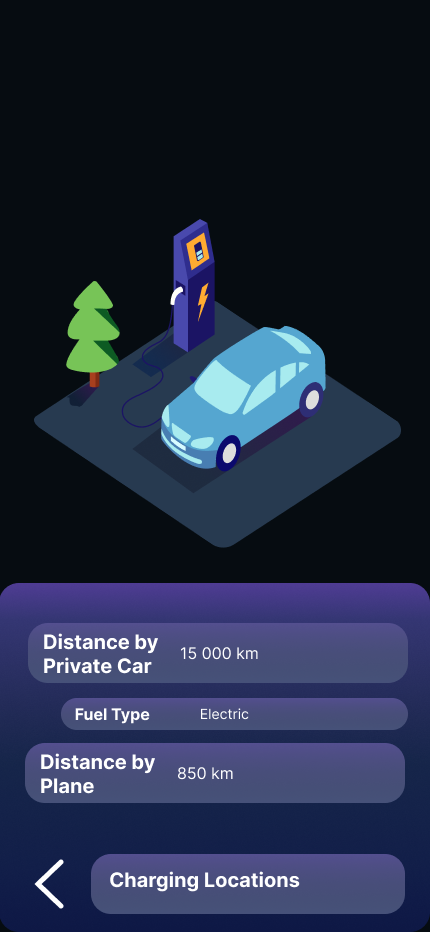
Transportation report

Inspiration
With the theme 'environmental sustainability' for this hackathon, we came back to our experiences to think about the ways we can impact people's daily lives most. Our team members all live in metropolitan cities, seeing the horrid conditions of traffic and pollution that seem to be unending. With the human population continually growing, this problem could only worsen.
This is when we came up with the idea that to solve this issue: it should be something that we can easily integrate into our lives but slowly direct us in to a more sustainable path passively. By making users aware of the various things they do and how even the littlest things can have an affect, we believe that this application could help with environment sustainability.
What it does
First of all, the main menu directs the user to the four main features of this application: emissions heat map, overall report, transportation report, and air pollution levels.
Before going into the functions of this application, the user must create an account and input vital information, including personal details, modes of transportation they use, types of fuel, electricity usage, location, and diet.
The emissions heat map has the purpose to visualize the emissions caused by the world, demonstrating the dire situation that we are in.
The overall report shows the total carbon footprint of the user for that year and gives suggestions on how they can improve. Furthermore, it gives an insight into the sources of their carbon emissions calculated from the details added when making an account.
As stated before, transportation accounts for 28% of carbon emissions according to the US EPA and up to 29.8% of household emissions according to PBS. The aim of this feature is to take in transportation routes of the user and find ways to optimize it, possibly integrating public transport to reduce footprint but the main idea is to demonstrate how much one individual can change the situation, simply by adjusting their lifestyle minimally.
Lastly, we added a air pollution monitoring page to inform users about the daily AQI rating around their area and toxic gas ppm in the atmosphere for their health.
How we built it
Our team initially came up with ideas for the features that would be available and began planning the layout of the UI. We used Google Docs to manage the project and organize our thoughts then began work using figma. We created frames for each of the features and made it interactive using the component in figma.
Challenges we ran into
Using new media - figma is a new application that no one on our team had experinece using so we had to sped a considerable of time learning the tools to create a UI
Time constraints - this hackathon was only 36 hours and due to the timezone difference, many of the events were hosted in awkward times. Since this is our first hackathon,
Accomplishments that we're proud of
Overcoming the challenges we have had and presevering through to create a final product.
What we learned
Prototyping and creating application graphics - Figma interface, tools, and creating UIs
Project management - methods to efficienty communicate and delegate tasks to members
What's next for Untitled
We are hoping to use this project as an experience for future hackathons and aim to improve on our short comings.
Built With
- canva
- figma
- google-docs
- google-slide

Log in or sign up for Devpost to join the conversation.