Inspiration
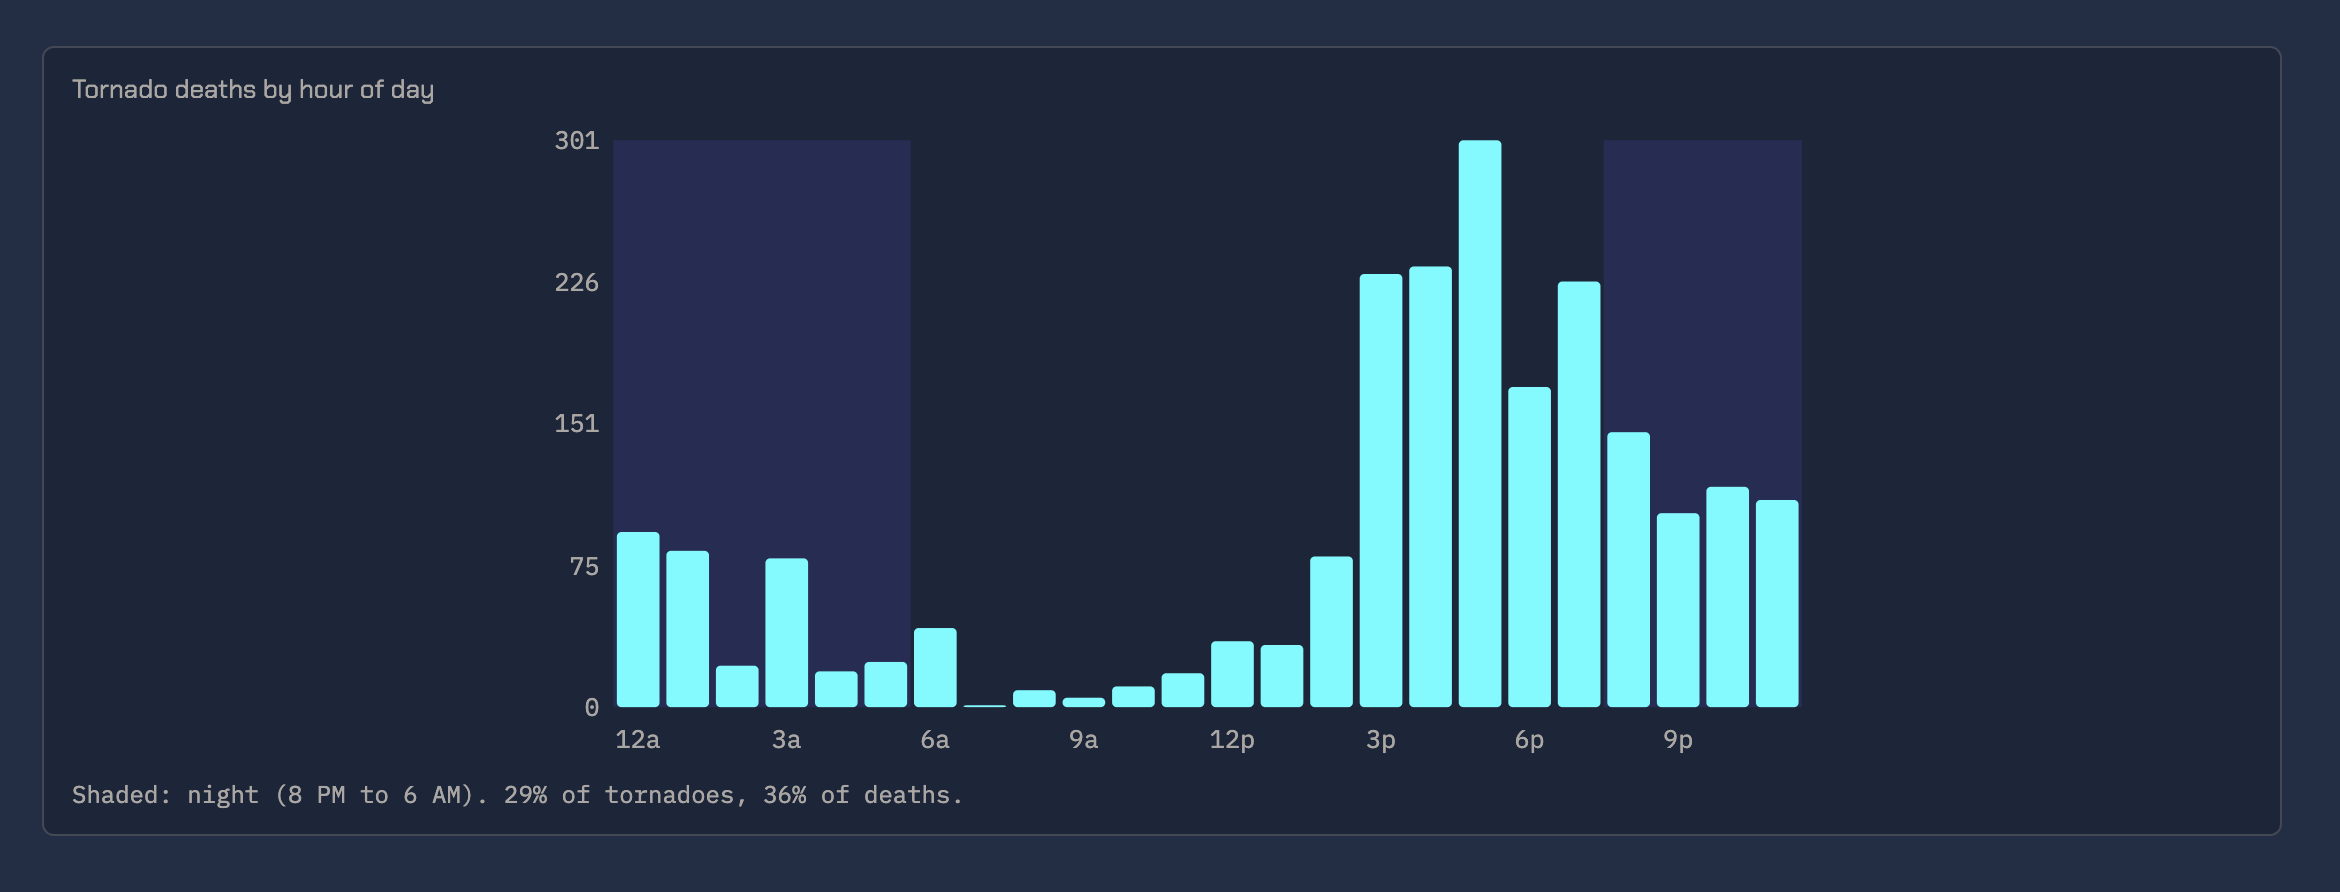
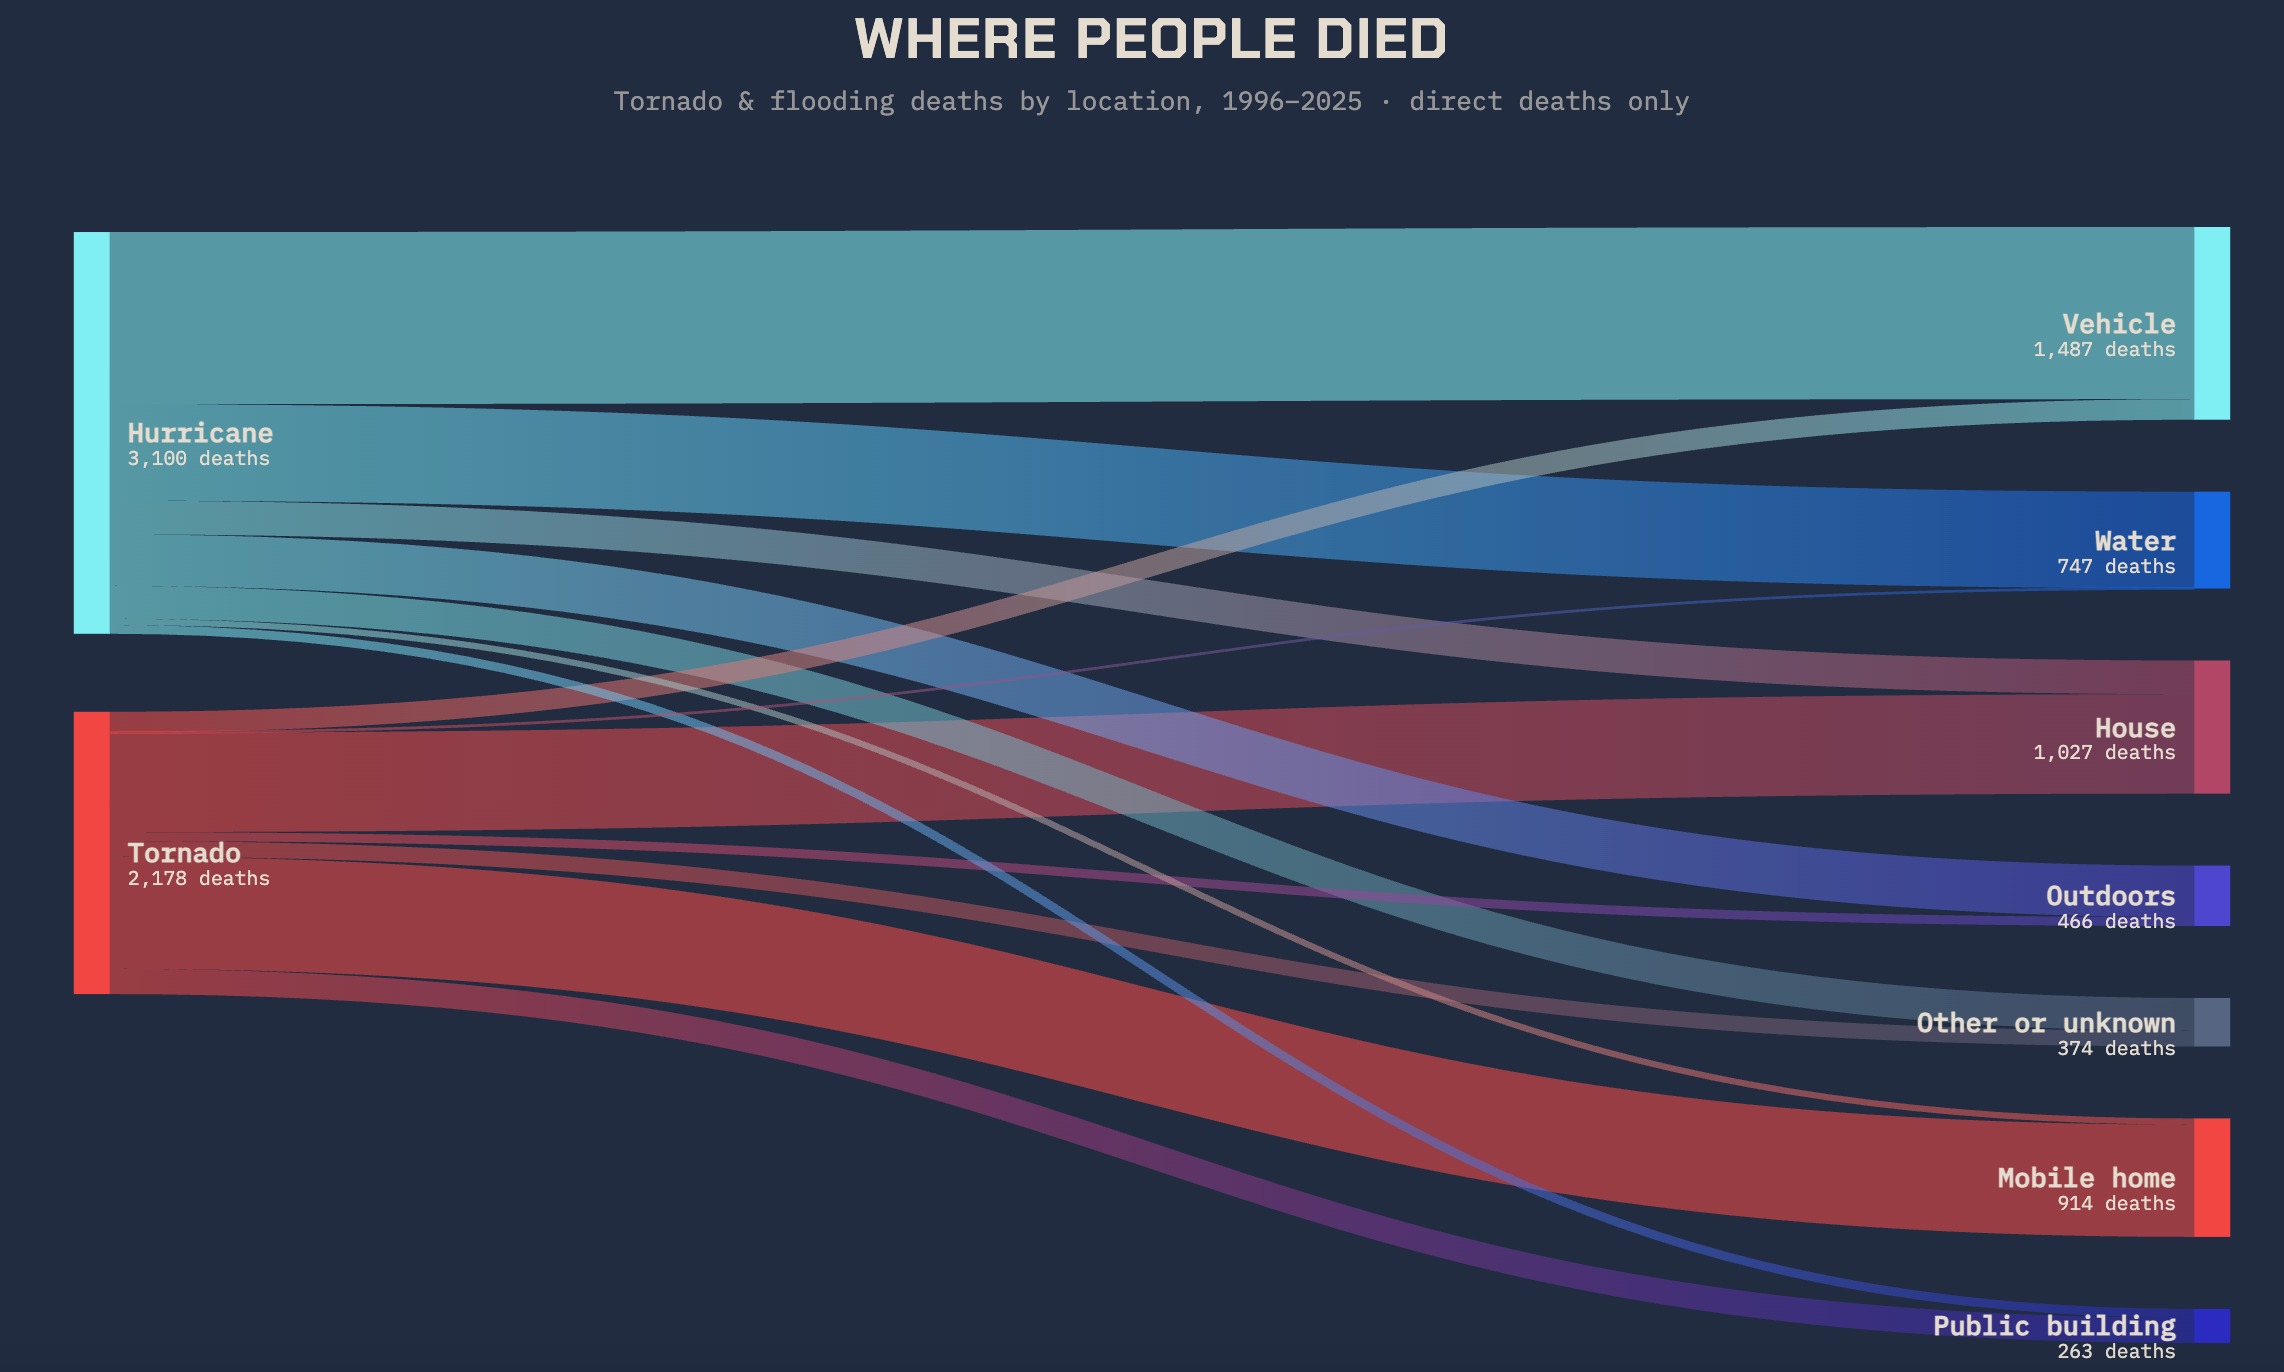
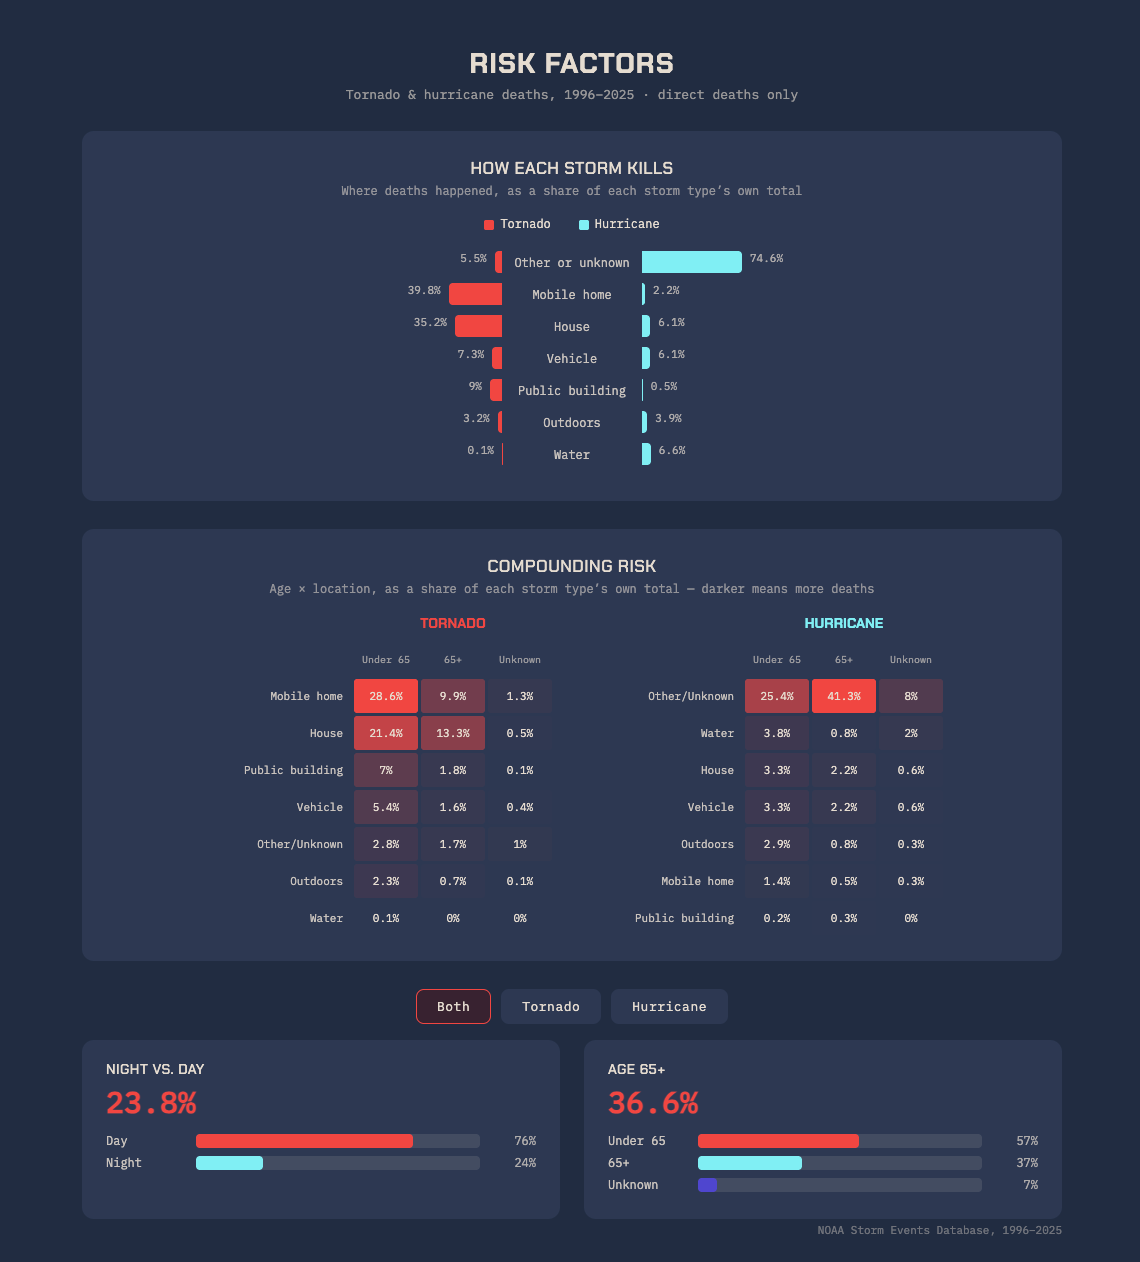
Storm deaths follow patterns. Mobile homes account for 42% of tornado deaths where the location is known (54% at night), and nearly half of flash-flood deaths happen in cars. Towns know where their mobile-home parks are, but they have no simple way to ask, "If a tornado hit tonight, who's at risk, and where should we spend our money?" We wanted to build that tool.
What it does
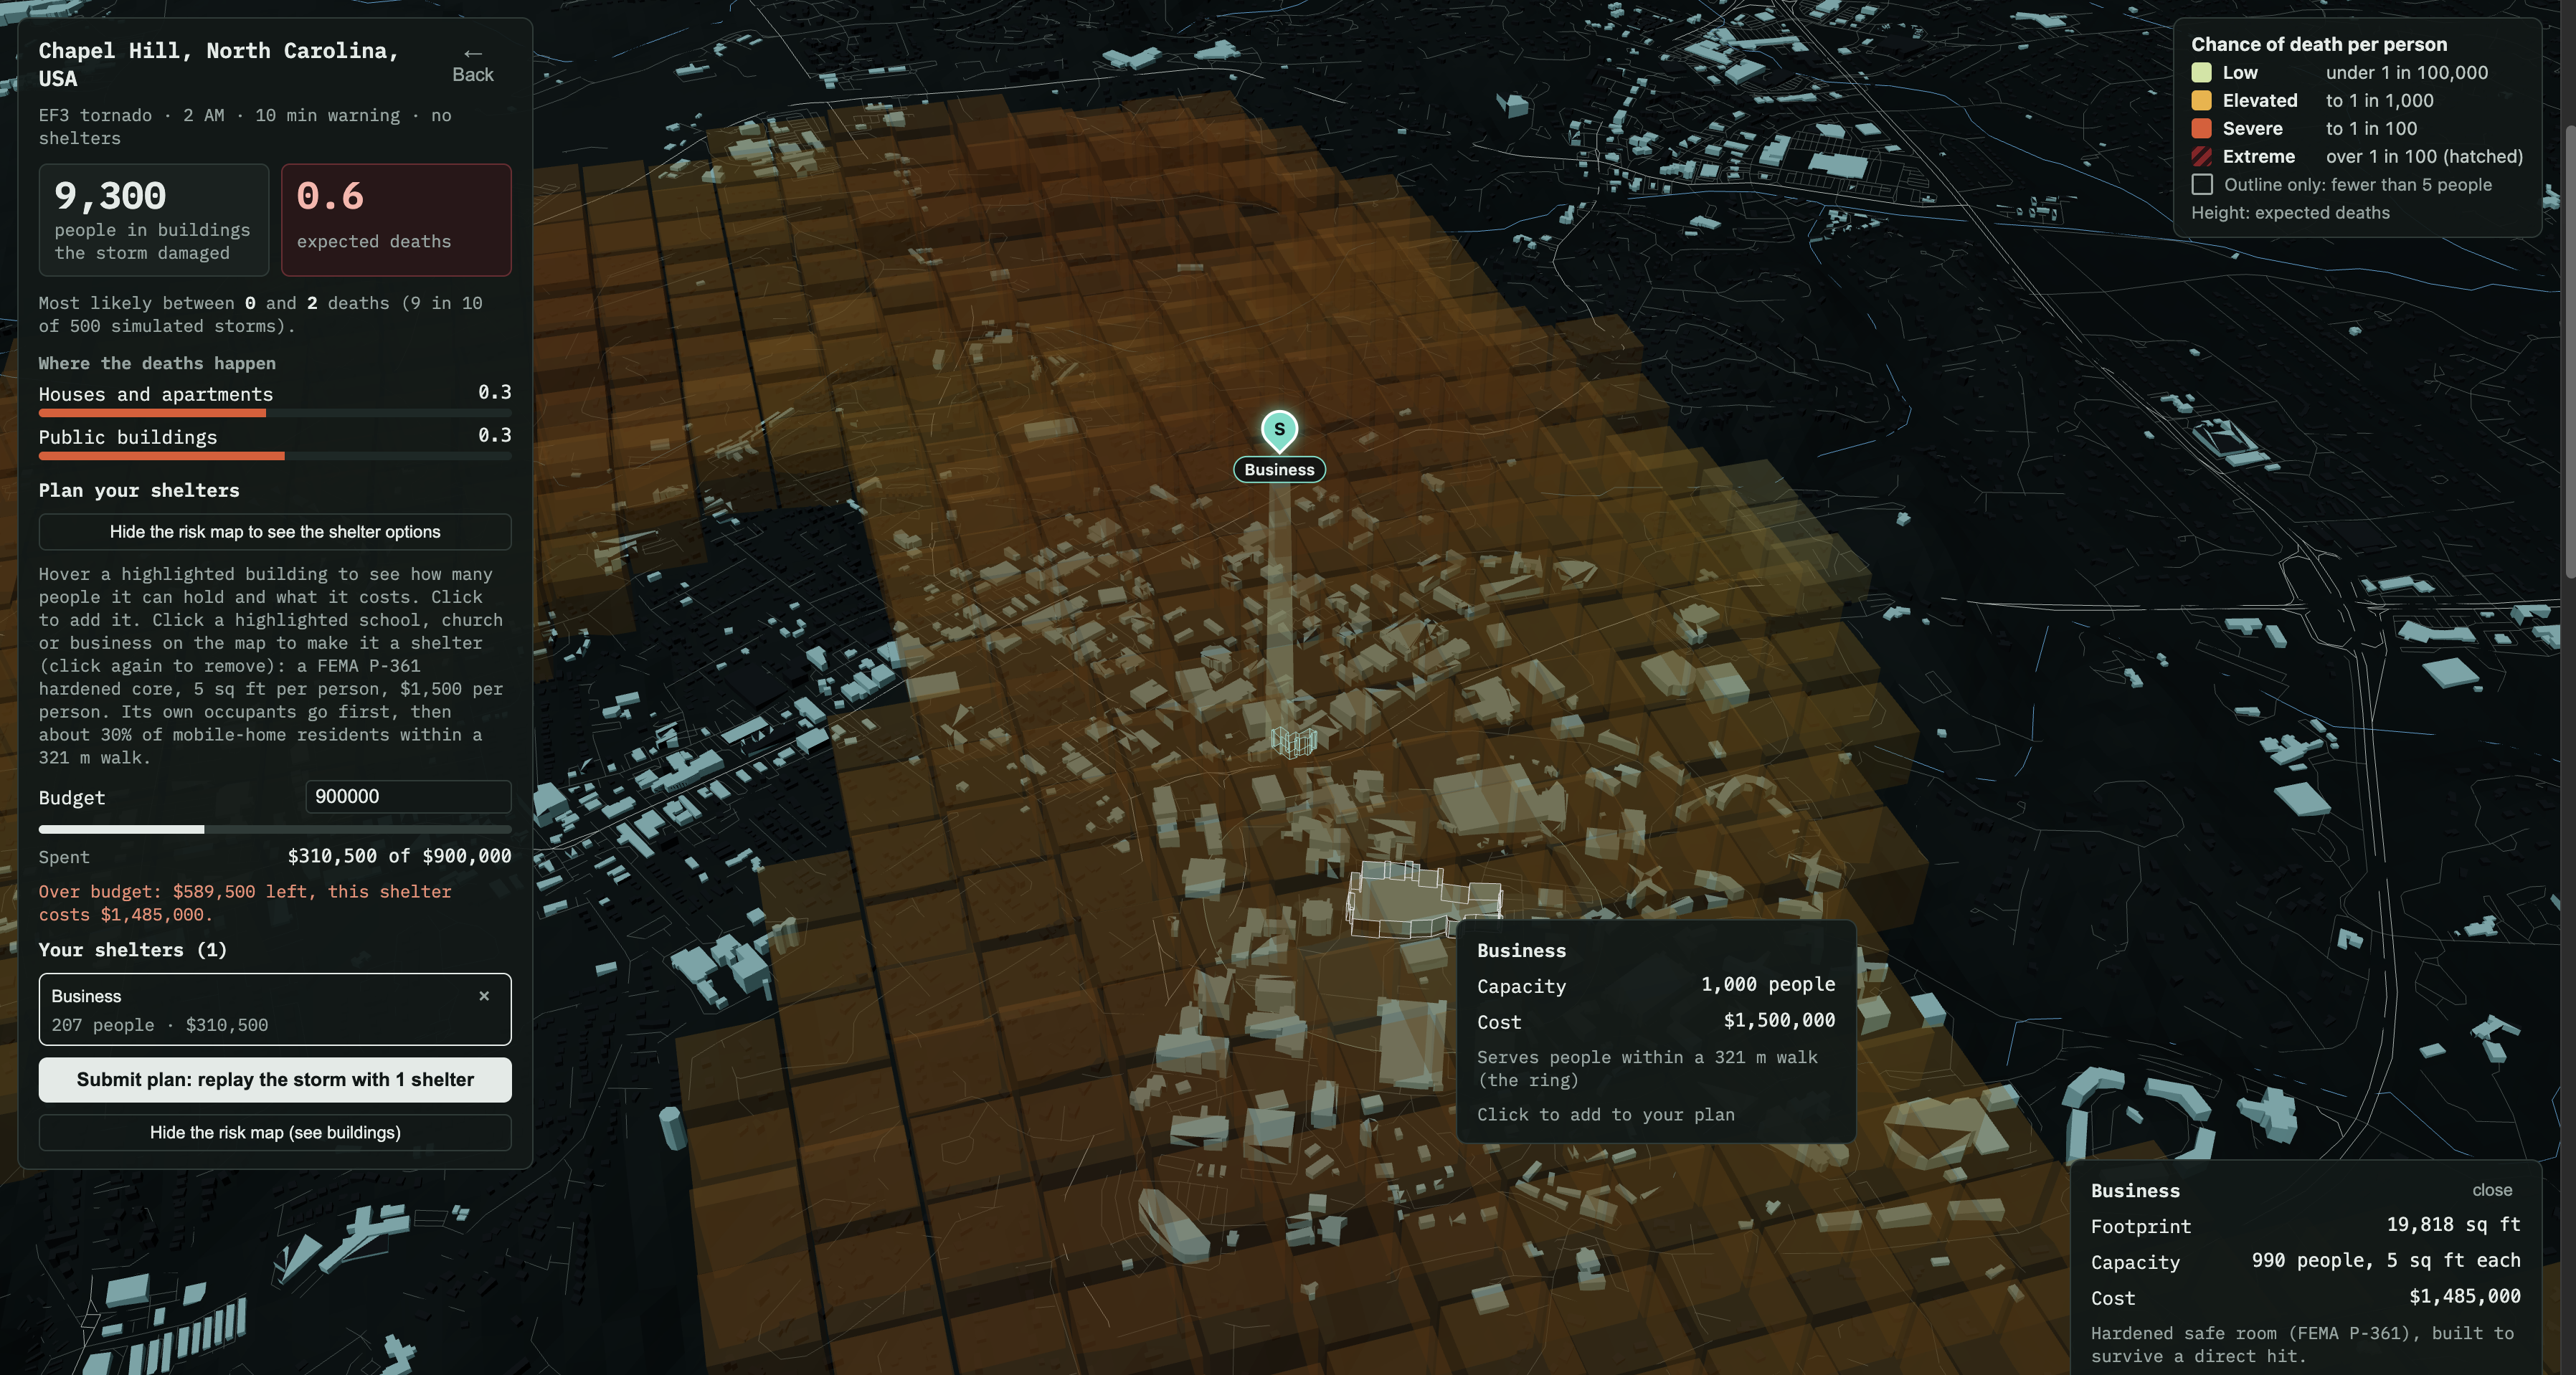
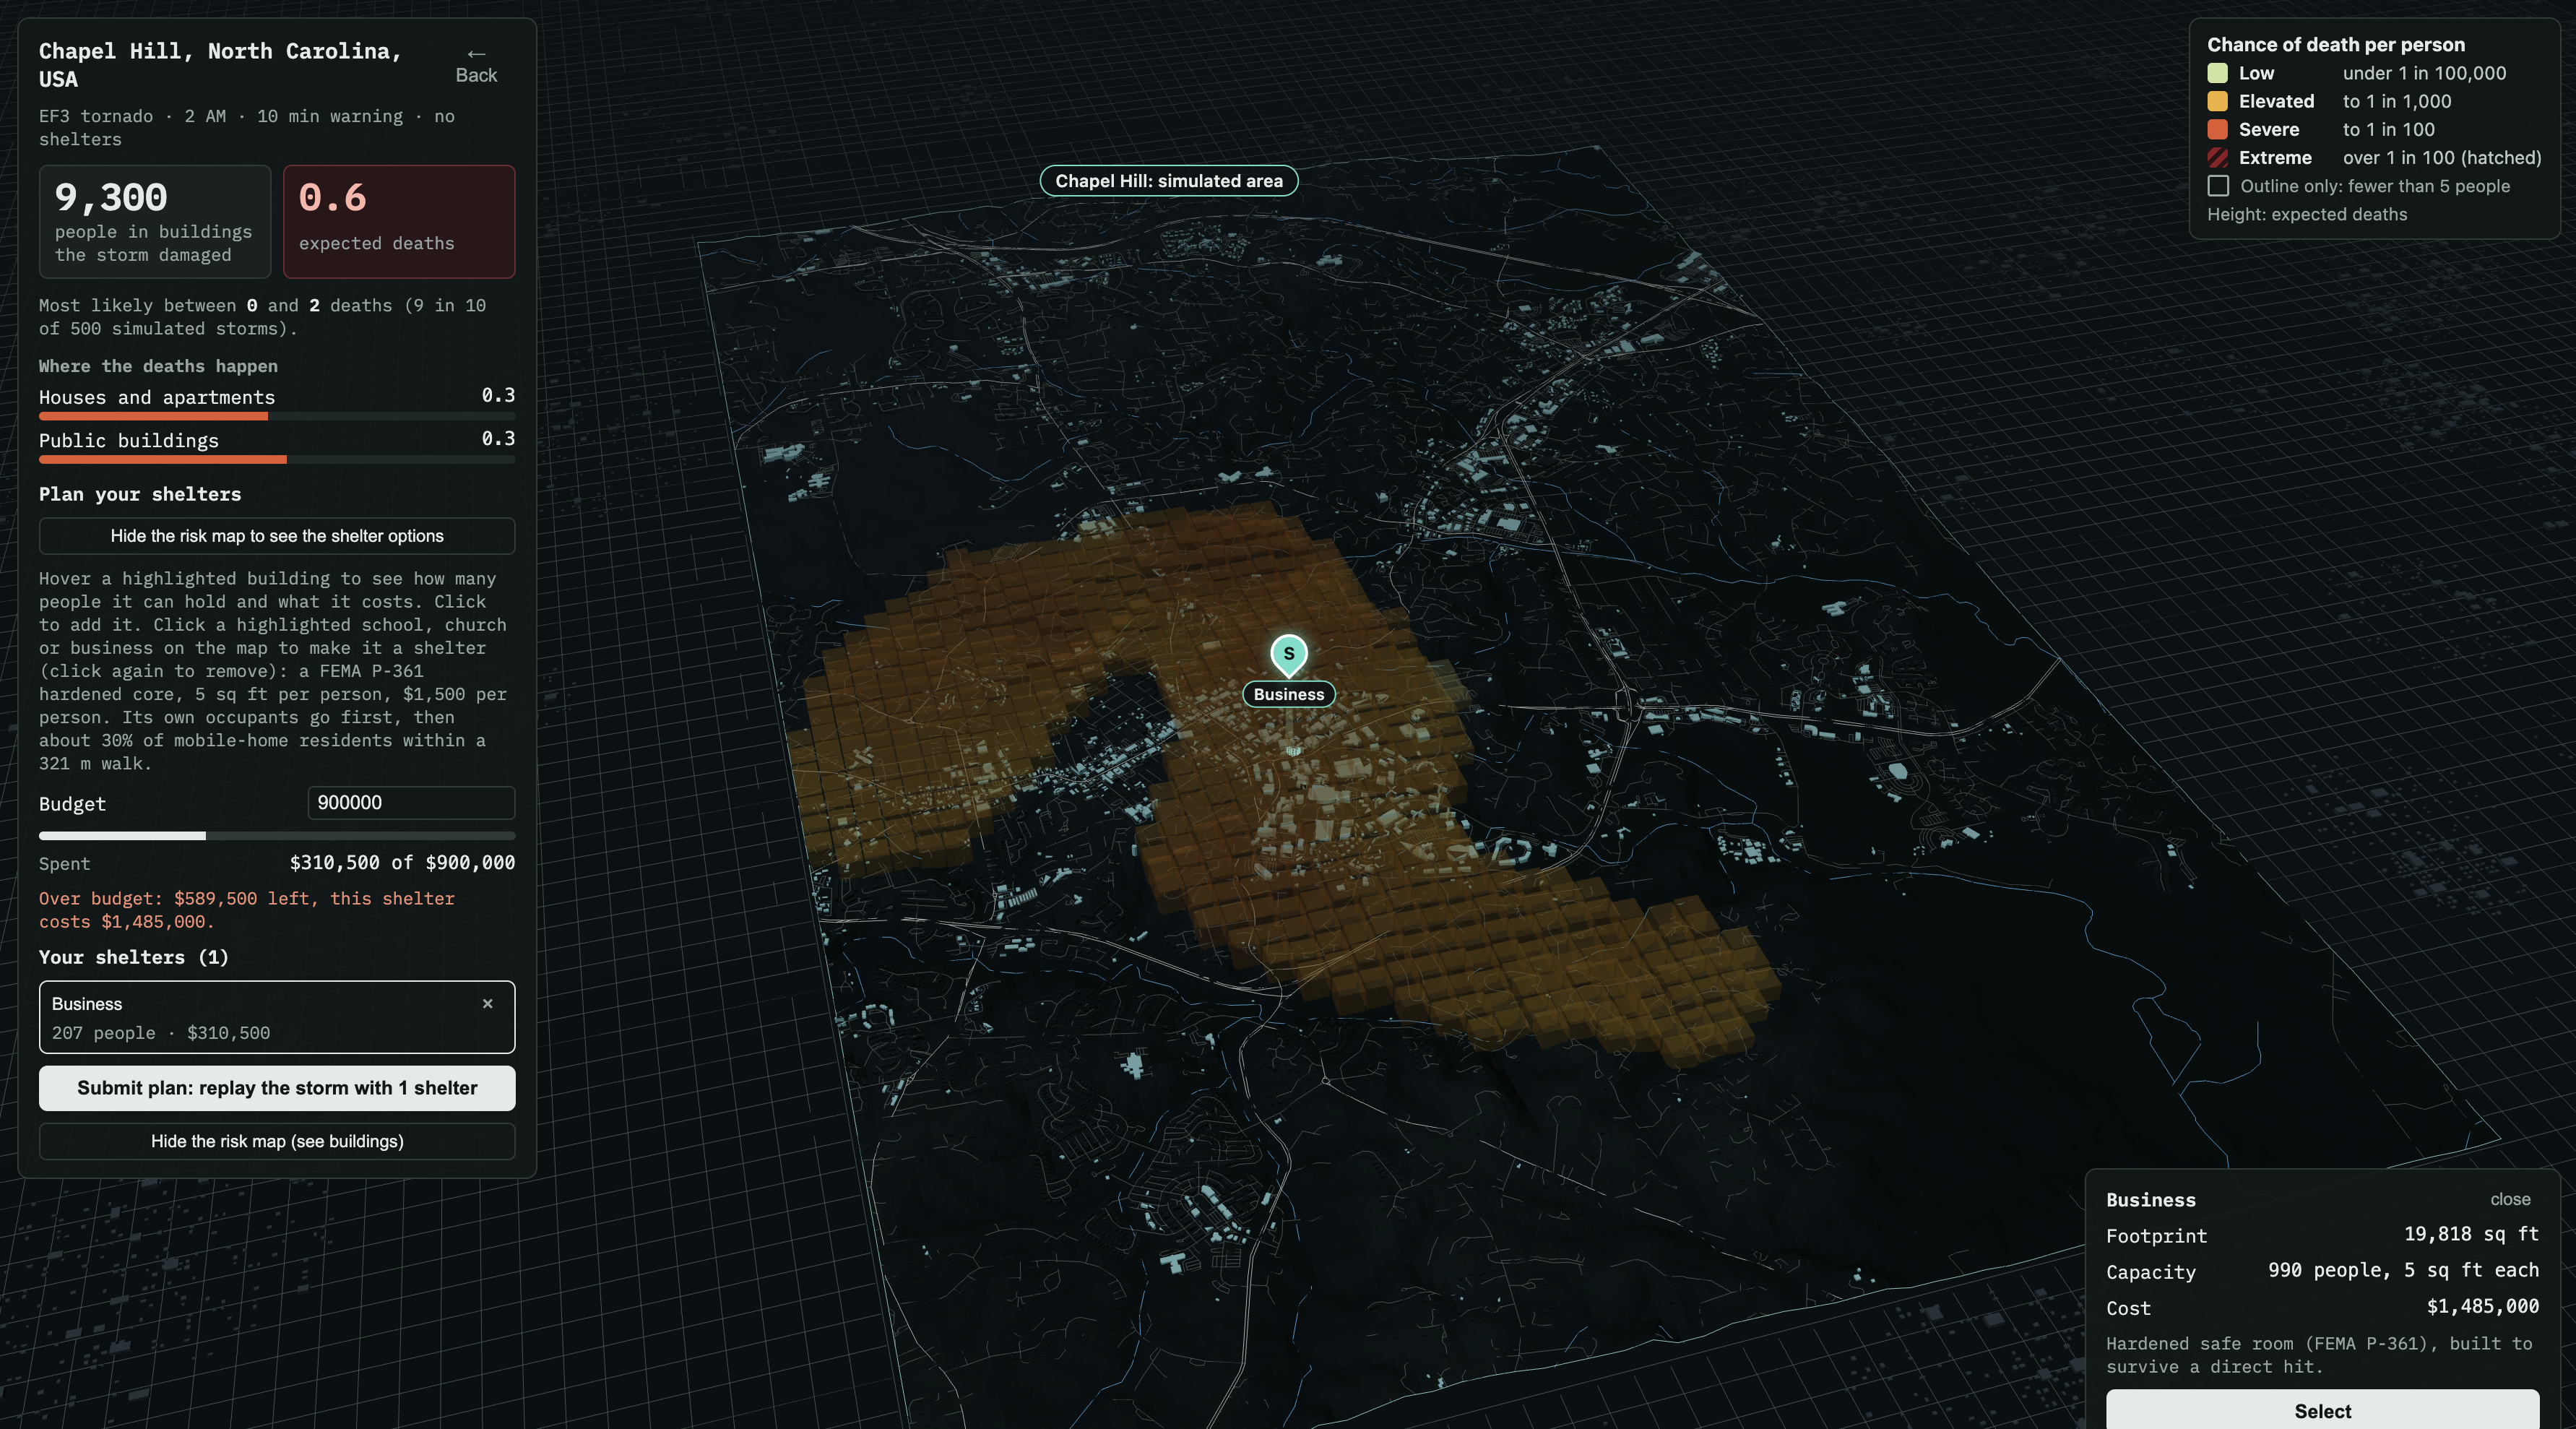
Refuge sends a tornado or hurricane through a real U.S. town, building by building, using the USACE National Structure Inventory. Afterwards the town turns into a risk map showing each area's chance of death ("1 in 20 for someone here") and why ("mostly mobile homes, no basements, 2 AM"). Then you get a budget, turn schools, churches and businesses into FEMA-grade shelters, replay the same storm, and see how your plan compares with the best one our optimizer can find.
AI for Social Good
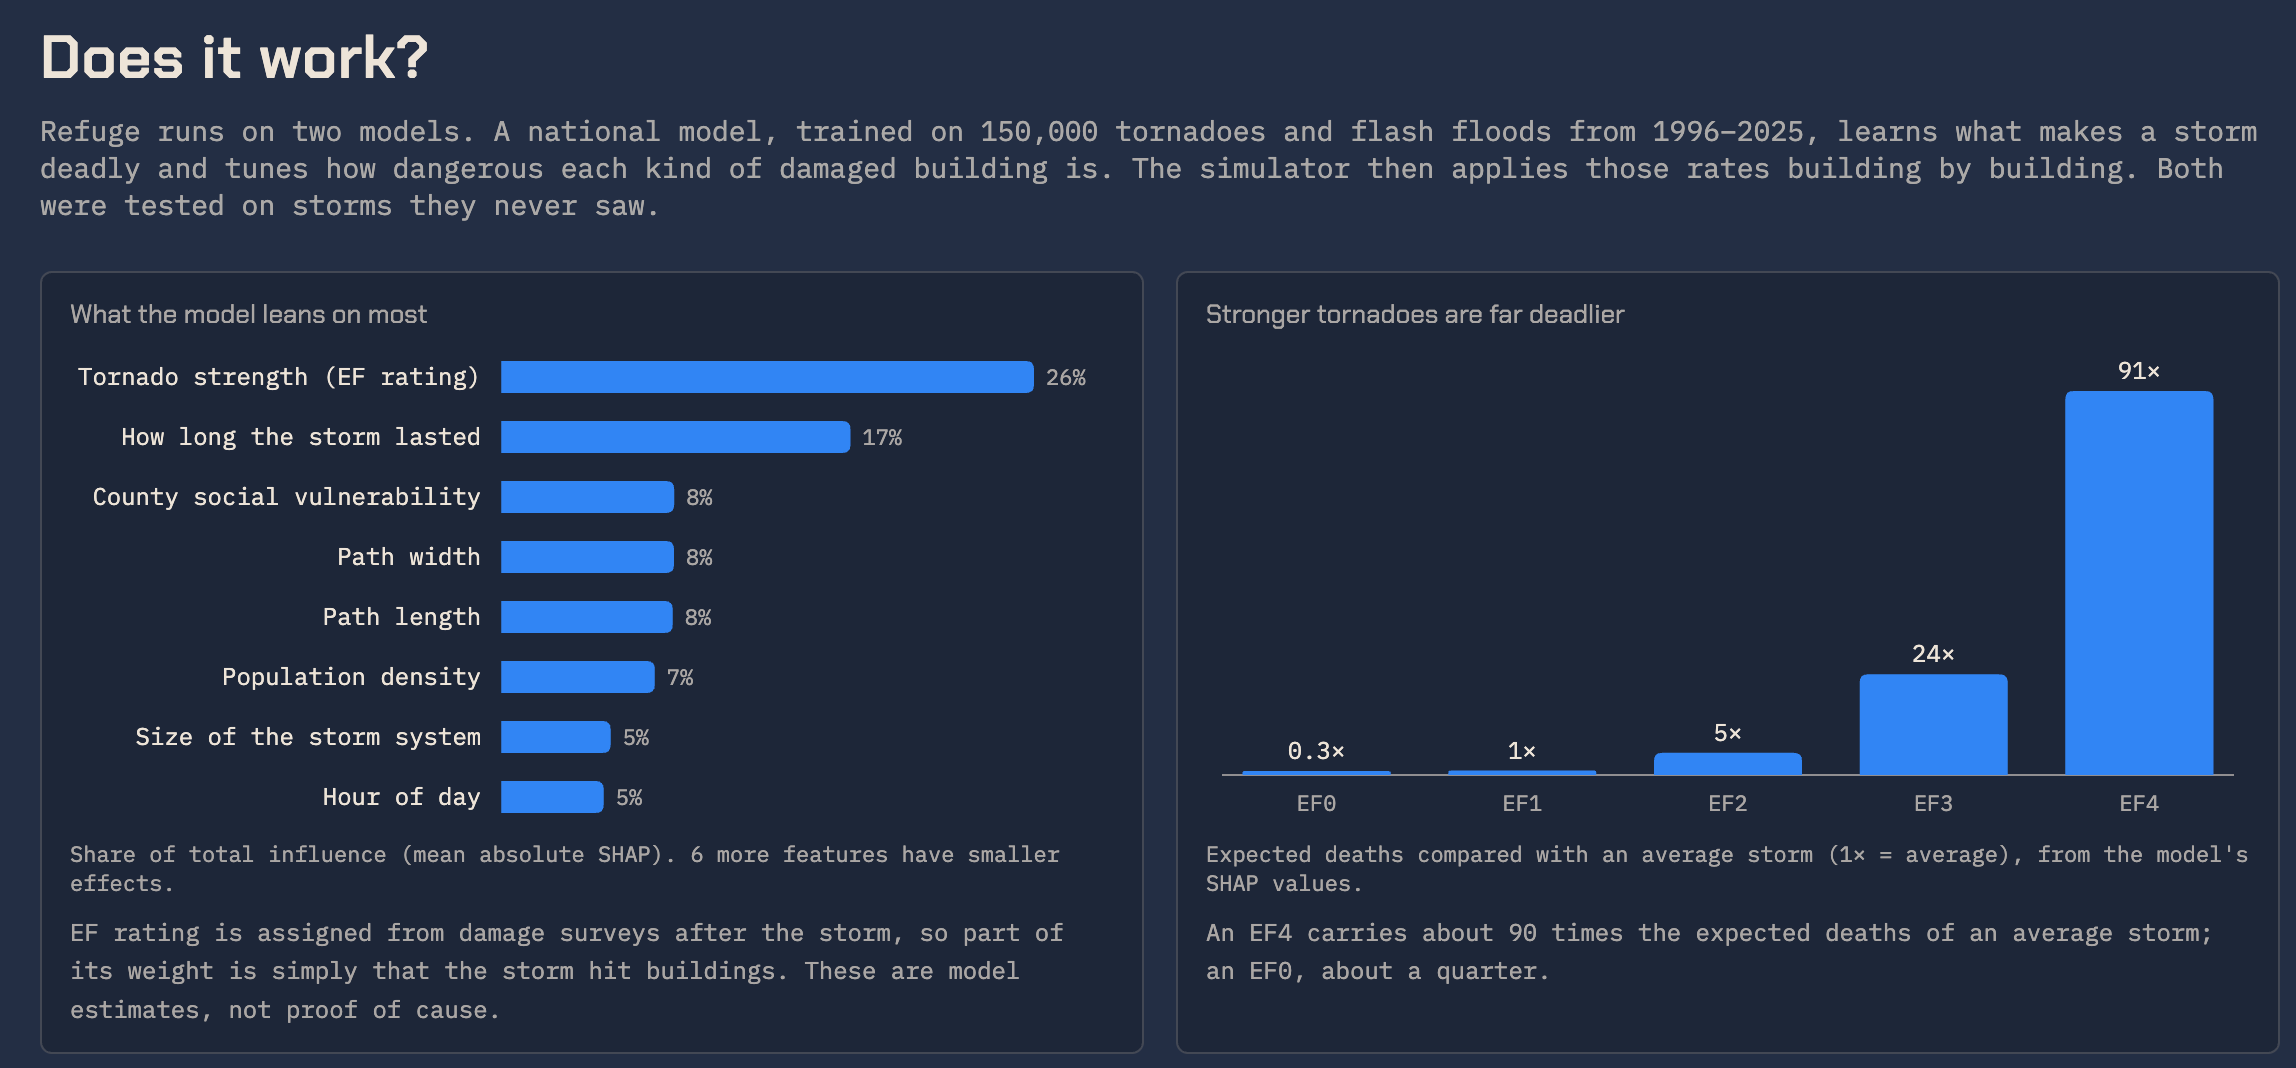
- We trained a national risk model on 30 years of NOAA storm data (1.78M events, 23,852 deaths). It scored an AUC of 0.83 on states and years it never saw, and a second model predicts where people die.
- We calibrated the simulator on 48 real tornadoes and tested it on 30 more it was never tuned on.
- A search algorithm checks every affordable shelter combination to find the plan that saves the most lives.
- It's free, runs in a browser, and points attention at the people most at risk: mobile-home residents, storms at night, and small towns without basements.
## How we built it Four people, each owning one part:
- Data pipeline (Python): NSI buildings, OpenStreetMap, USGS elevation and H3 hexagon cells, packaged as one folder per town. A build server can add any U.S. city.
- ML (Python): NOAA data cleaning, the risk models, calibration and backtesting.
- Simulation (TypeScript): one engine that runs in the browser and as a command-line tool for calibration.
- 3D scene: React Three Fiber, plus a React game interface.
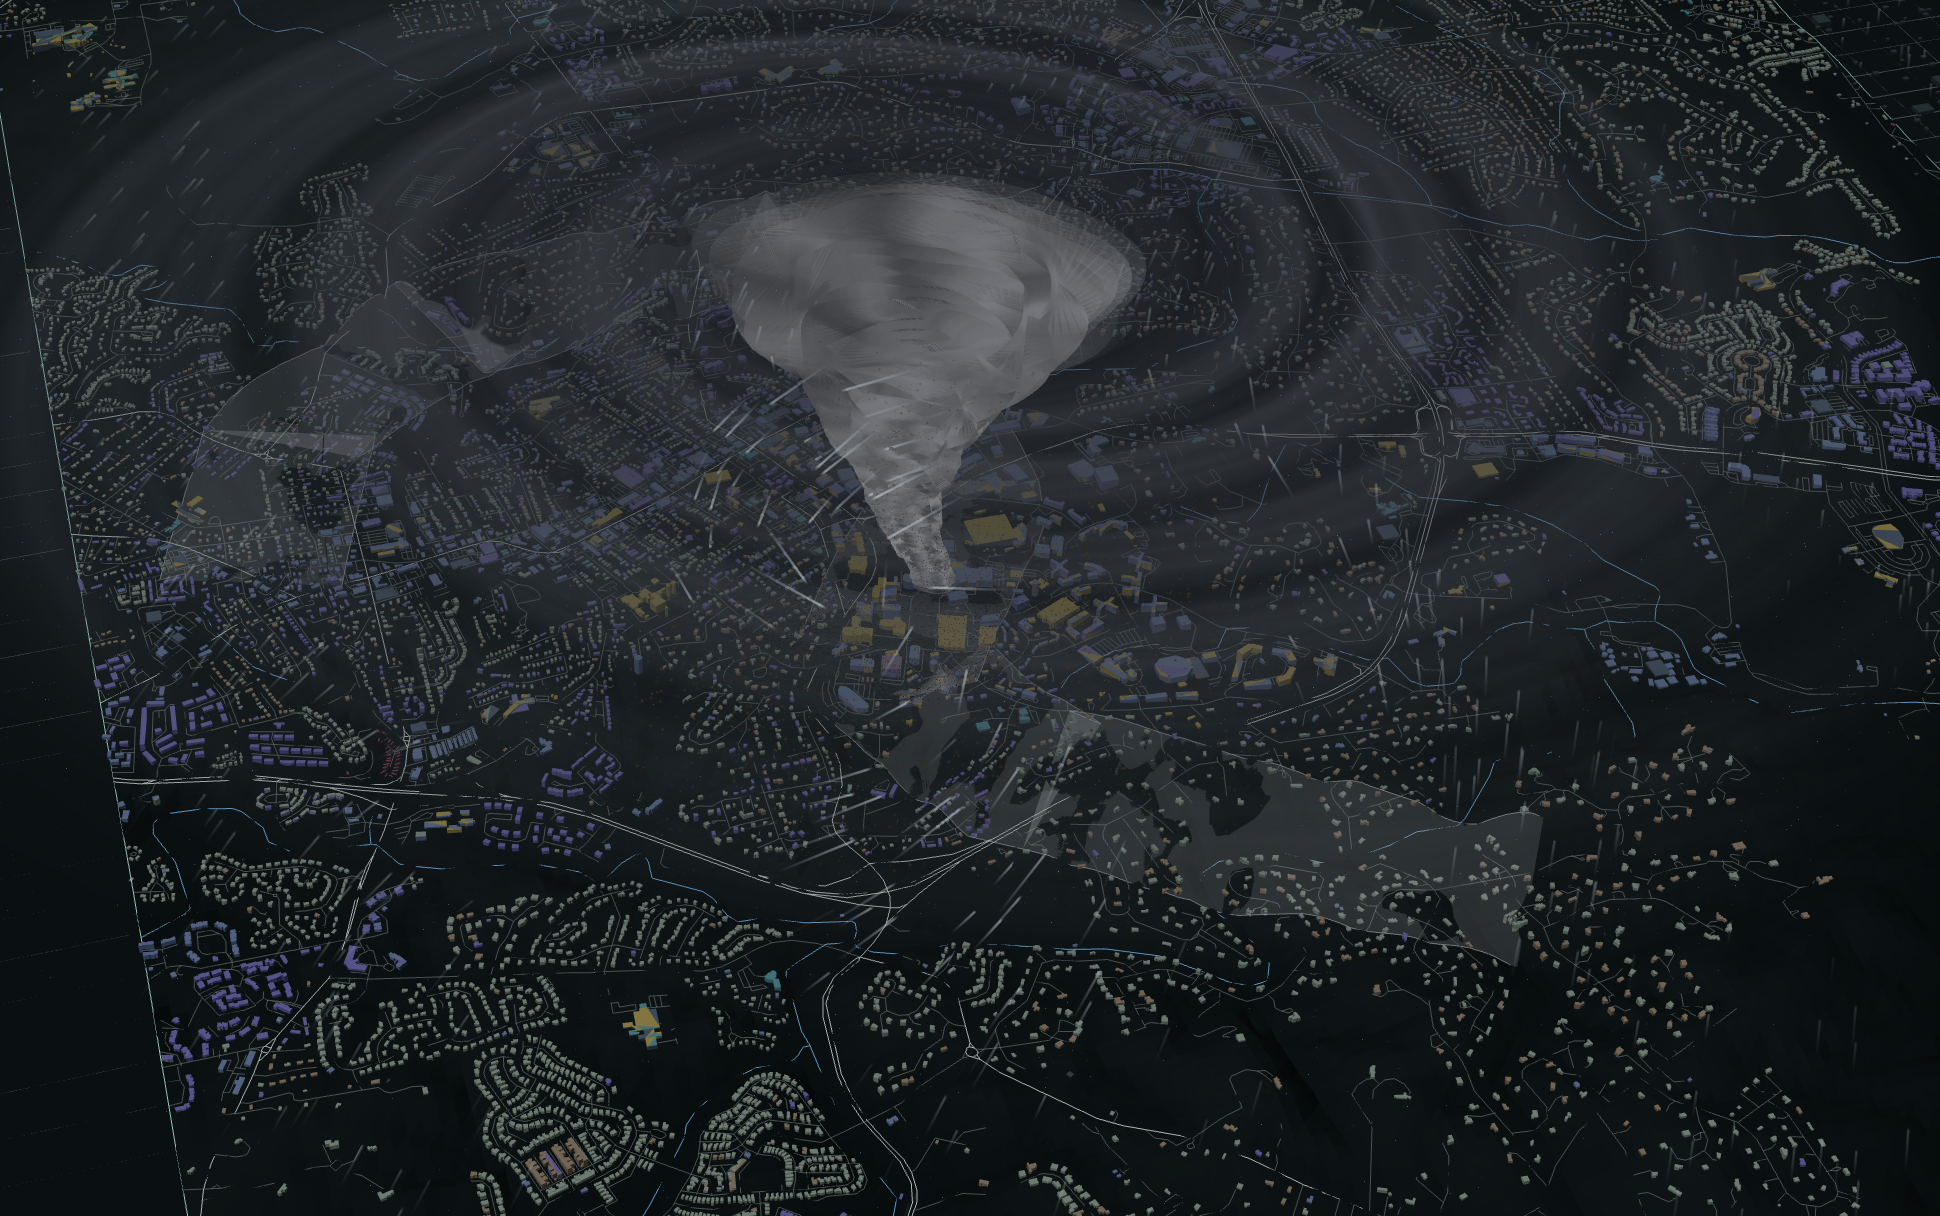
For tornadoes, wind is strongest at the center of the path and fades toward the edges. Each building's damage level comes from the Enhanced Fujita scale's thresholds for its type (mobile home, house, school, warehouse and so on). Each person's chance of death depends on that damage level, their building type, whether it's night, whether there's a basement, and how much warning they had. We run every storm 500 times to get a range rather than a single number.
For hurricanes, we model wind around the eye with a standard hurricane wind profile (the Holland model) and use fragility curves to estimate how likely each home is to be badly damaged. Hurricane mode measures how many people lose their homes, because hurricane wind rarely kills people indoors.
The rest of the write-up has no formulas, so it's ready to paste as is.
Challenges
- Missing data: the six deaths in the Edwardsville tornado happened in an Amazon warehouse that isn't in the structure inventory.
- Straight paths: NOAA records storm paths as straight lines between points, but real tornadoes curve, so our historical replays under-predict.
- The calm eye: a hurricane track drawn across a small town left everyone in the eye with zero wind, so we extend drawn tracks 150 km past each end.
- Merging four branches fast: each of us worked in parallel, and the bugs showed up in the seams. We found them by clicking through the real app.
Accomplishments
- Our TypeScript engine matches the ML team's Python reference exactly. Hurricane Michael at Mexico Beach: 2,146 displaced and 1,174 destroyed.
- The Estill EF4 tornado simulates 4.3 deaths against 5 recorded.
- A 25,000-building town runs in the browser in about 0.1 seconds.
- The demo teaches something true. In Lumberton, a $193K church next to a mobile-home park saves more lives than a largerbuilding across town.
What we learned
- Showing a range ("12–27 deaths") builds more trust than a single number.
- Warning time and people's willingness to leave matter as much as concrete.
- Agreeing on shared data formats early is what let four people build in parallel.
What's next for Refuge?
- NWS surveyed damage paths and real warning times.
- Bringing flash floods back; the stream and road-crossing data is already built.
- More protections, such as sirens and crossing gates.
- Piloting Refuge with county emergency managers.
Built With
- claude
- codex
- love
- python
- typescript


Log in or sign up for Devpost to join the conversation.