-
-

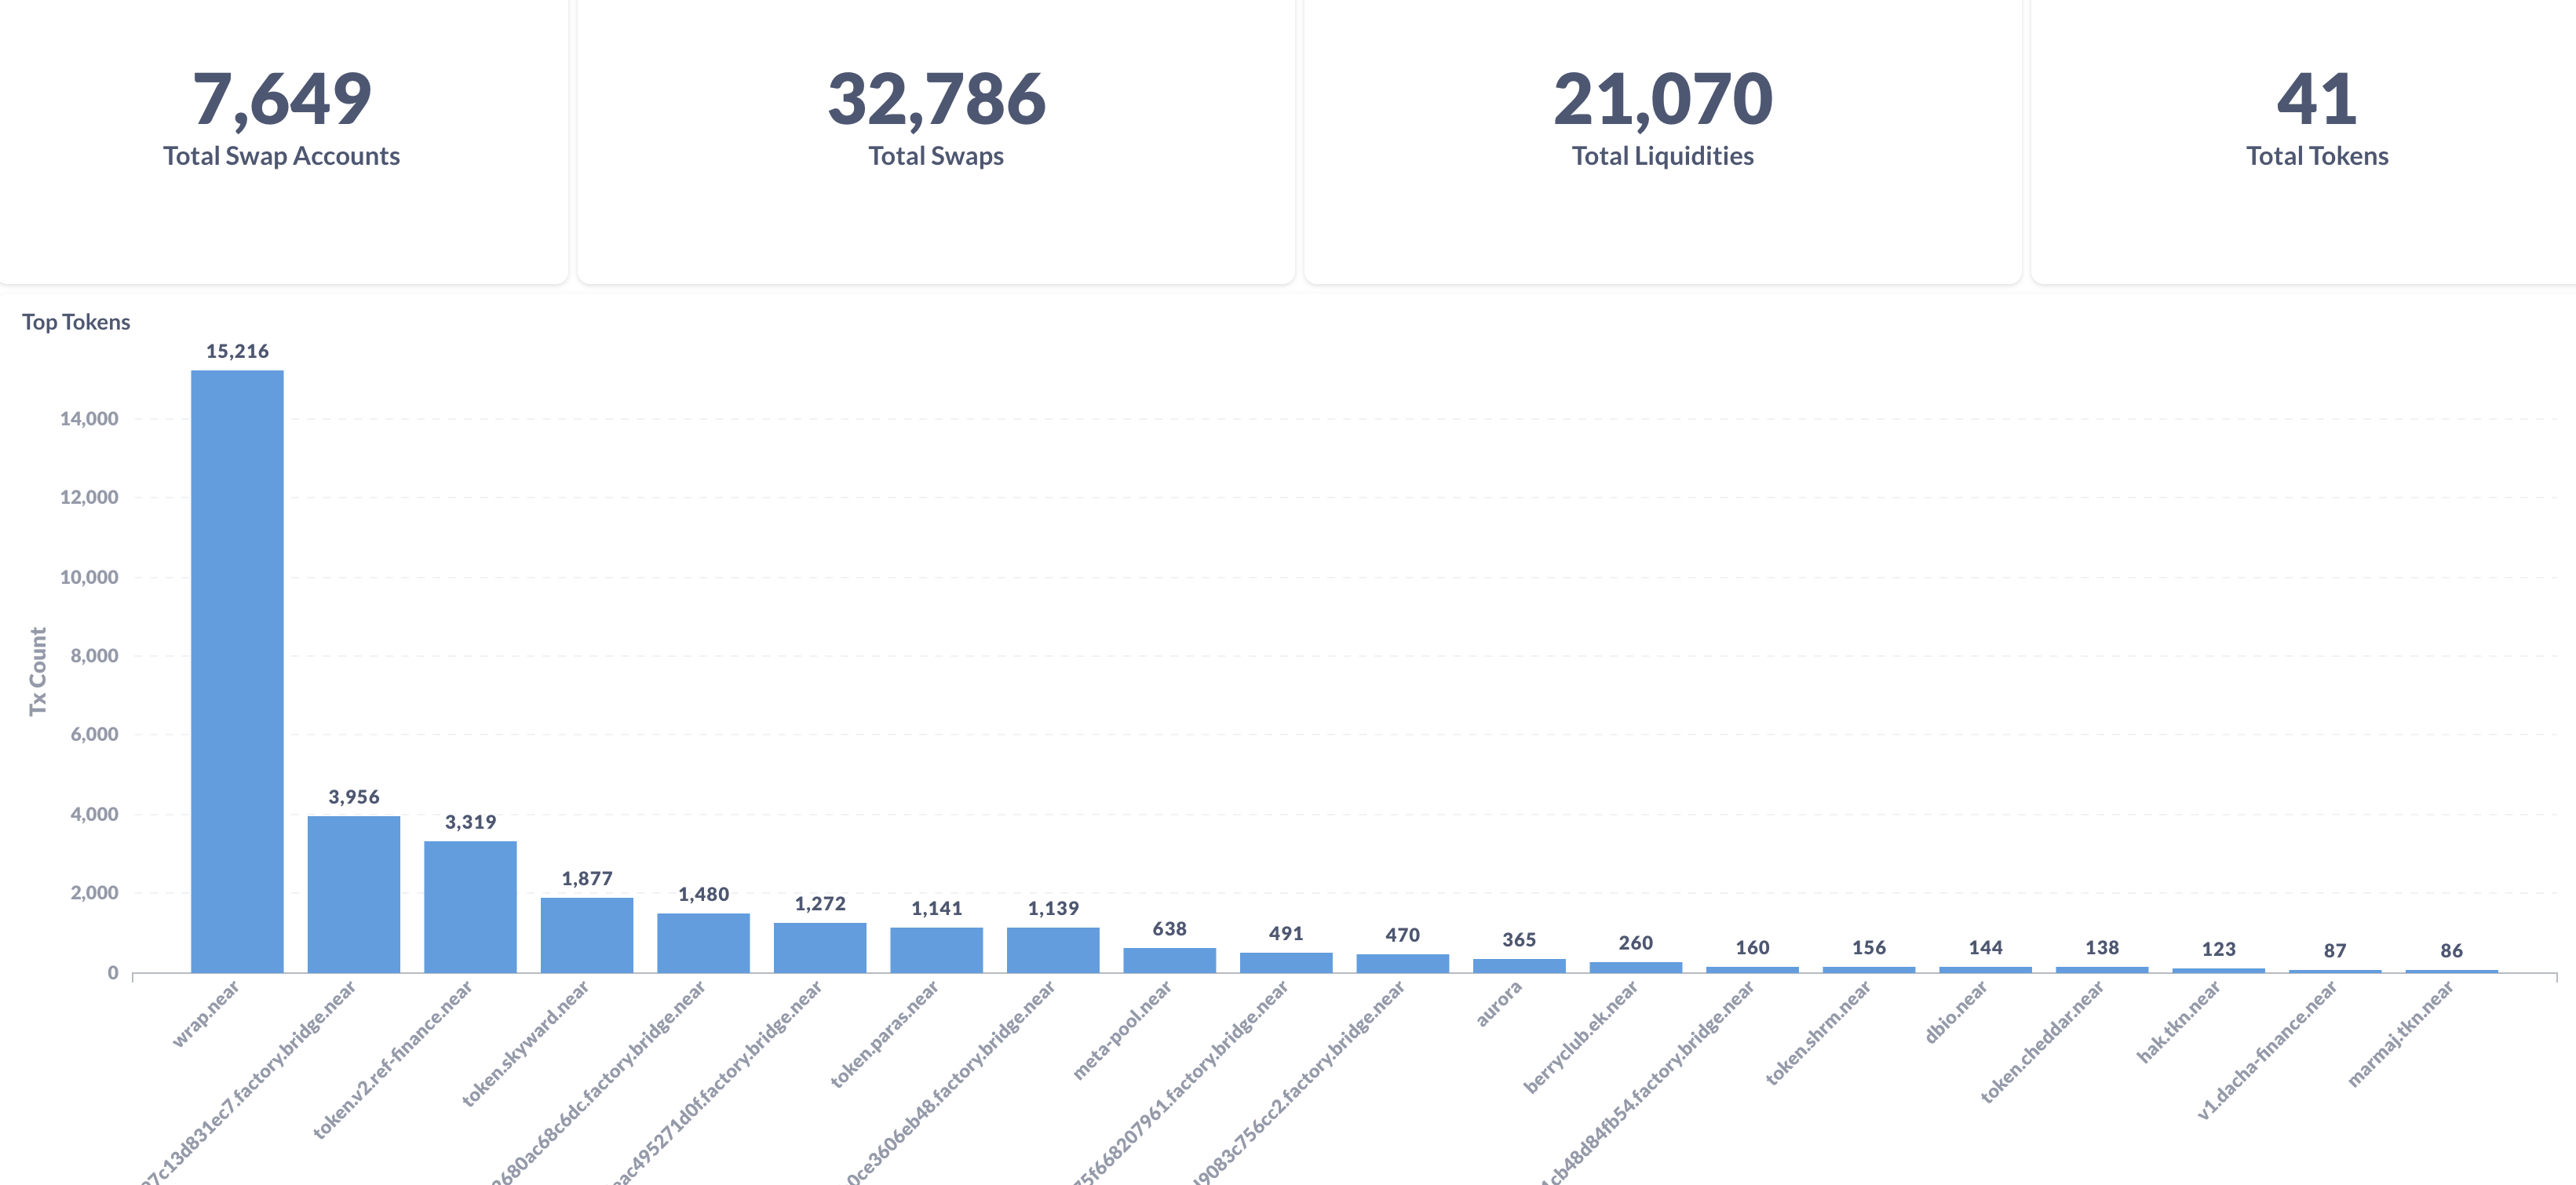
Aggregated Metrics
-
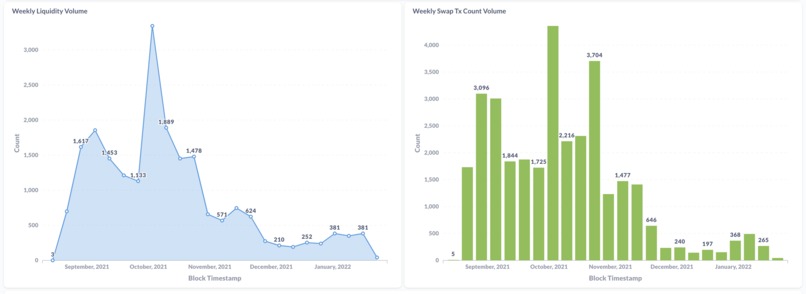
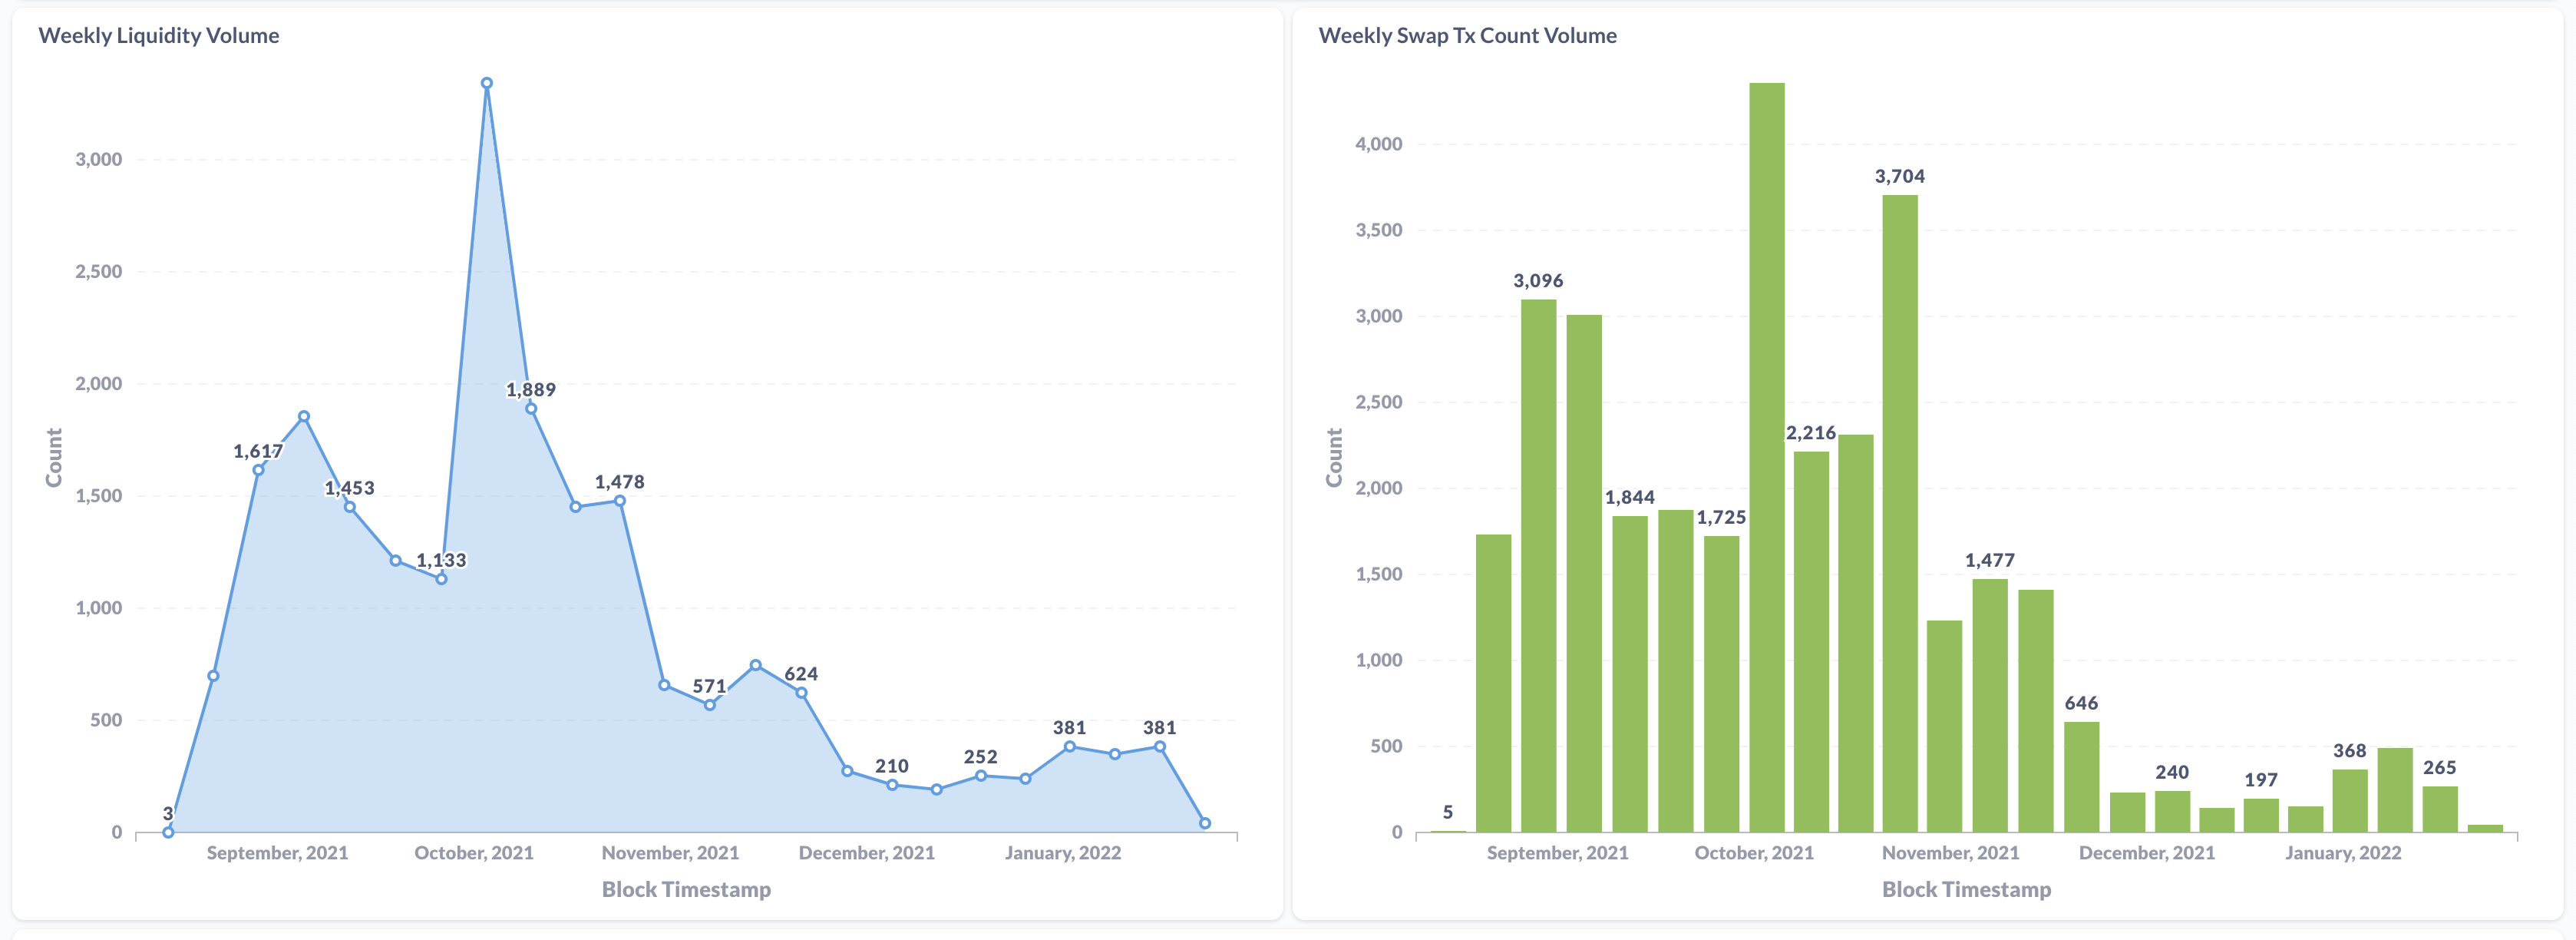
Weekly Swap and Liquidity Volume
-
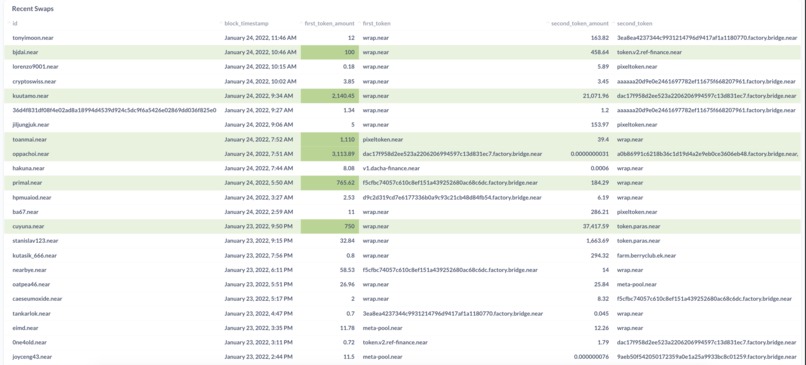
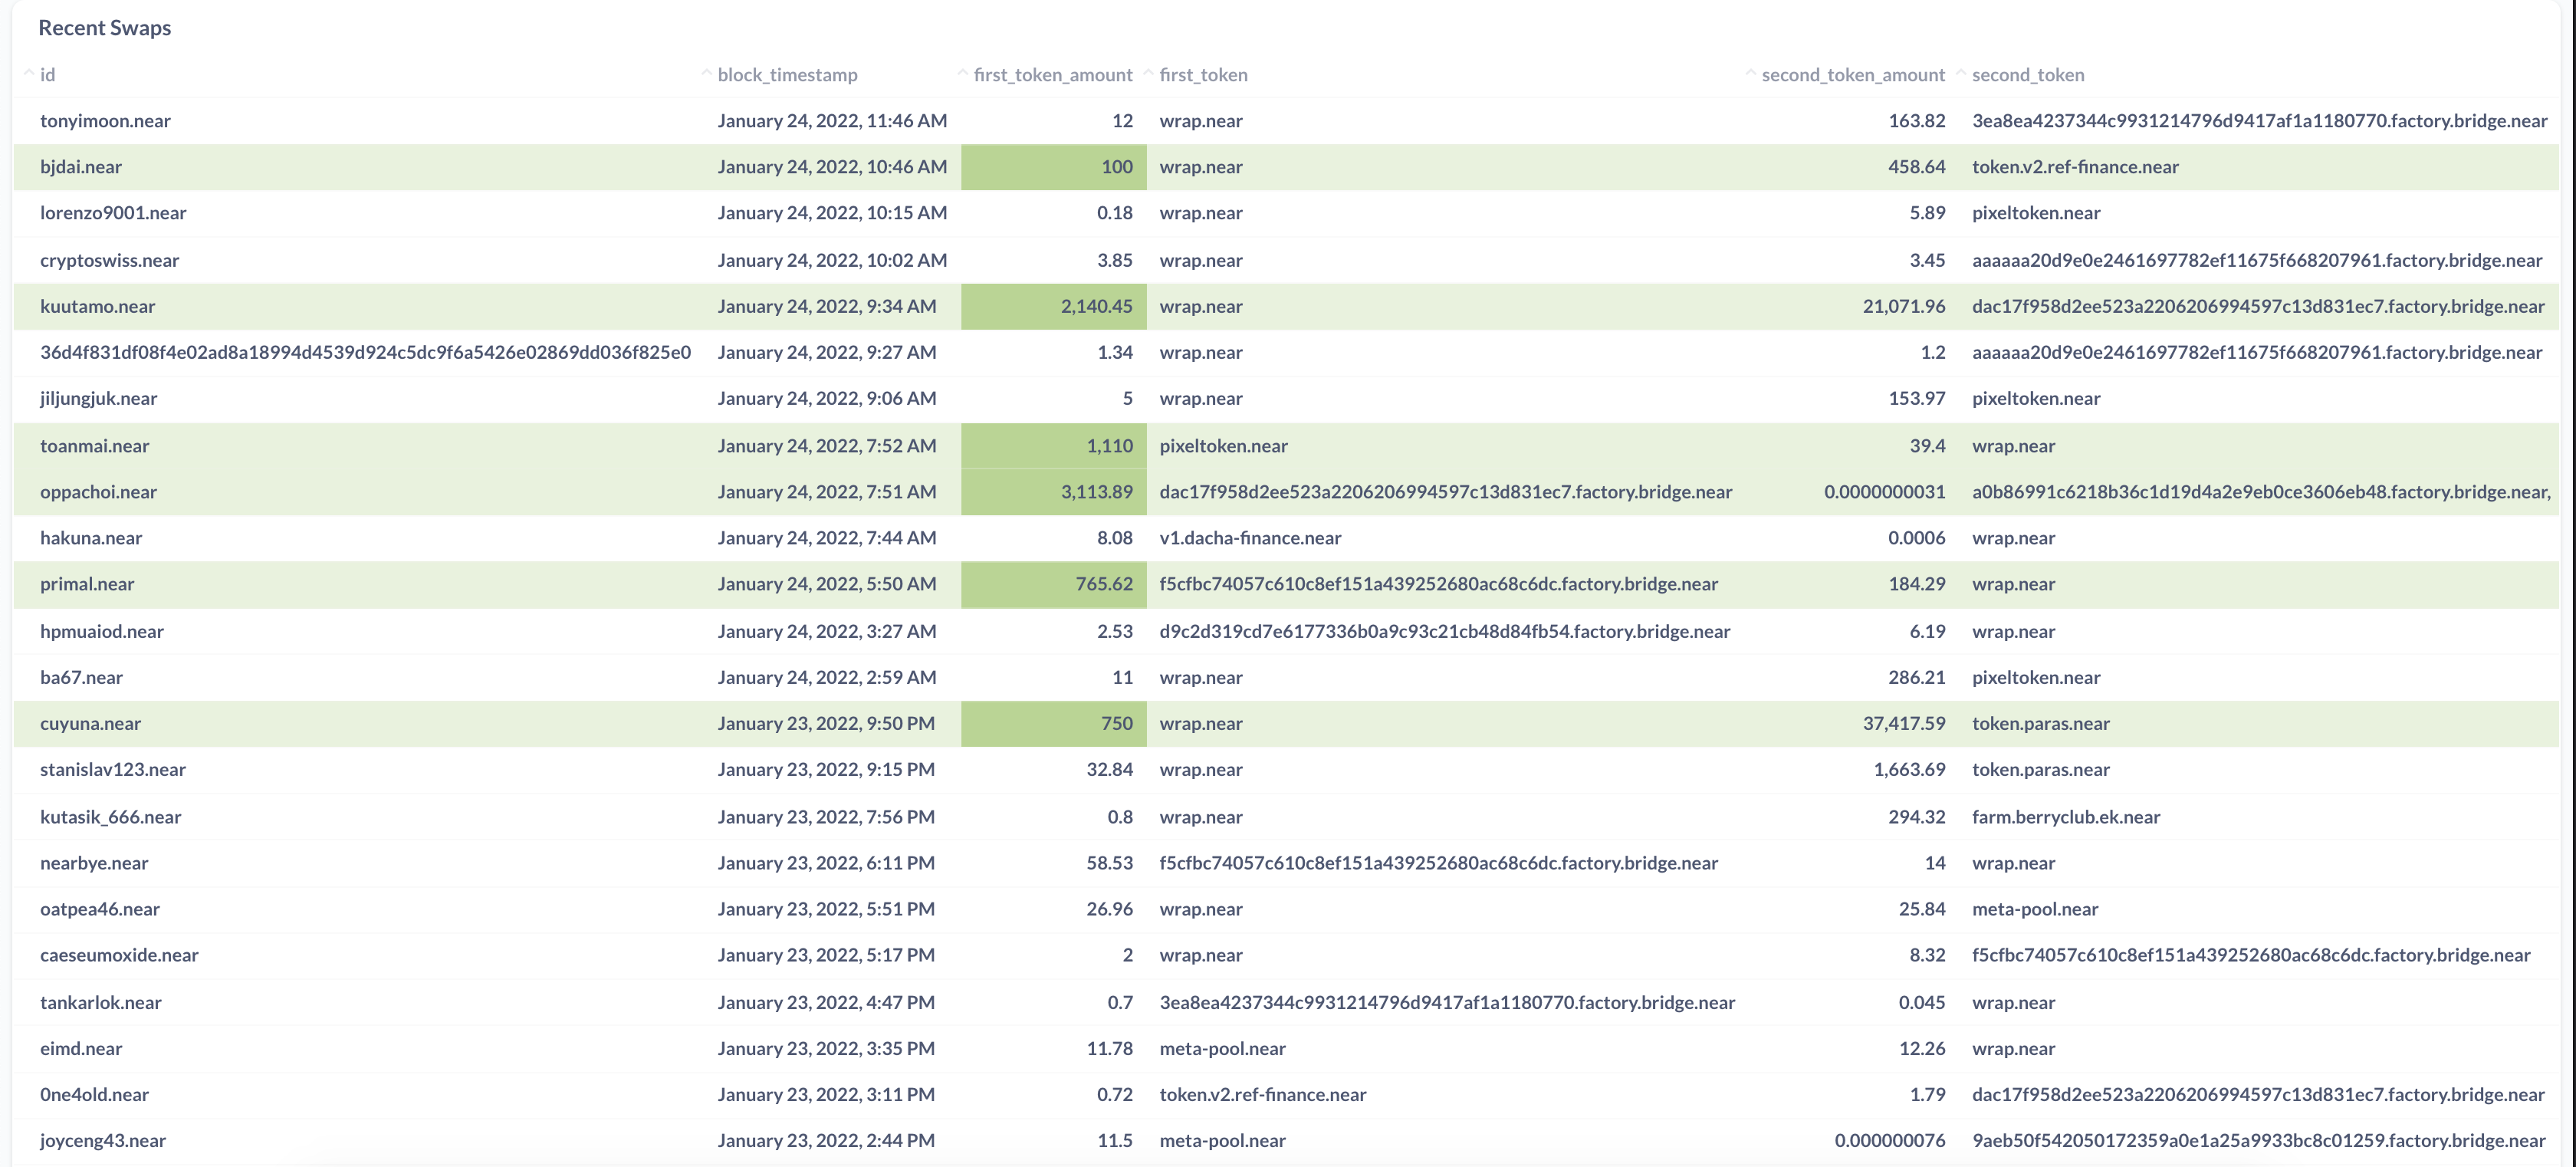
Recent Swap Transactions
-
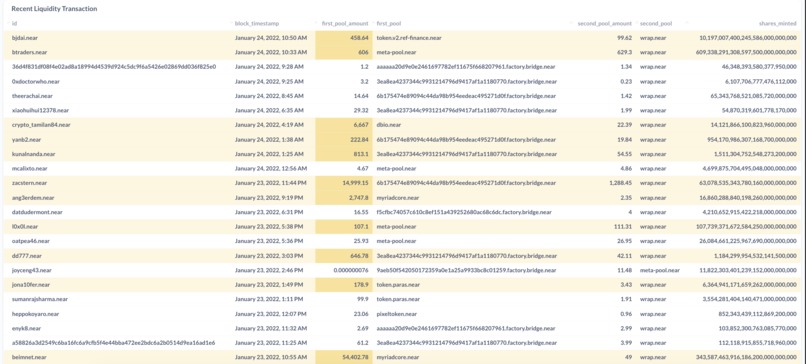
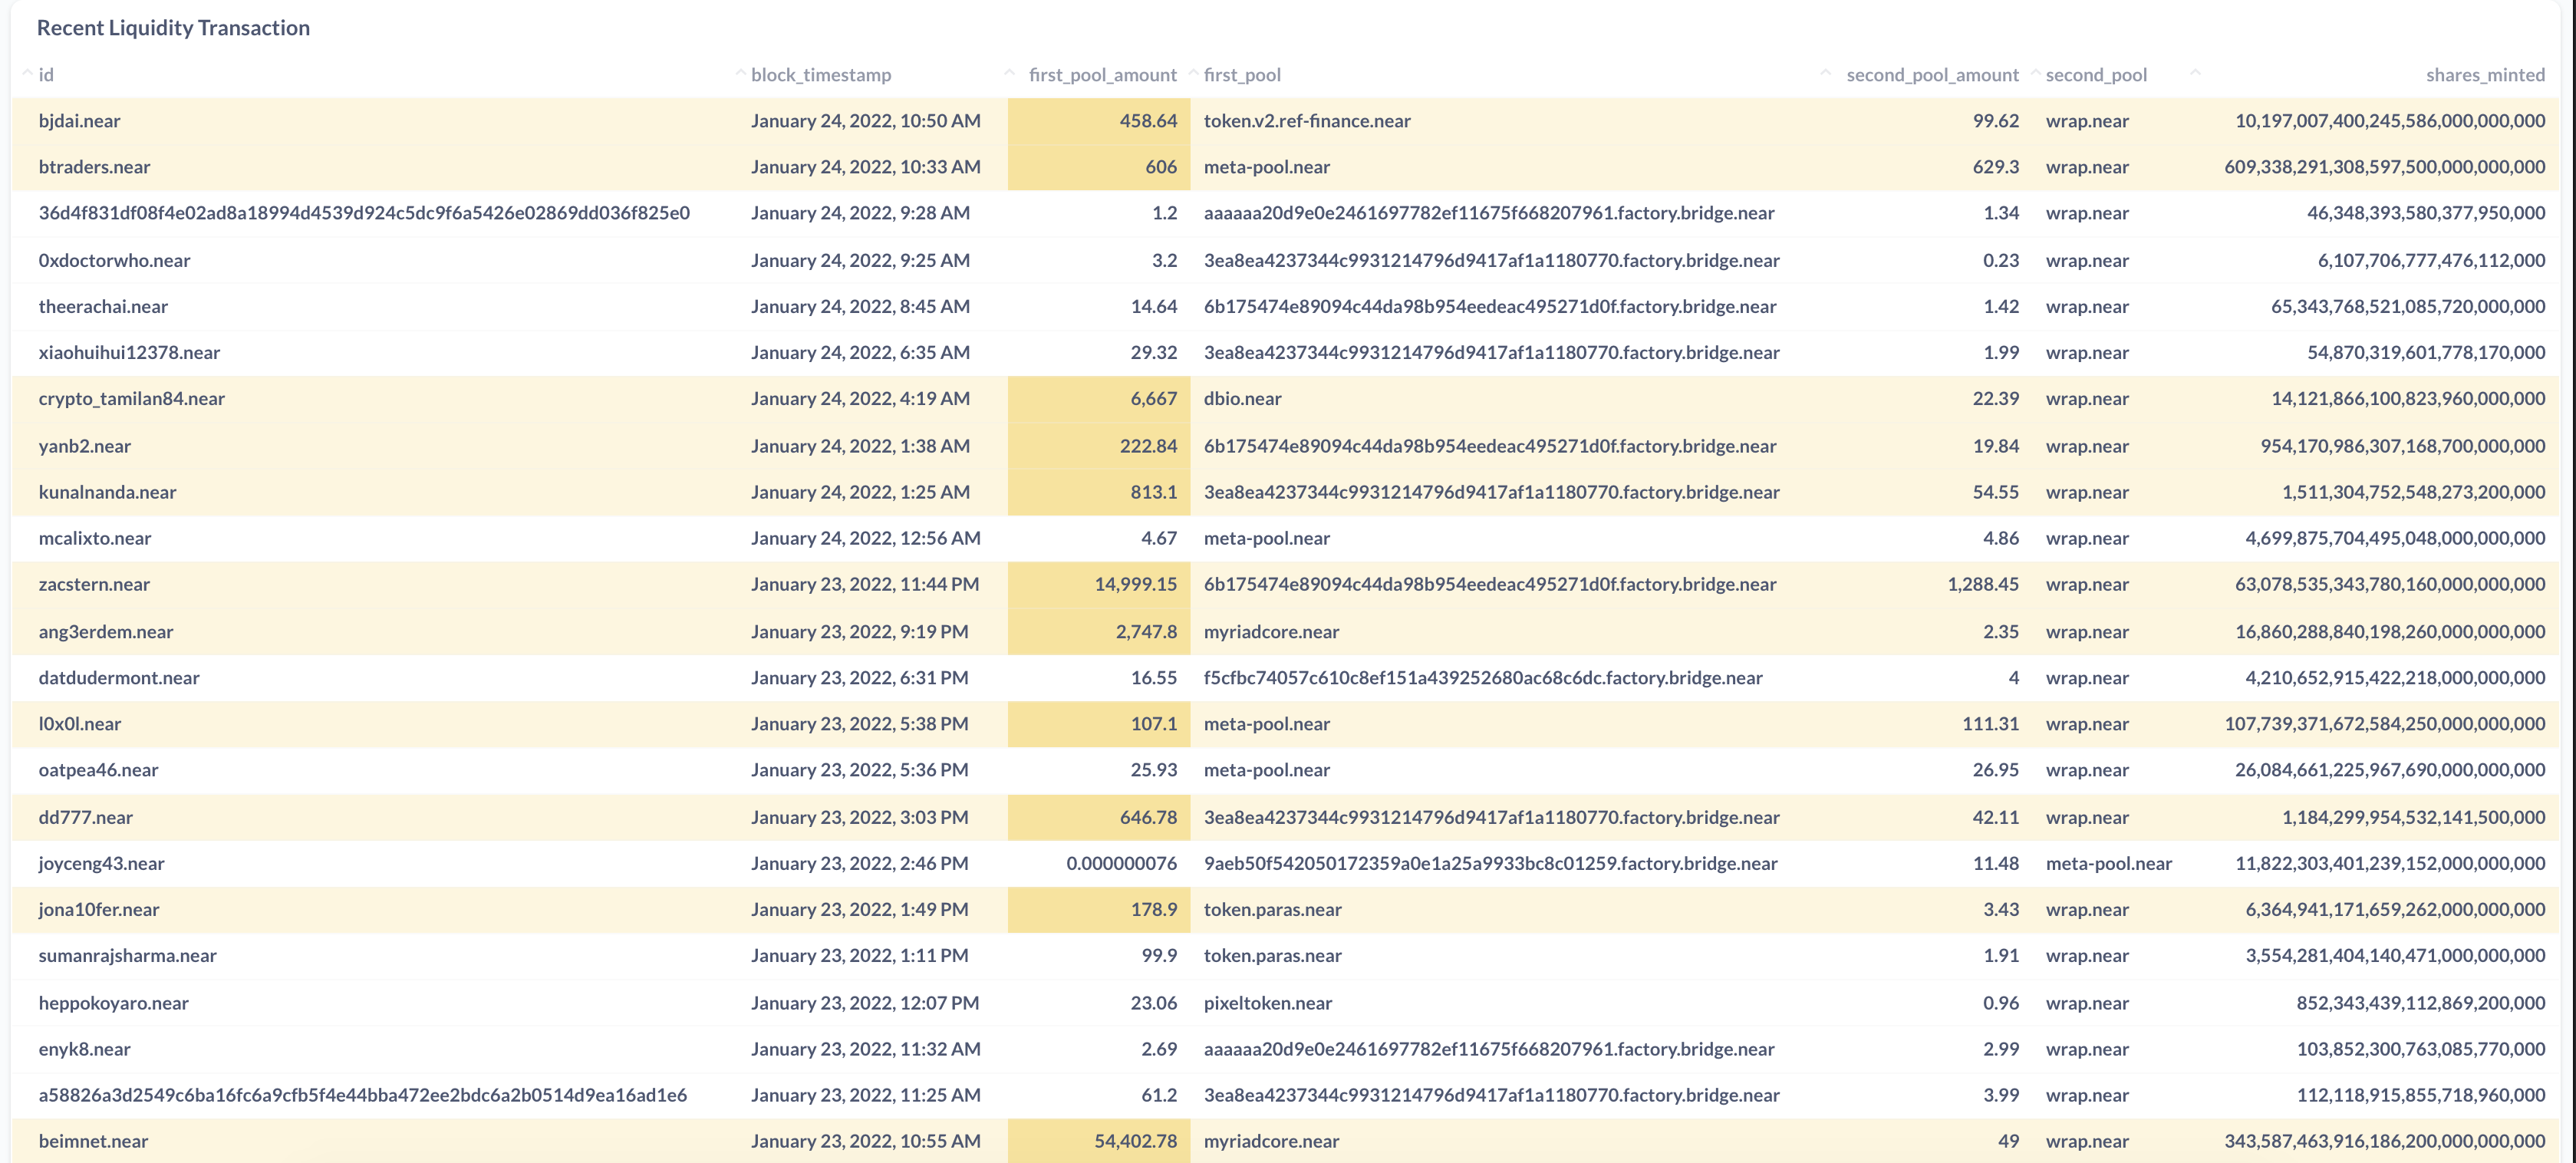
Recent Liquidity Transactions
-

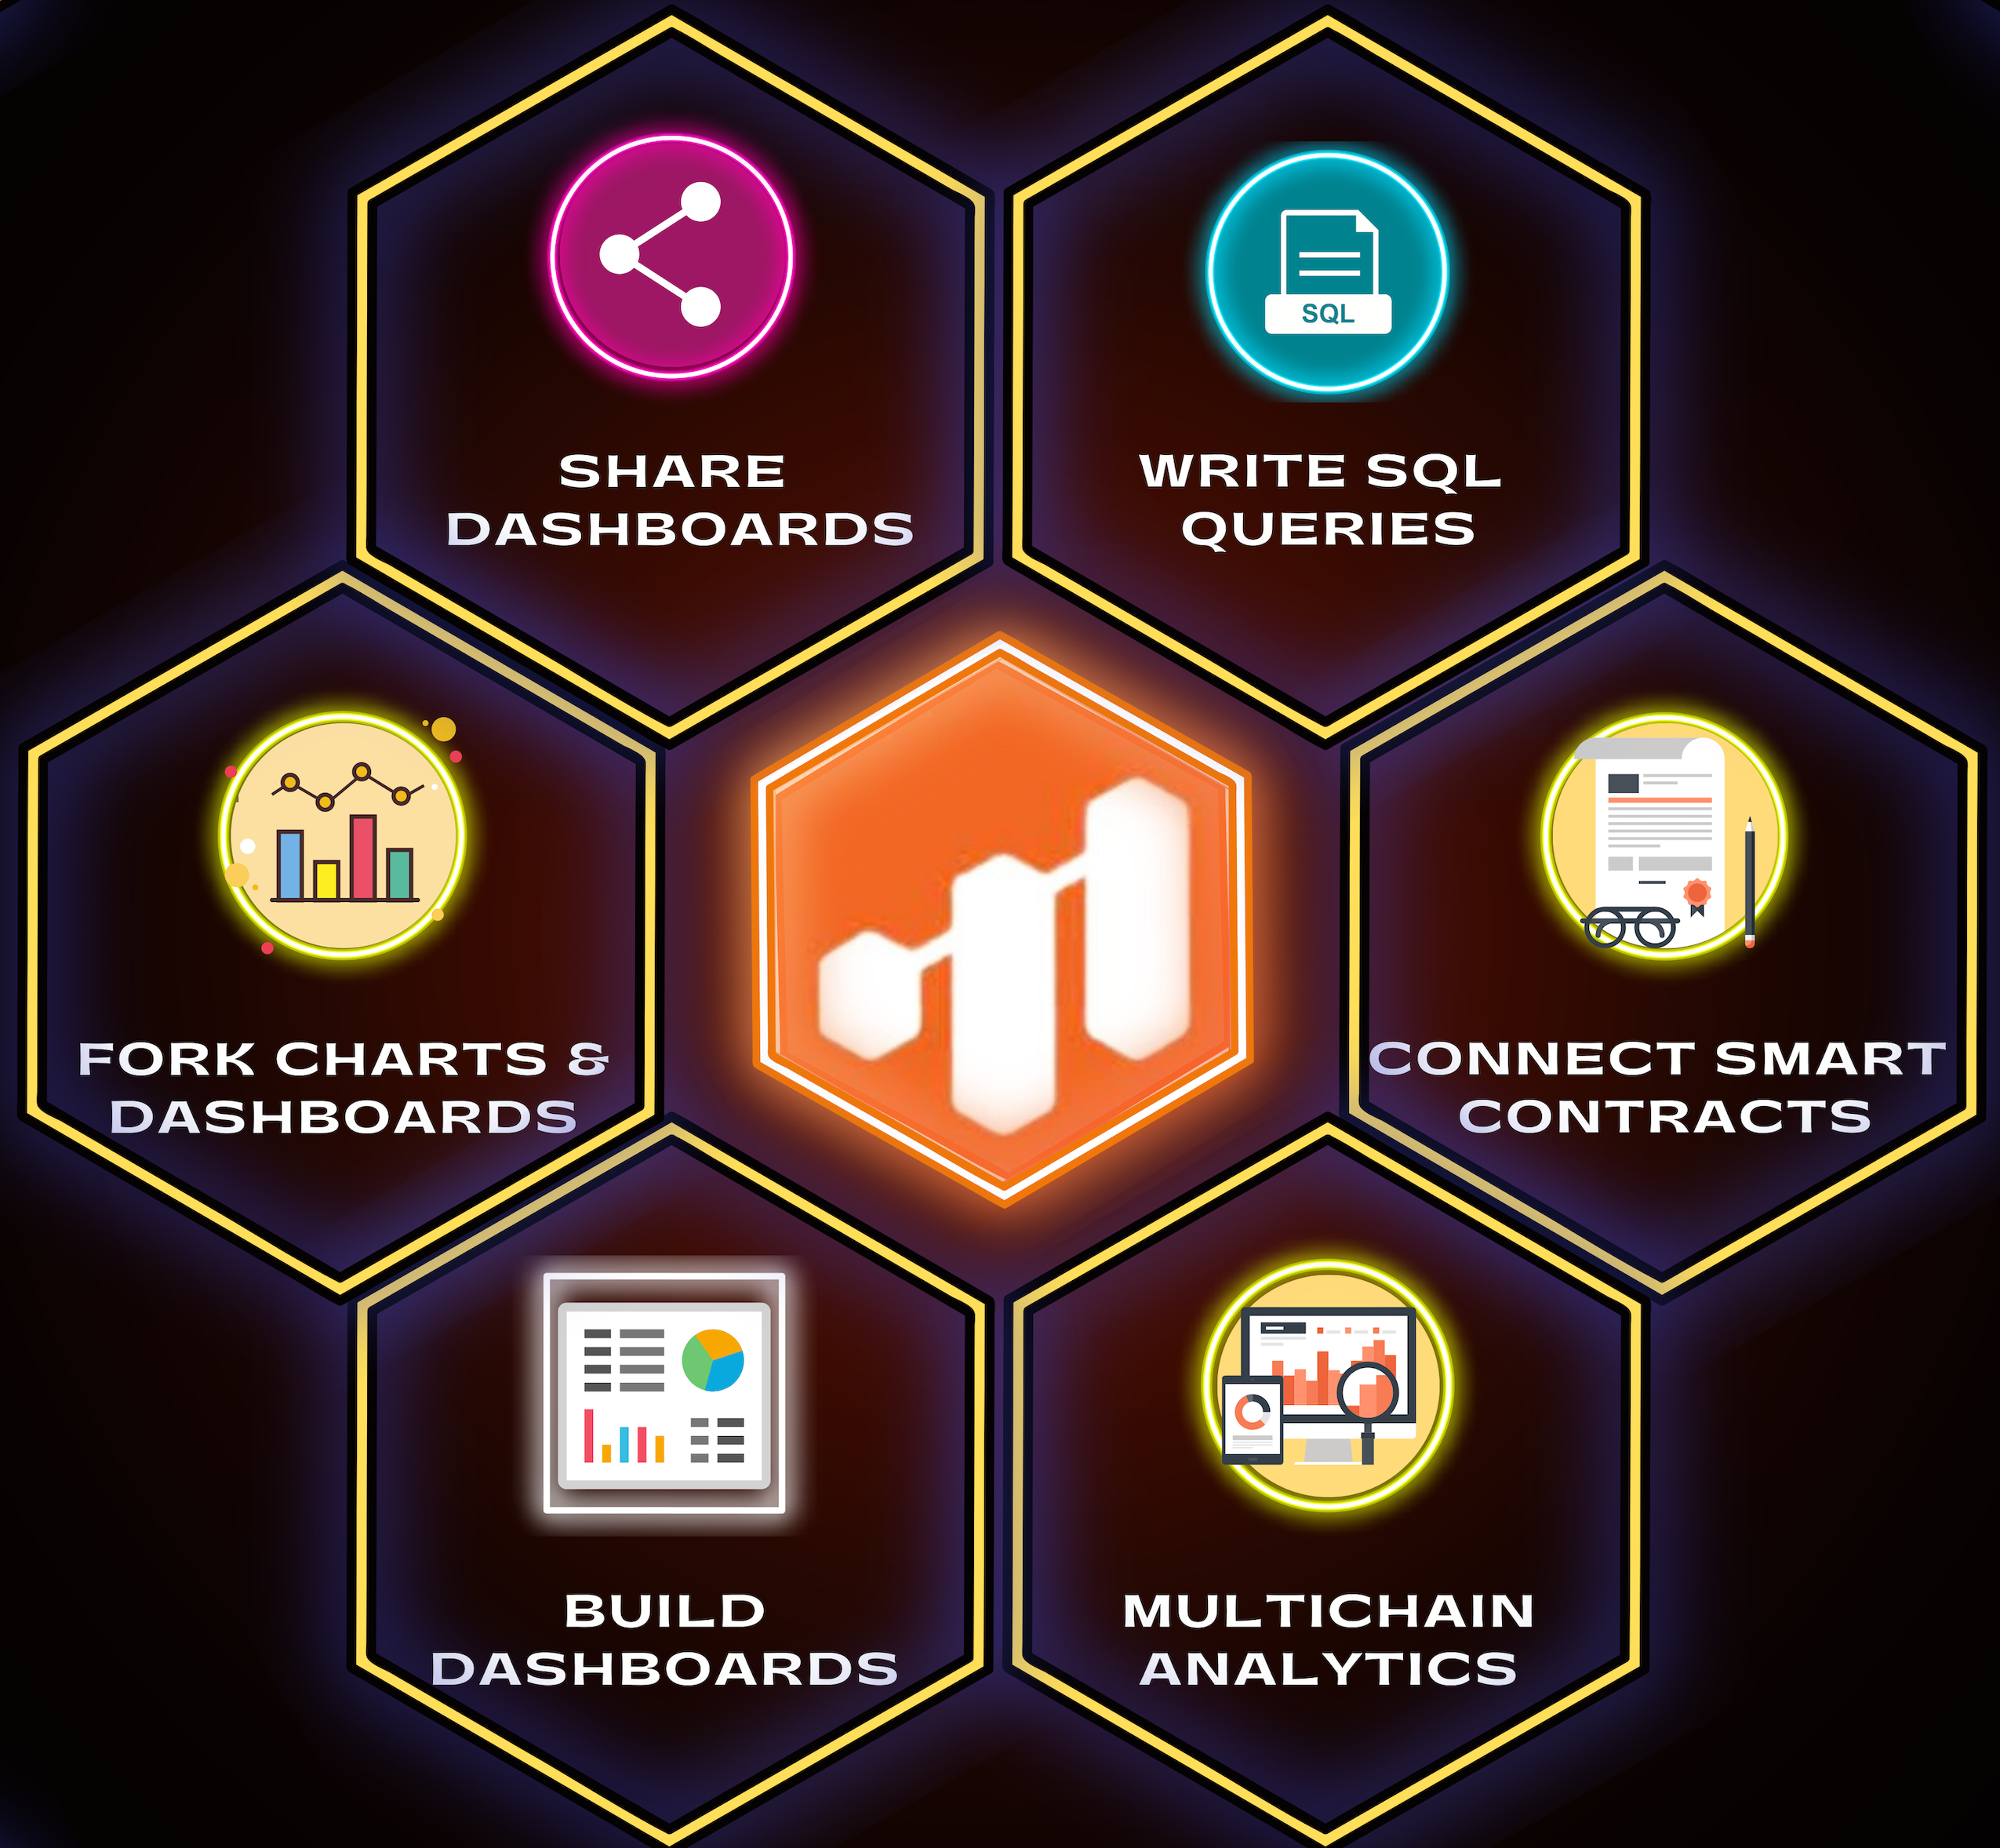
Dapplooker Features
Inspiration
Dapplooker is a multi-chain community driven analytics and visualization platform for blockchain networks and Dapps. Users can run SQL queries on blockchain data, Create dashboards using easy to use simple visual editor. Charts and dashboards can be forked, edited and shared with community.
Using Dapplooker platform features and capability, We indexed & created REF Finance Analytics Dashboard using the subgraph. Below are the details:
Ref finance charts & dashboards collection
Indexed accounts, swaps, liquidities data for community analytics
Community analytics can be done on the indexed data. Near and Ref Finance users can fork, edit and share dashboards with everyone.
What it does
Display and auto update below Ref finance on chain metrics:
- Aggregated metrics total swap, Unique Swap Users
- Supported tokens, total liquidity transactions
- Top tokens based on transaction volume
- Weekly liquidity and swap volume
- Recent swap and liquidity transactions
How we built it
- Discussion with Ref finance team, Near users for metrics to display on dashboard
- Analysis of Ref finance Dapp for the metrics
- Used Ref finance subgraph to index data in SQL tables
- Integration with graph and chart libraries for visualizations
- Efficient transformations for easy querying of data
Accomplishments that we're proud of
- Ref finance mainnet analytics dashboard is live
- Various growth metrics can be tracked on the dashboard
- Community analytics support for Ref finance and Near community
What's next for Ref Finance Analytics Dashboard
- Near subgraph integration at Dapplooker for analytics
- Neat smart contract integration at Dapplooker for analytics
Built With
- amazon-web-services
- dapplooker
- postgresql
- sql
- subgraph


Log in or sign up for Devpost to join the conversation.