-
-

Our logo
-
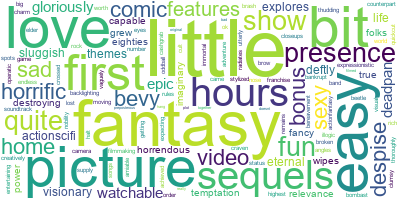
word cloud for the movie "Highlander"
-
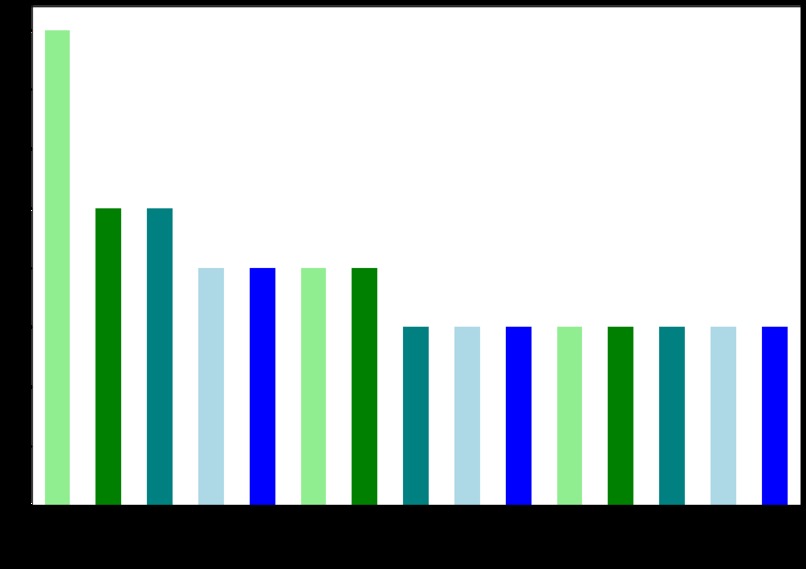
bar graph from the movie "Highlander"


Inspiration
With the vast amount of media content and consumers in the world, it's difficult to judge what the average response to a particular movie or TV show is. ReelEyes provides its users with a quick visual summary of what critics think of a given film using various data visualizations.
What it does
ReelEyes collects the critic reviews of a movie or TV show on Rotten Tomatoes to process and return data visualizations of the frequency of significant words used to describe the title. These visualizations include a word cloud, with the size of the word correlating to its frequency, and a bar graph of the 15 words most frequently used in all the reviews and the associated counts for those words.
How we built it
ReelEyes was built in Python. It uses three main packages: Beautifulsoup and Selenium to handle the web-scraping from Rotten Tomatoes, wordcloud to create the word cloud image, and matplotlib.pyplot to generate the bar graph. We also utilized Python's pandas package to manipulate the review data into usable formats to create the visualizations.
Challenges we ran into
Most of our challenges came from creating and implementing the front-end GUI. The Python package Tkinter was used to create a grid-based layout for the front end, which was a complex process of trial and error. Getting the program to run in multiple threads was harder to start with but made the user experience much better. Scraping was challenging, but it was fun.
The biggest challenge we faced was from the search results from Rotten Tomatoes. Rotten Tomatoes has an unconventional approach of ordering the movies in search results where the most popular movie isn't always the first result. So, when we search for pulp fiction it shows PULP FICTION: THE GOLDEN AGE OF STORYTELLING instead of Pulp Fiction the 1994 movie. A quick solution to this would be to include some other identifying features on the search string like the movie year, cast, genre, etc. However, a better solution for this would be to look through the Tomatometer score and retrieve the one with a Tomatometer score since popular movies tend to have those, unlike unknown unpopular movies. Nevertheless, this wouldn't solve the problem fully.
Accomplishments that we're proud of
The main thing we are most proud of with this project is how self-contained it is. The whole project runs all at once and is relatively simple, yet it handles so many data points in a quick and concise manner.
What we learned
Our team members learned several different Python packages, with a few members having little to no overall Python experience at the beginning.
What's next for ReelEyes - A Movie Review Visualizer
We have a couple of hypothetical expansions to this project. One is to include additional data visualizations or statistical analysis, such as a pie chart for the most frequently used words or visualizations using the least frequently used words. Another is to implement similar projects for other media review sites, such as the user reviews for video games on Steam.
Built With
- beautiful-soup
- matplotlib
- pandas
- python
- selenium
- tkinter


Log in or sign up for Devpost to join the conversation.