-
-
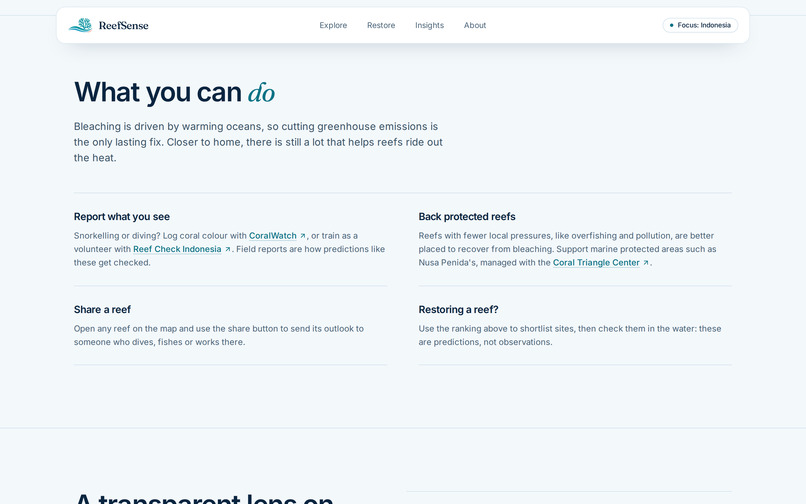
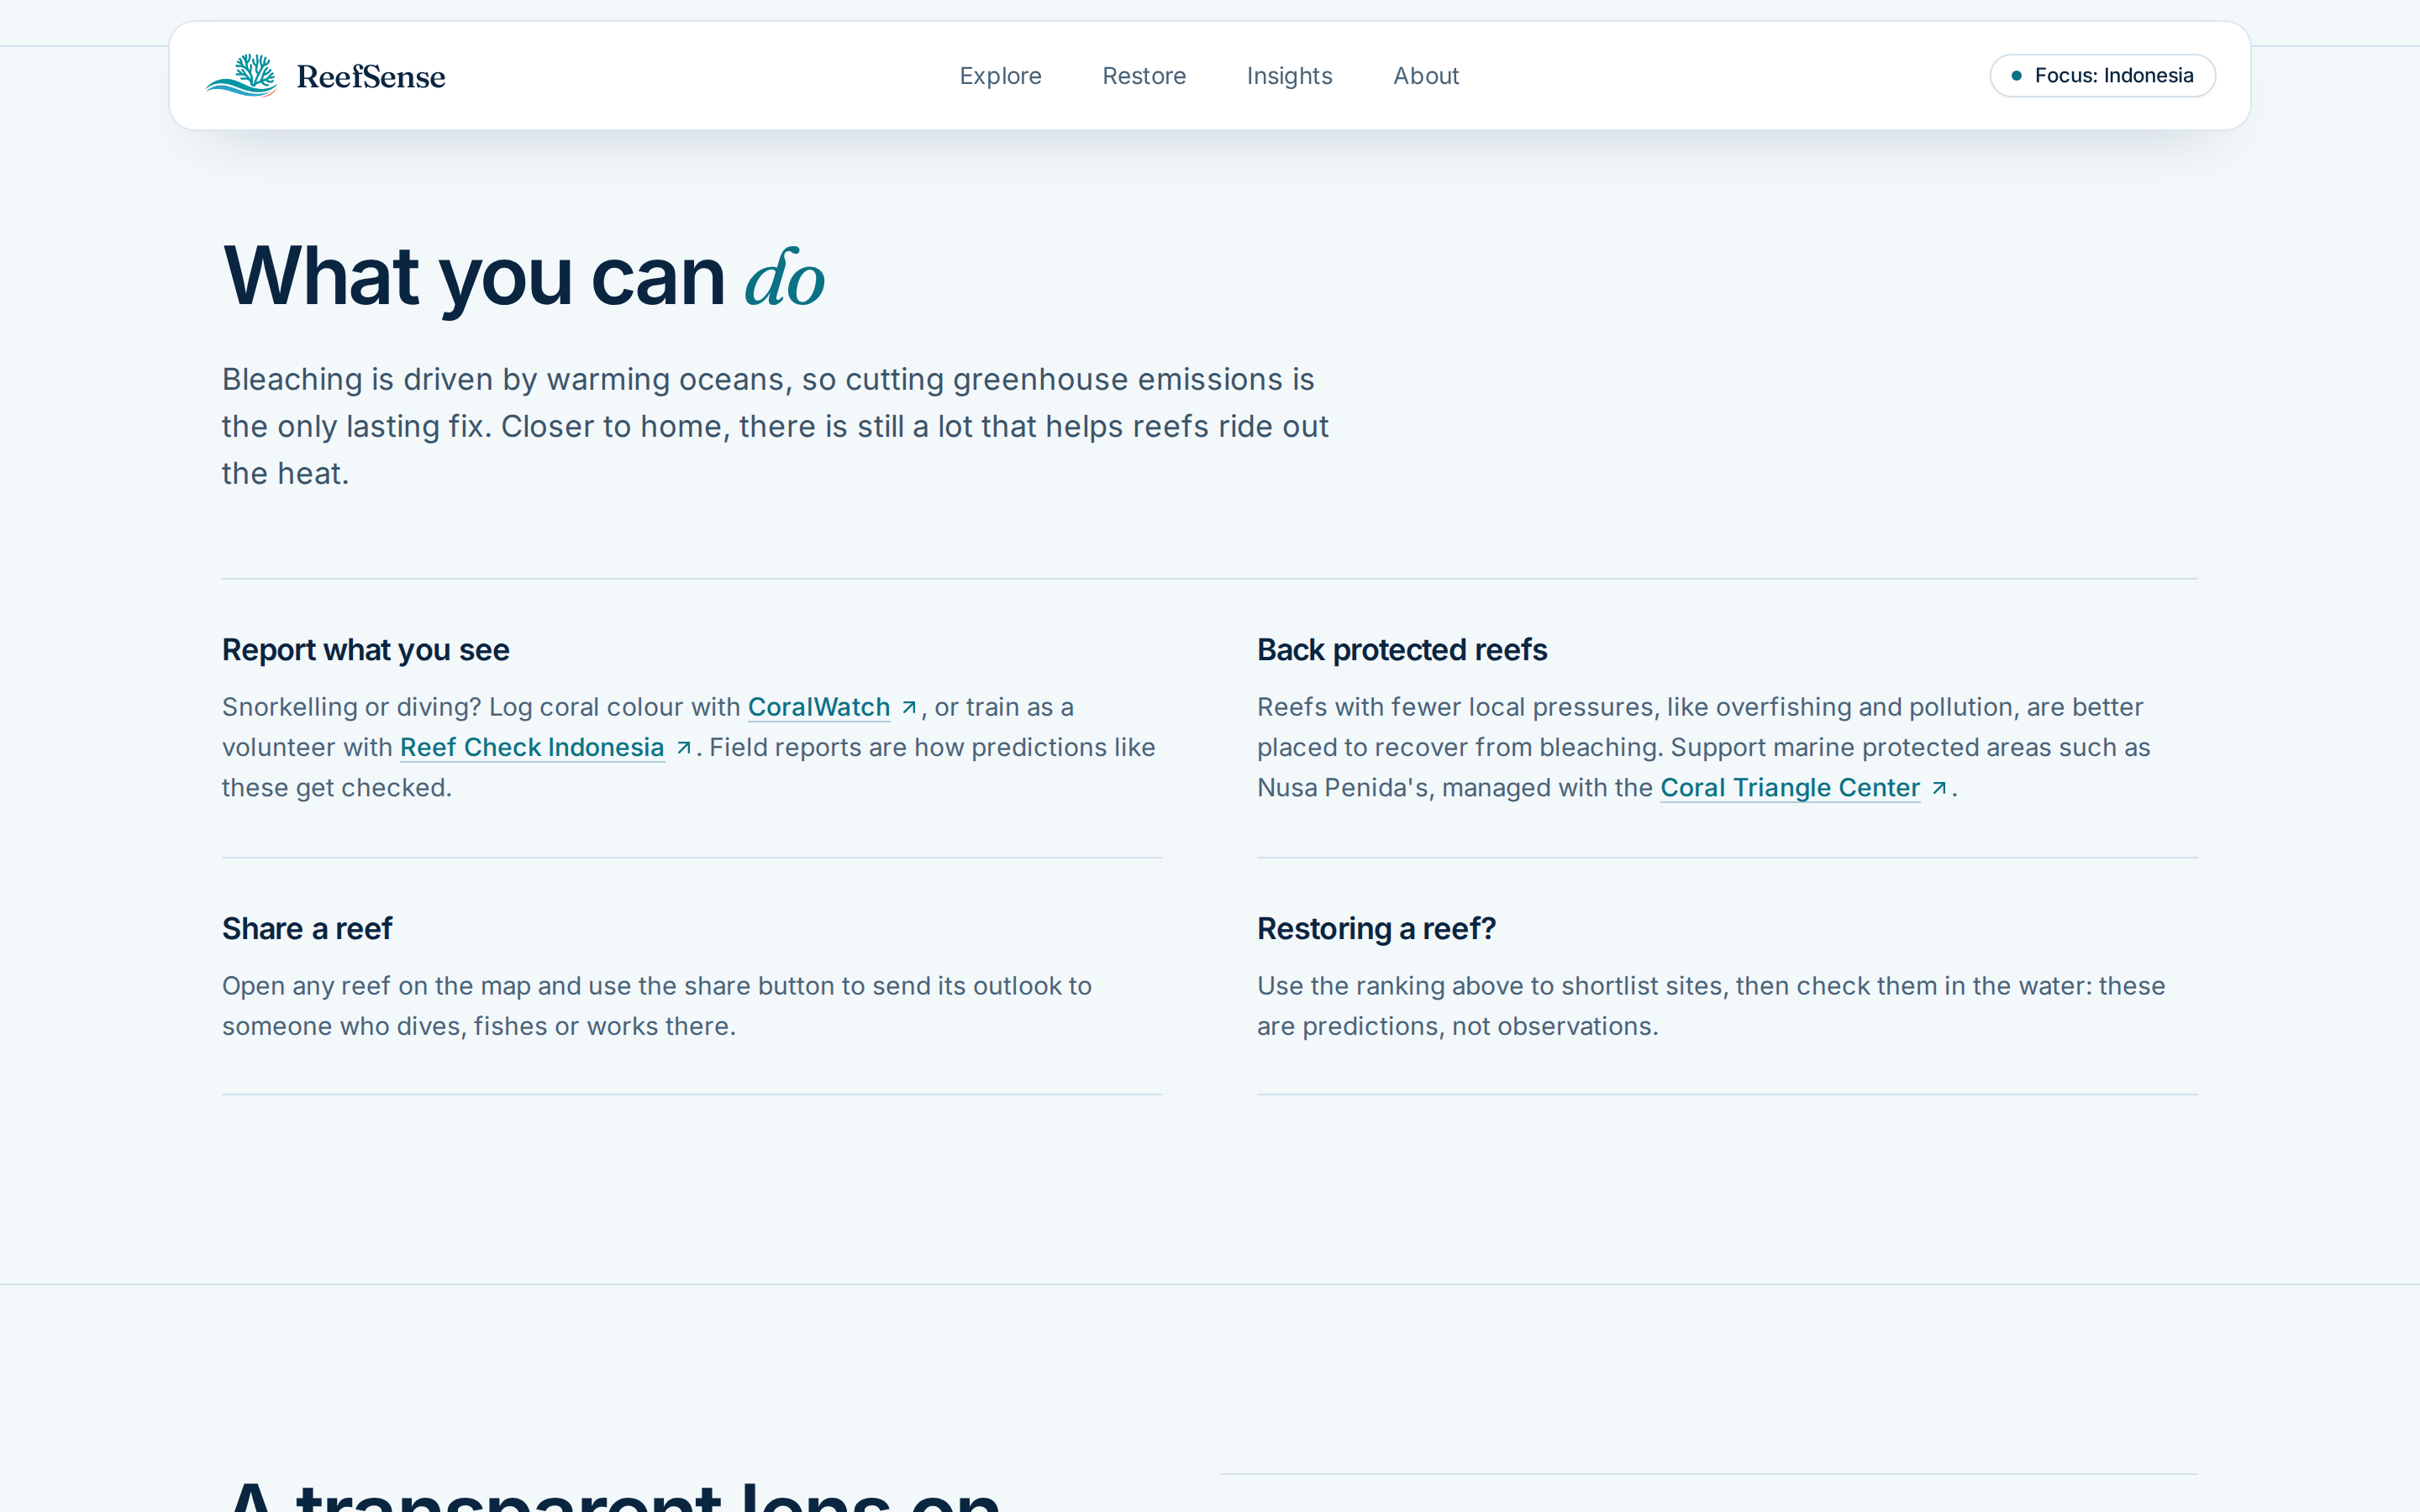
What you can do
-
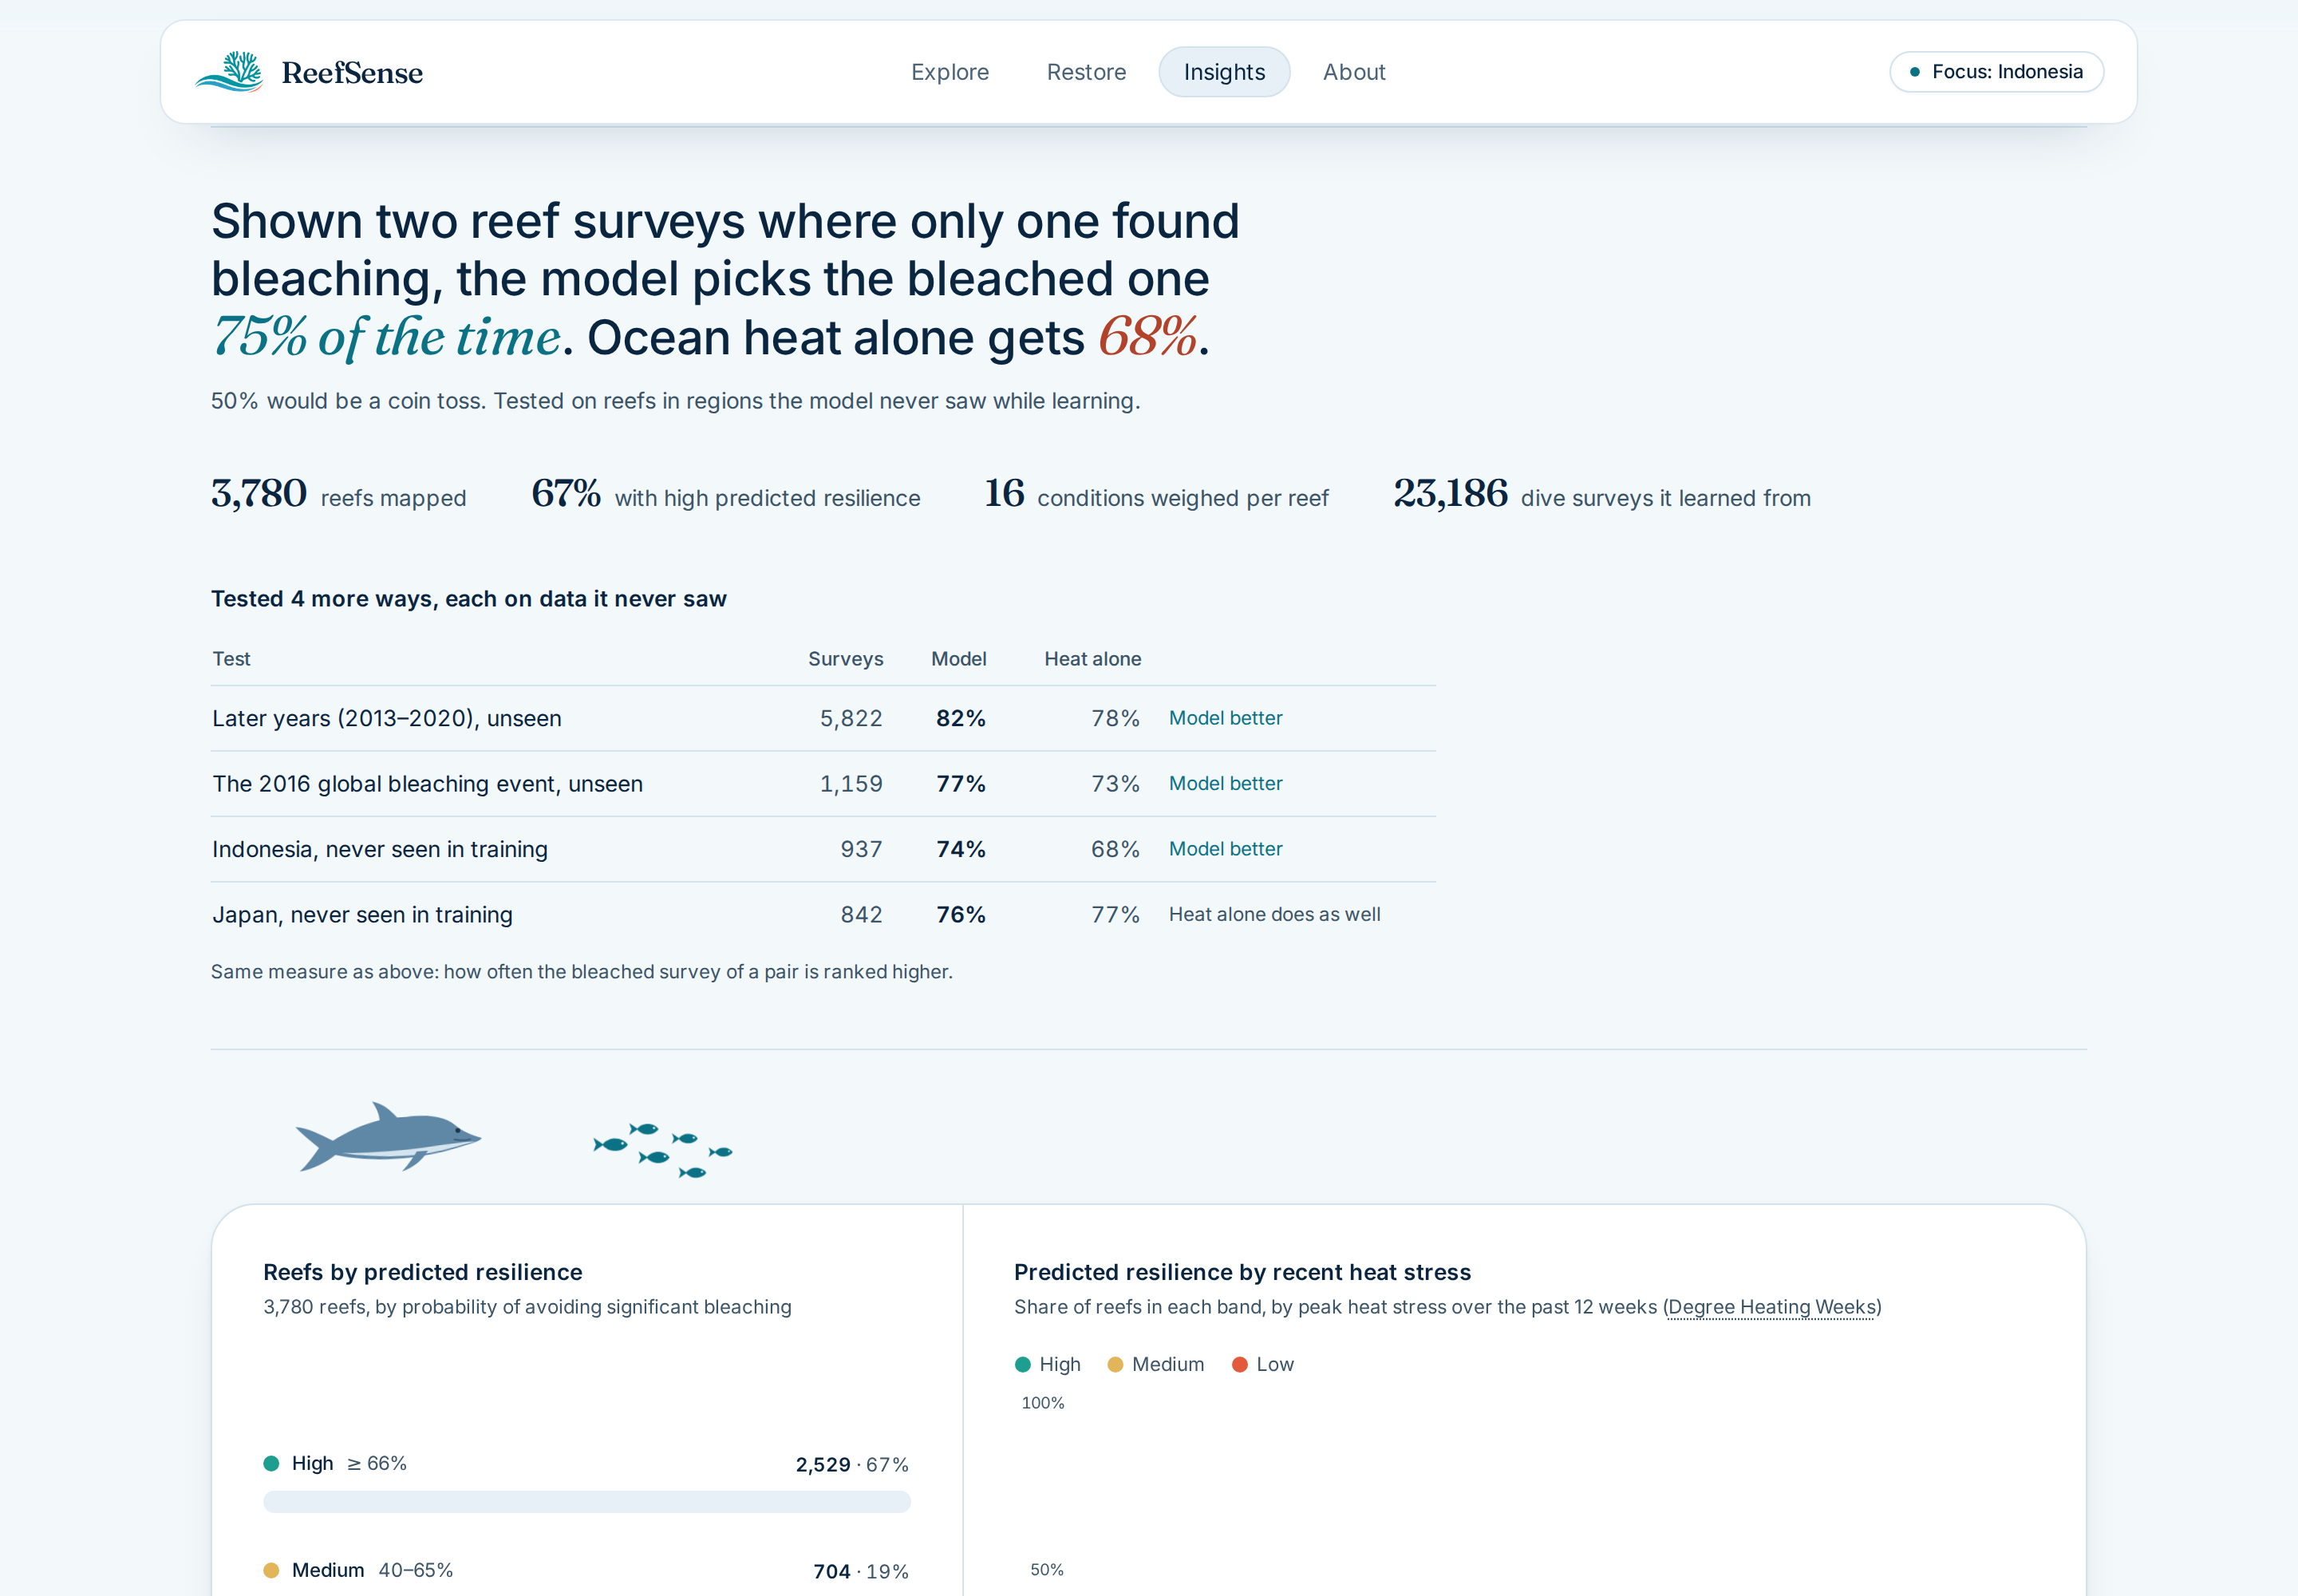
Validation
-
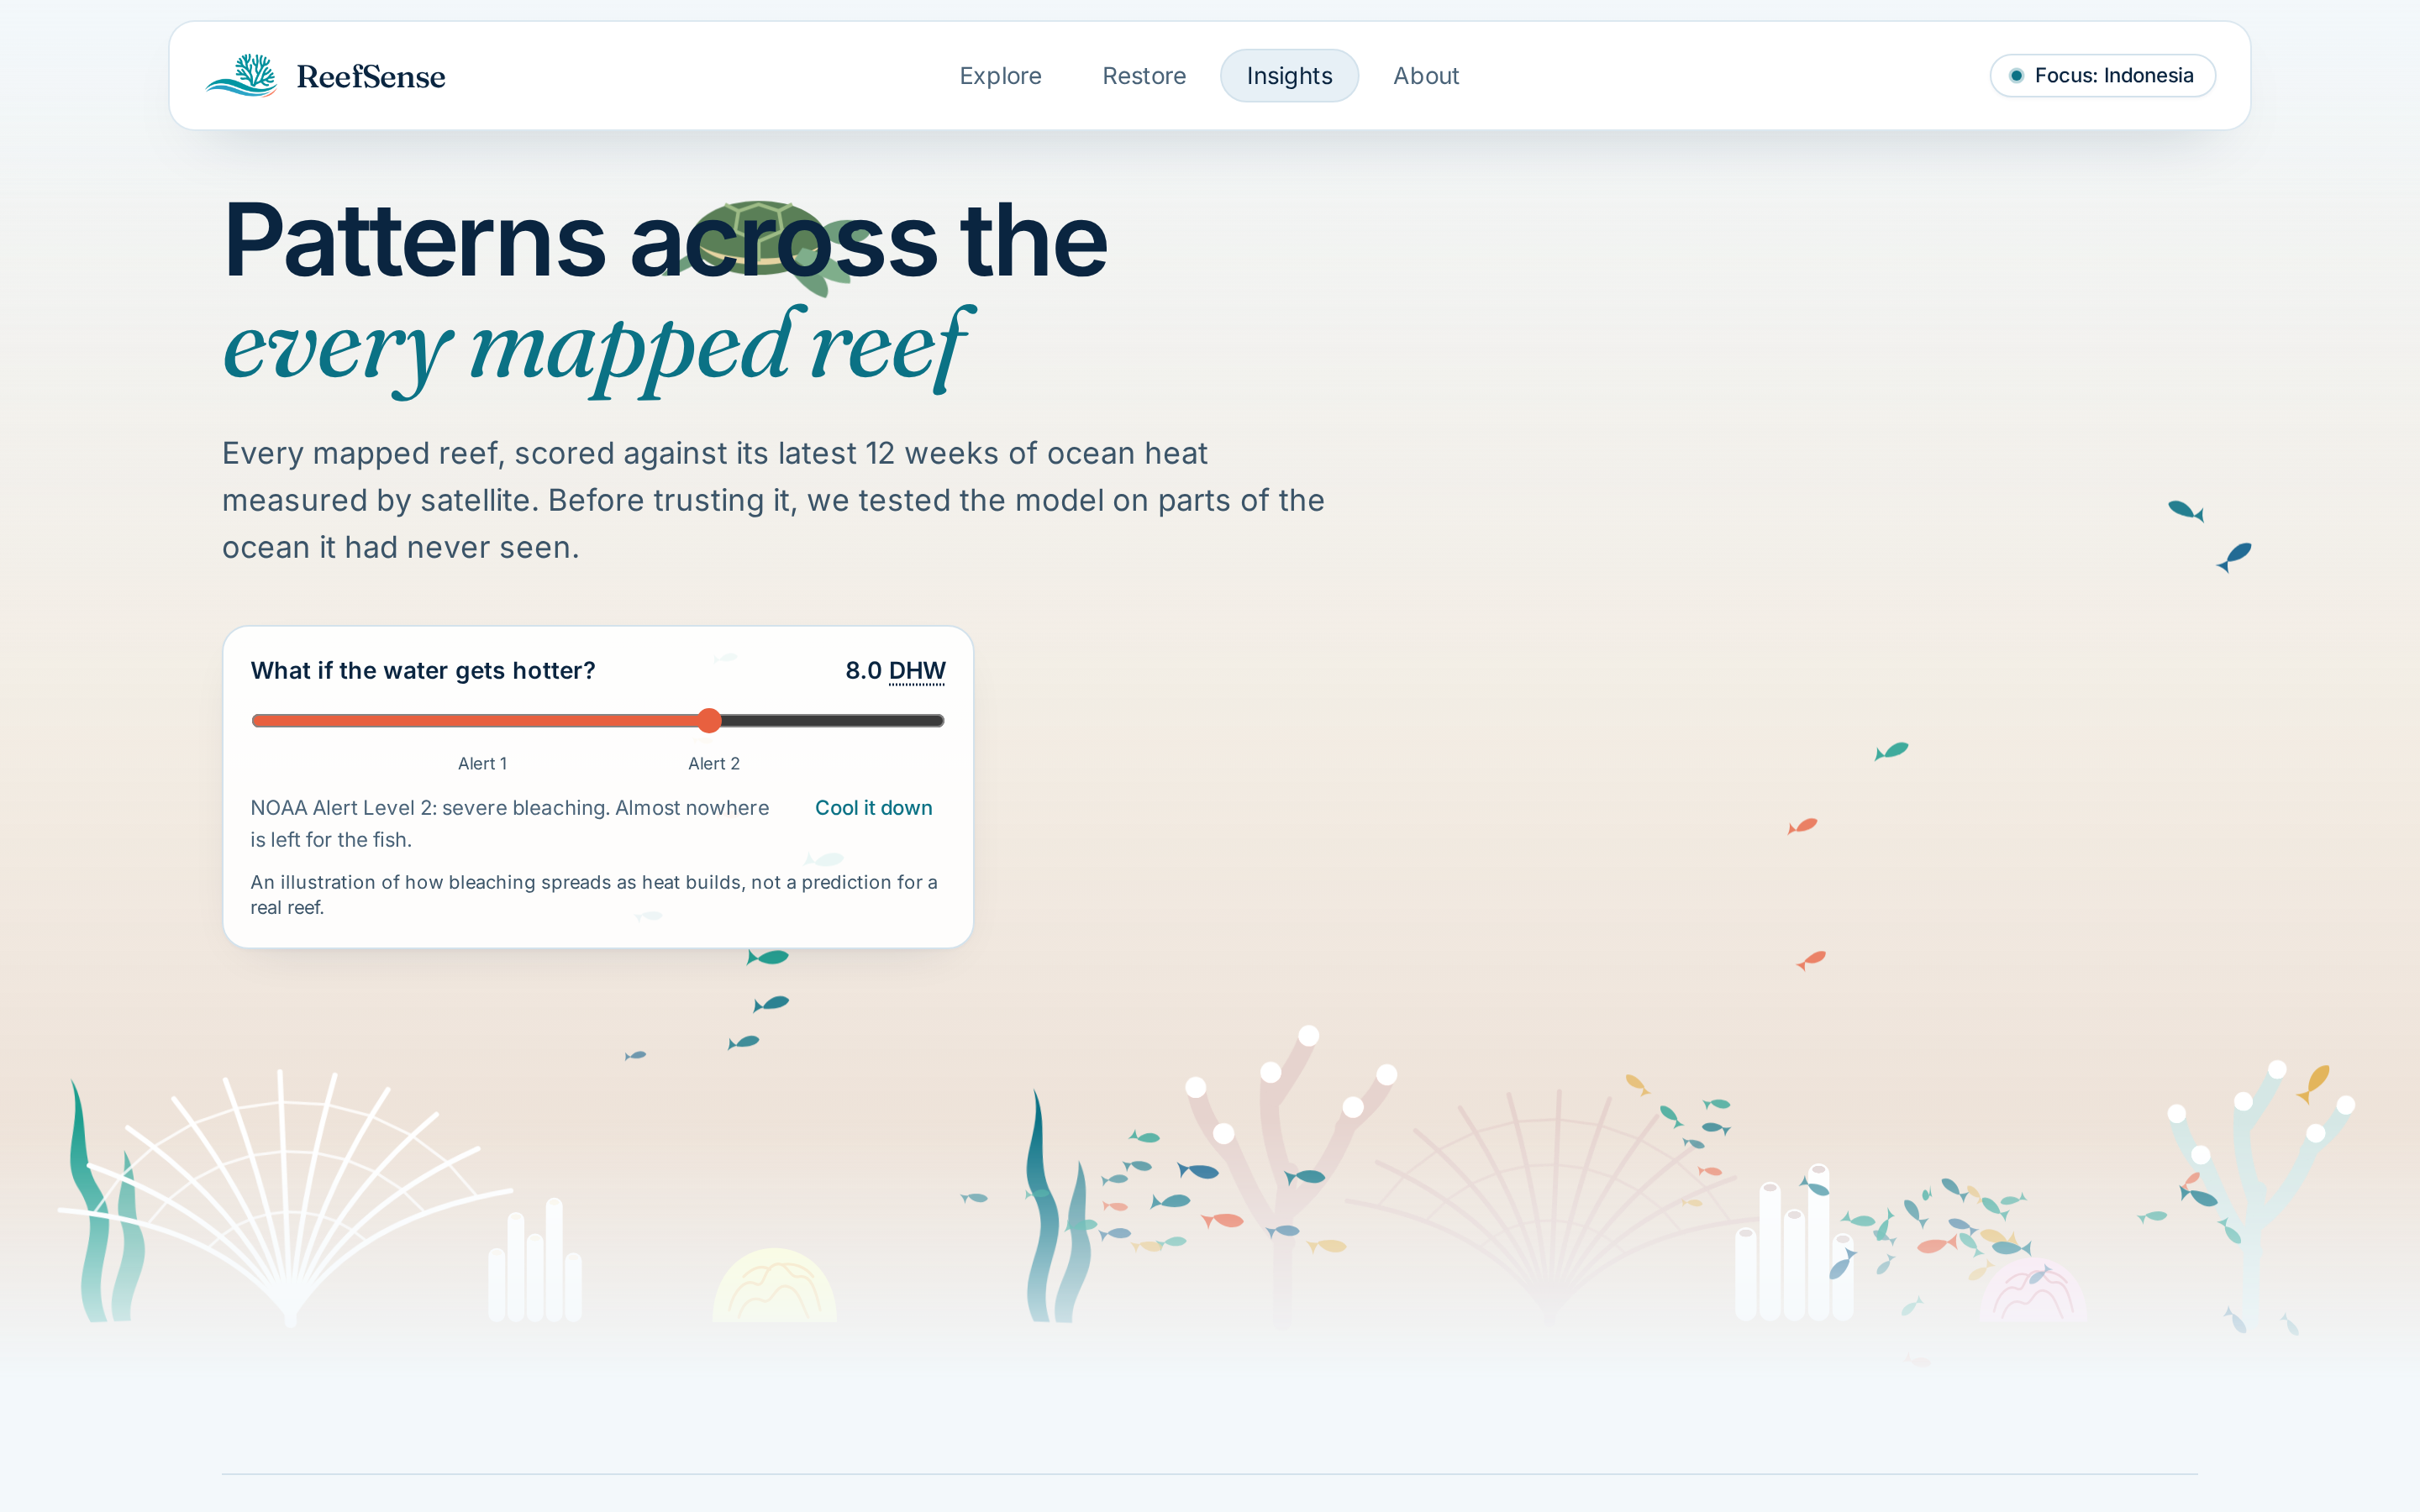
Heat illustration
-
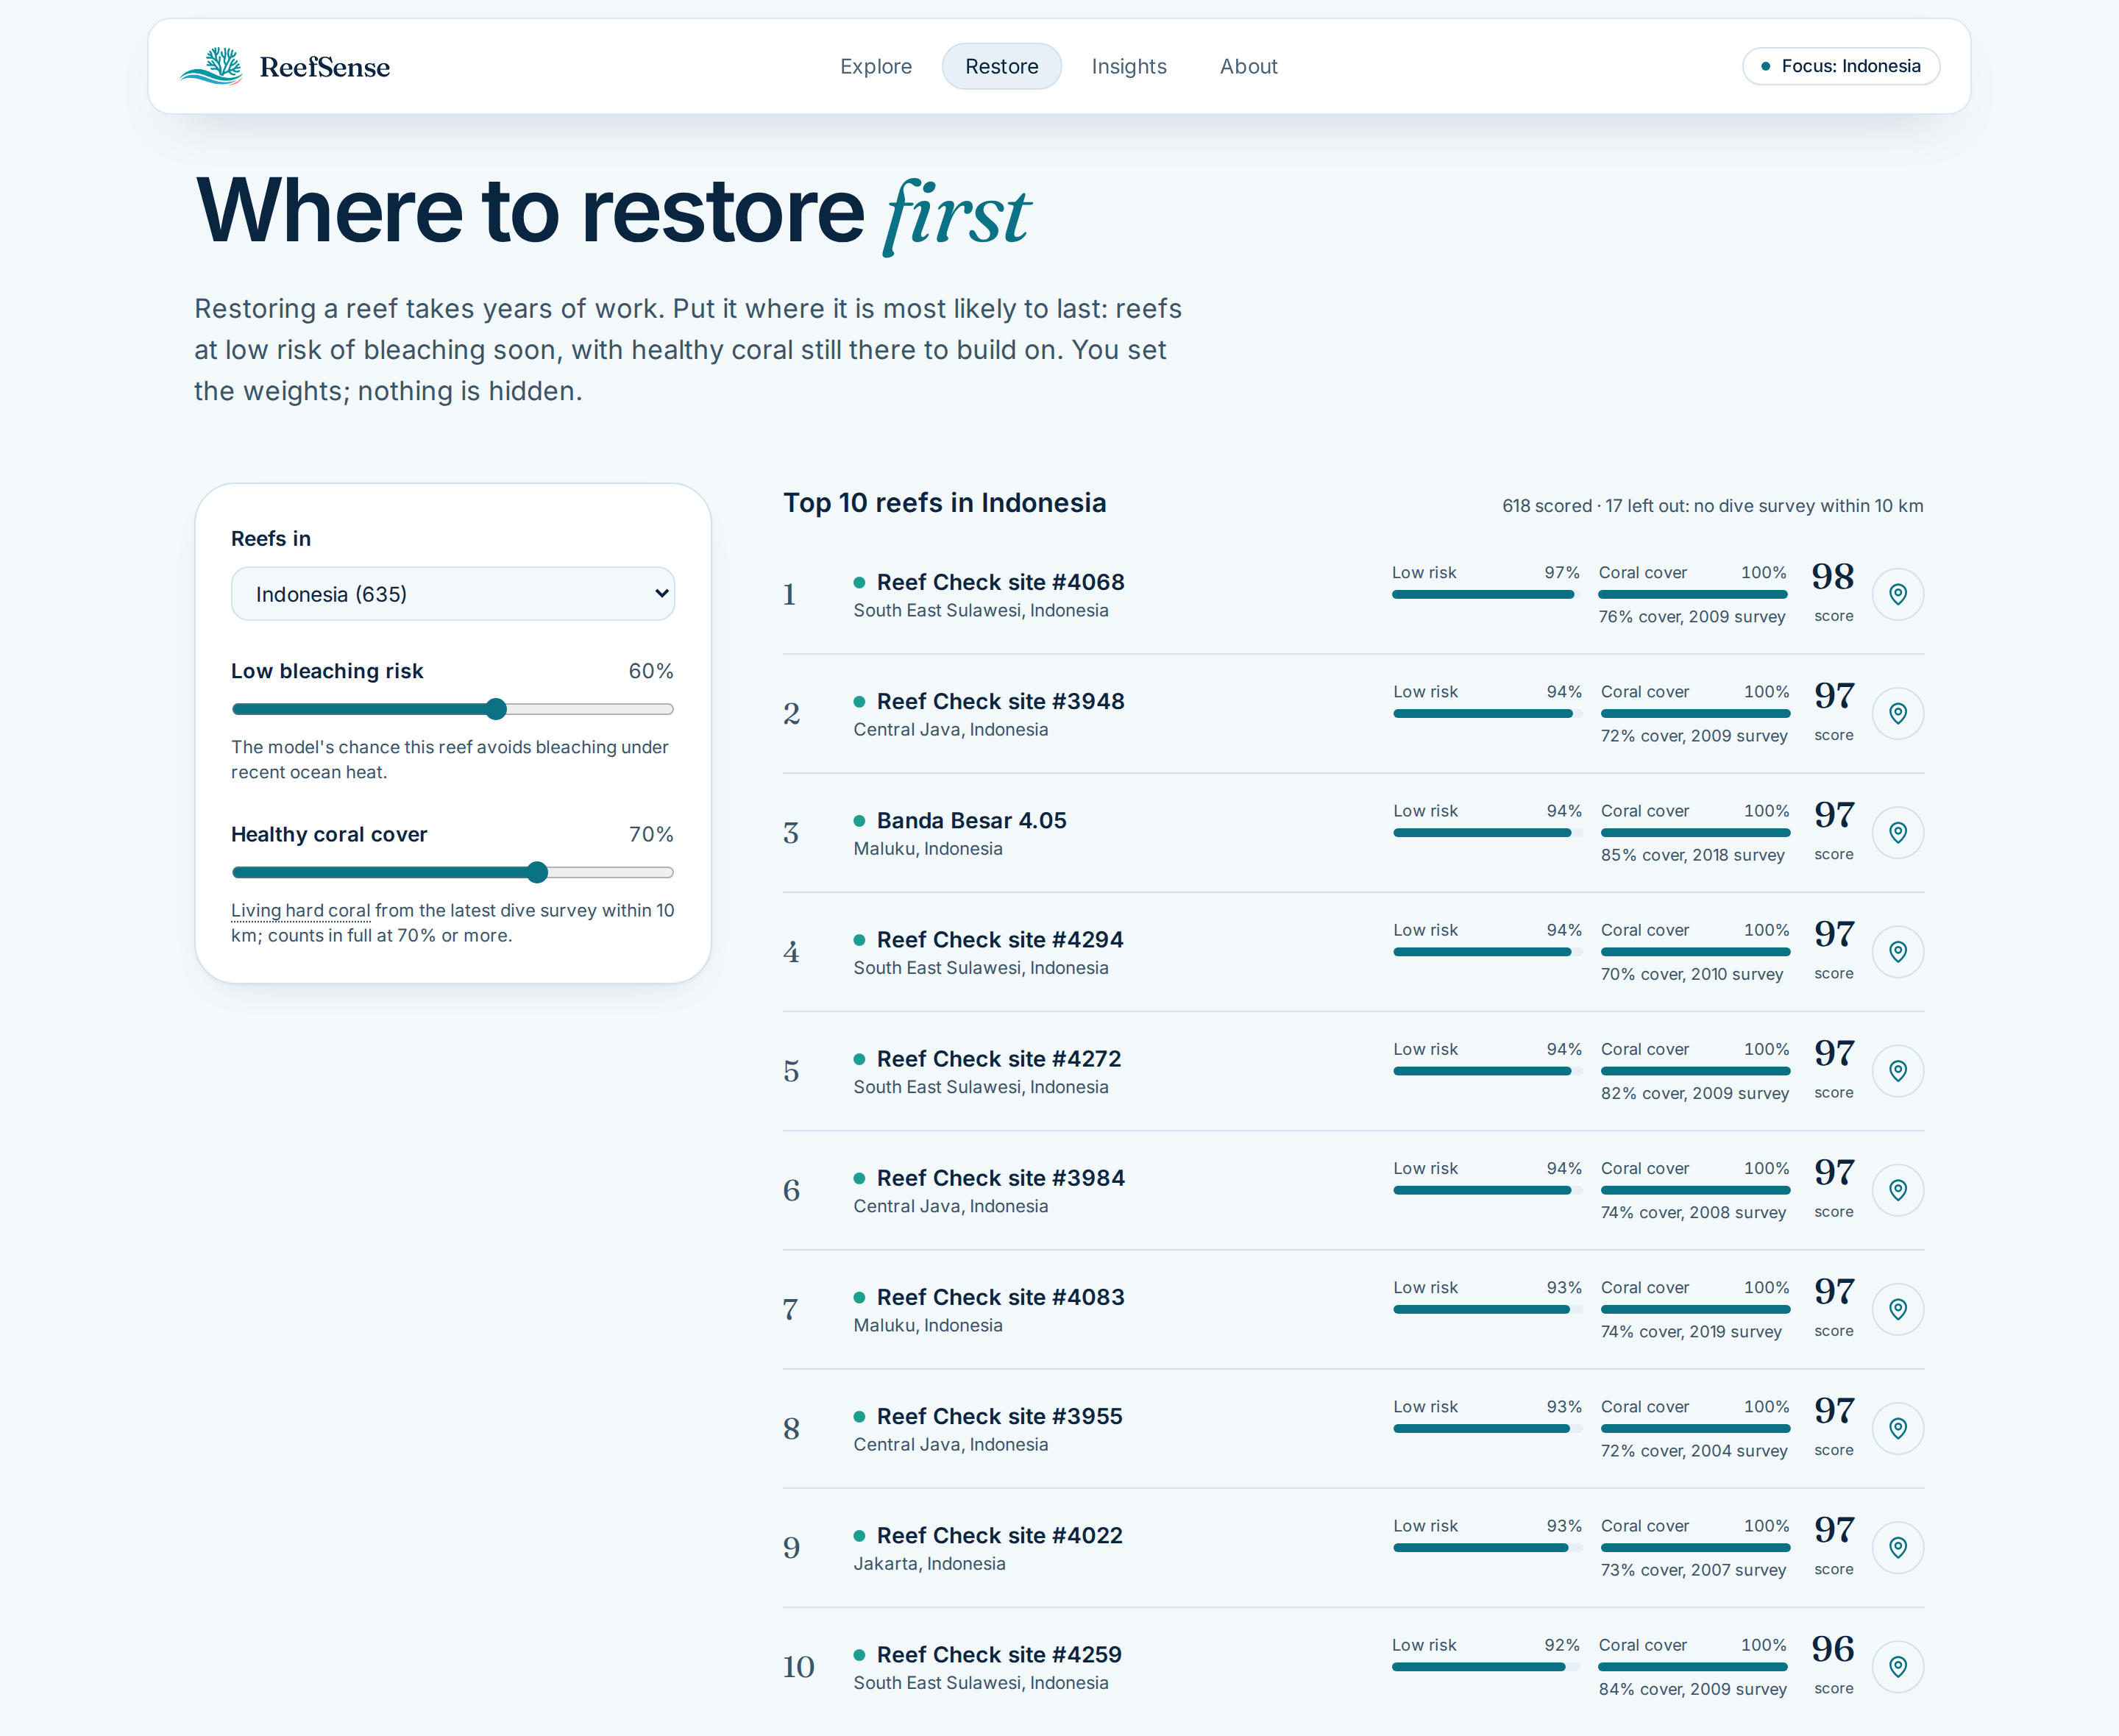
Restore Ranking
-
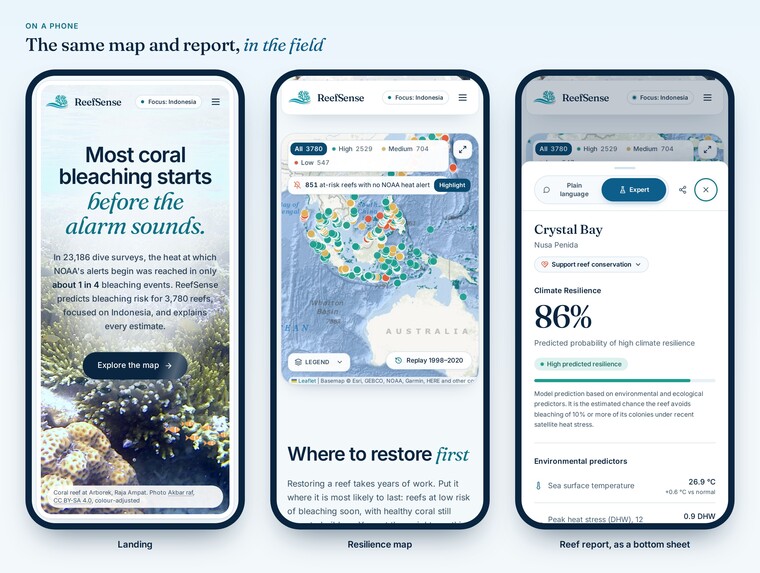
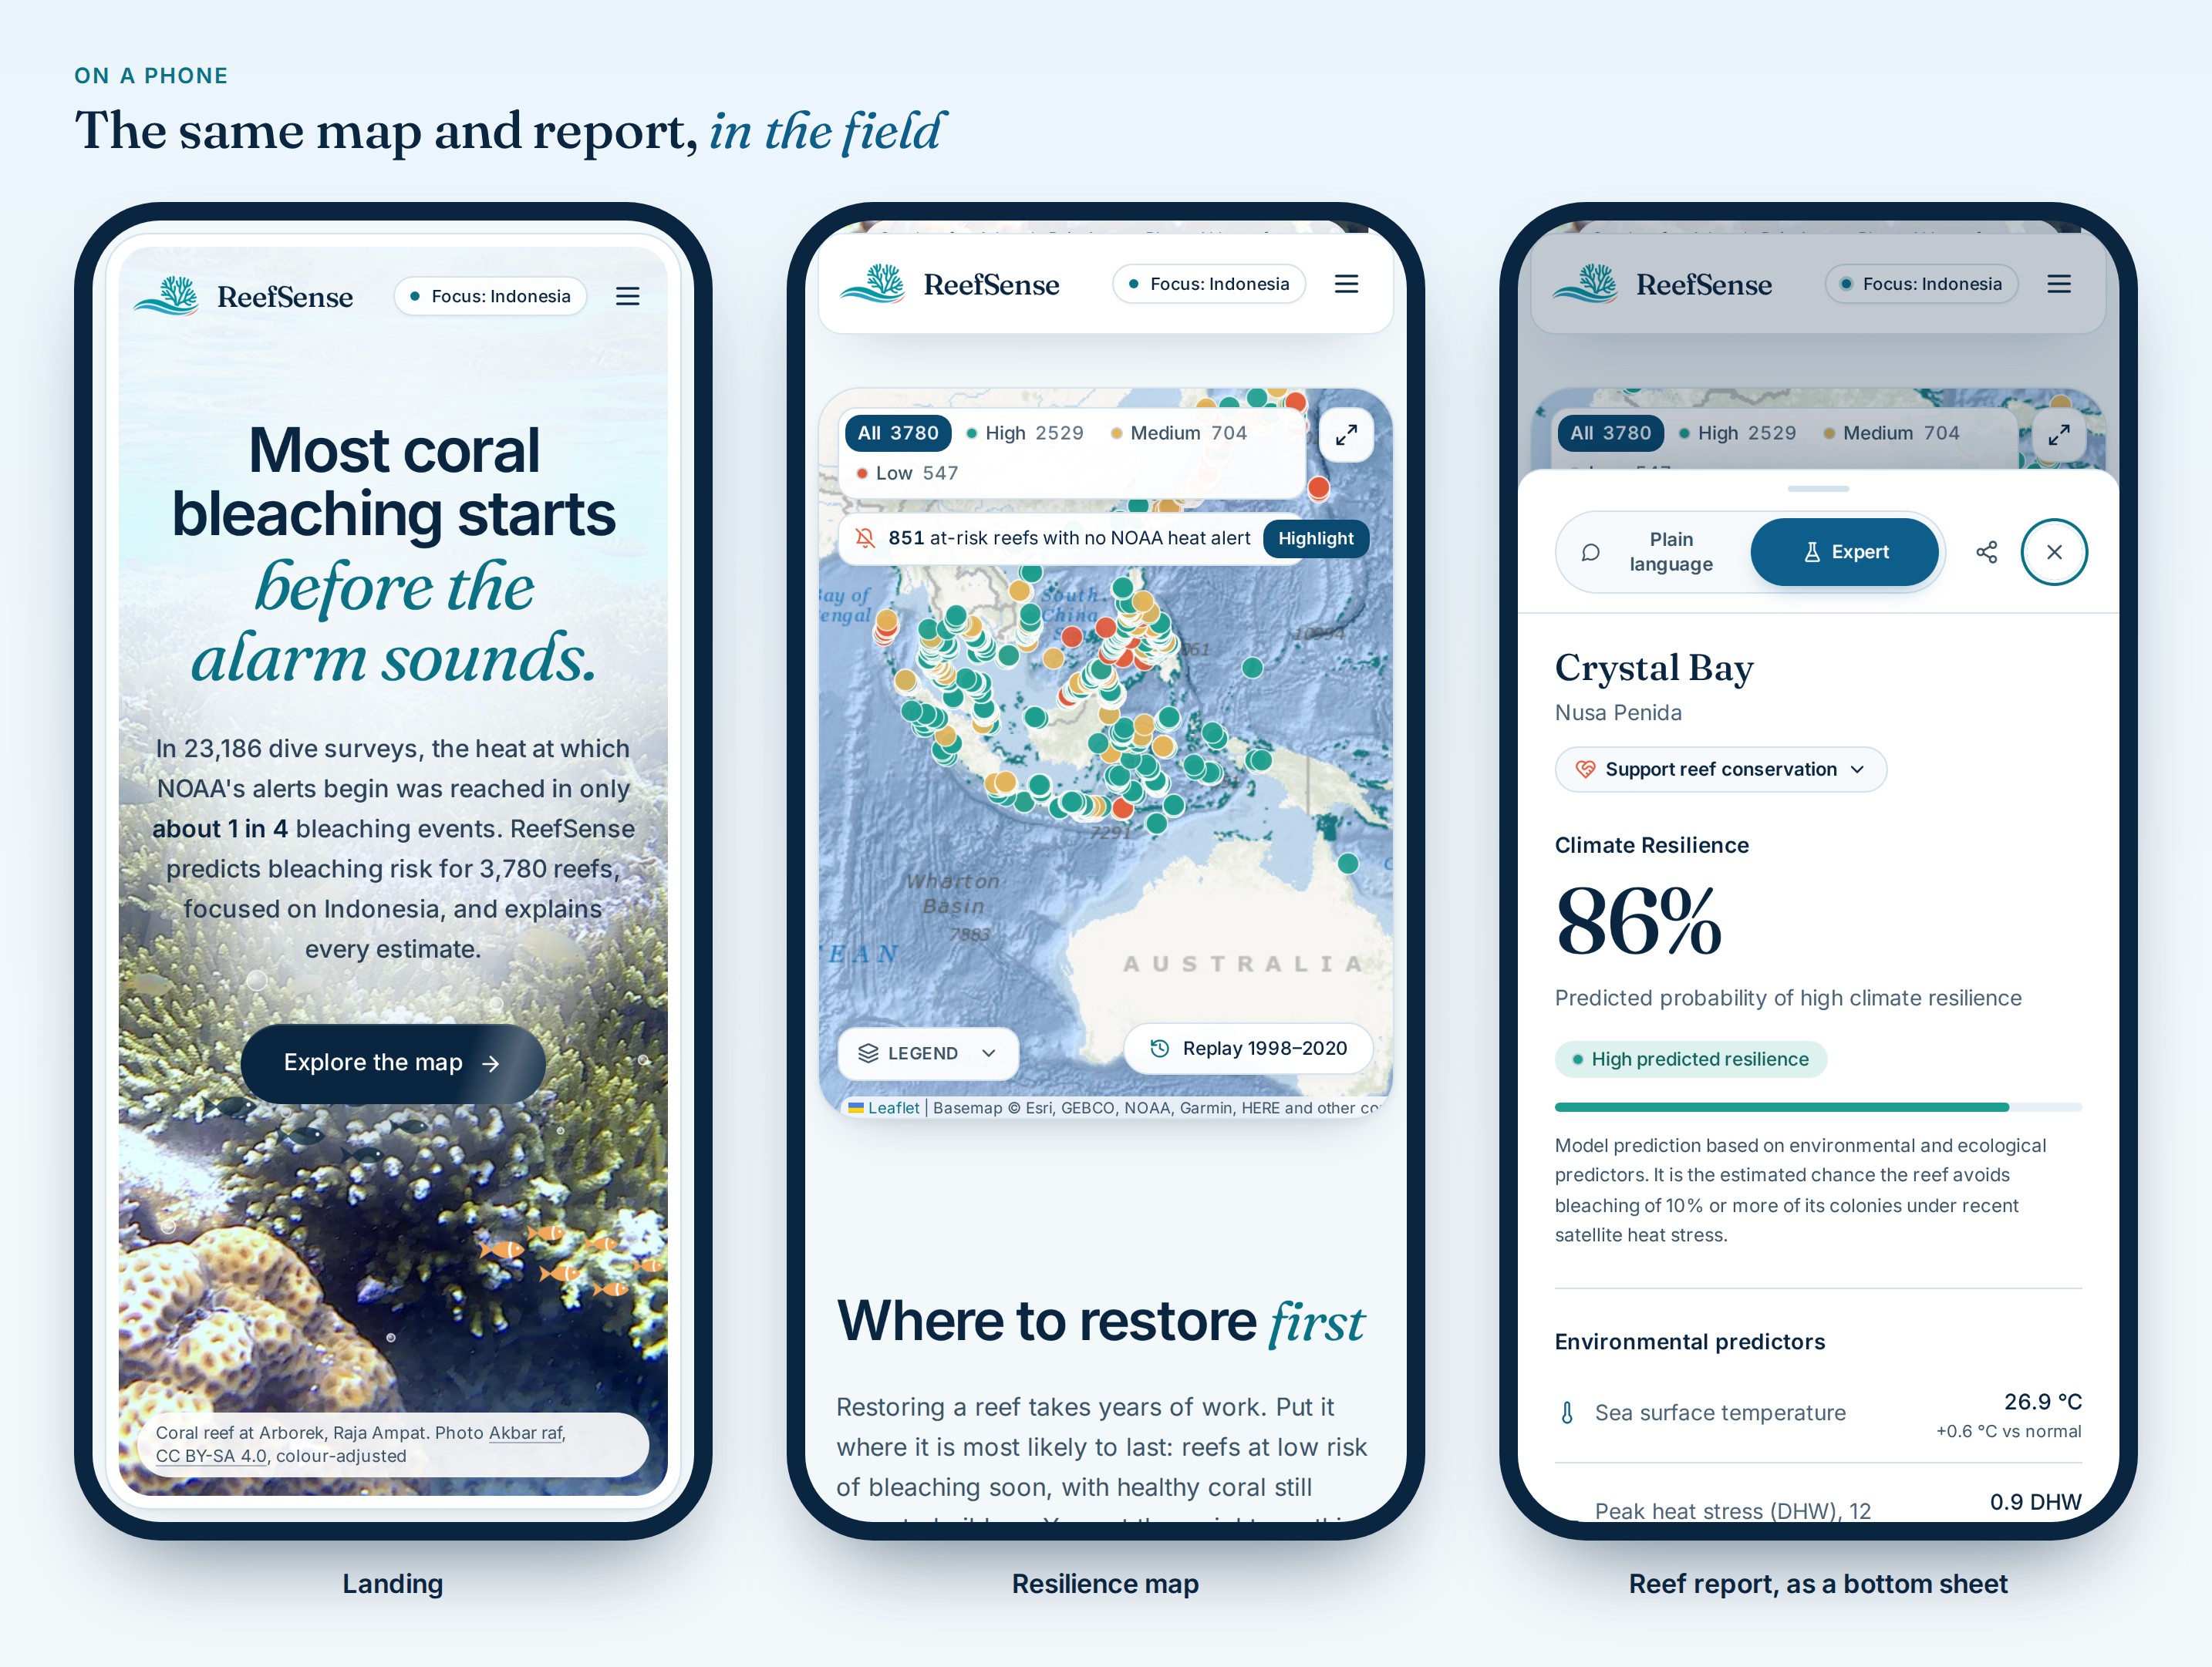
Mobile View
-
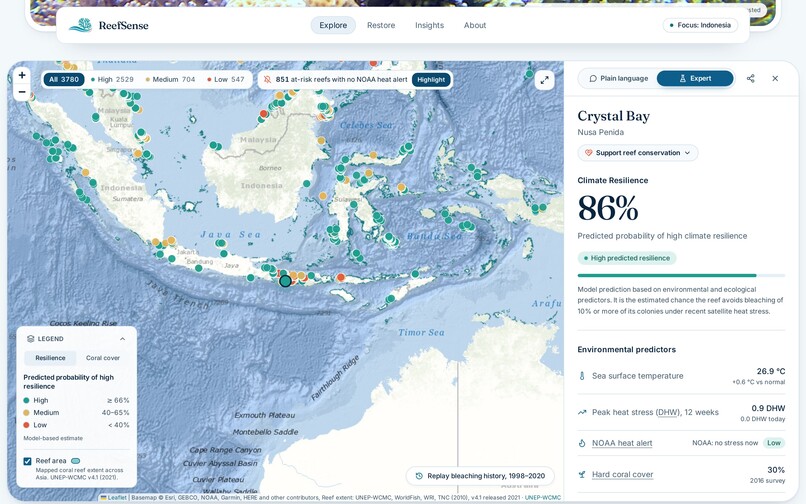
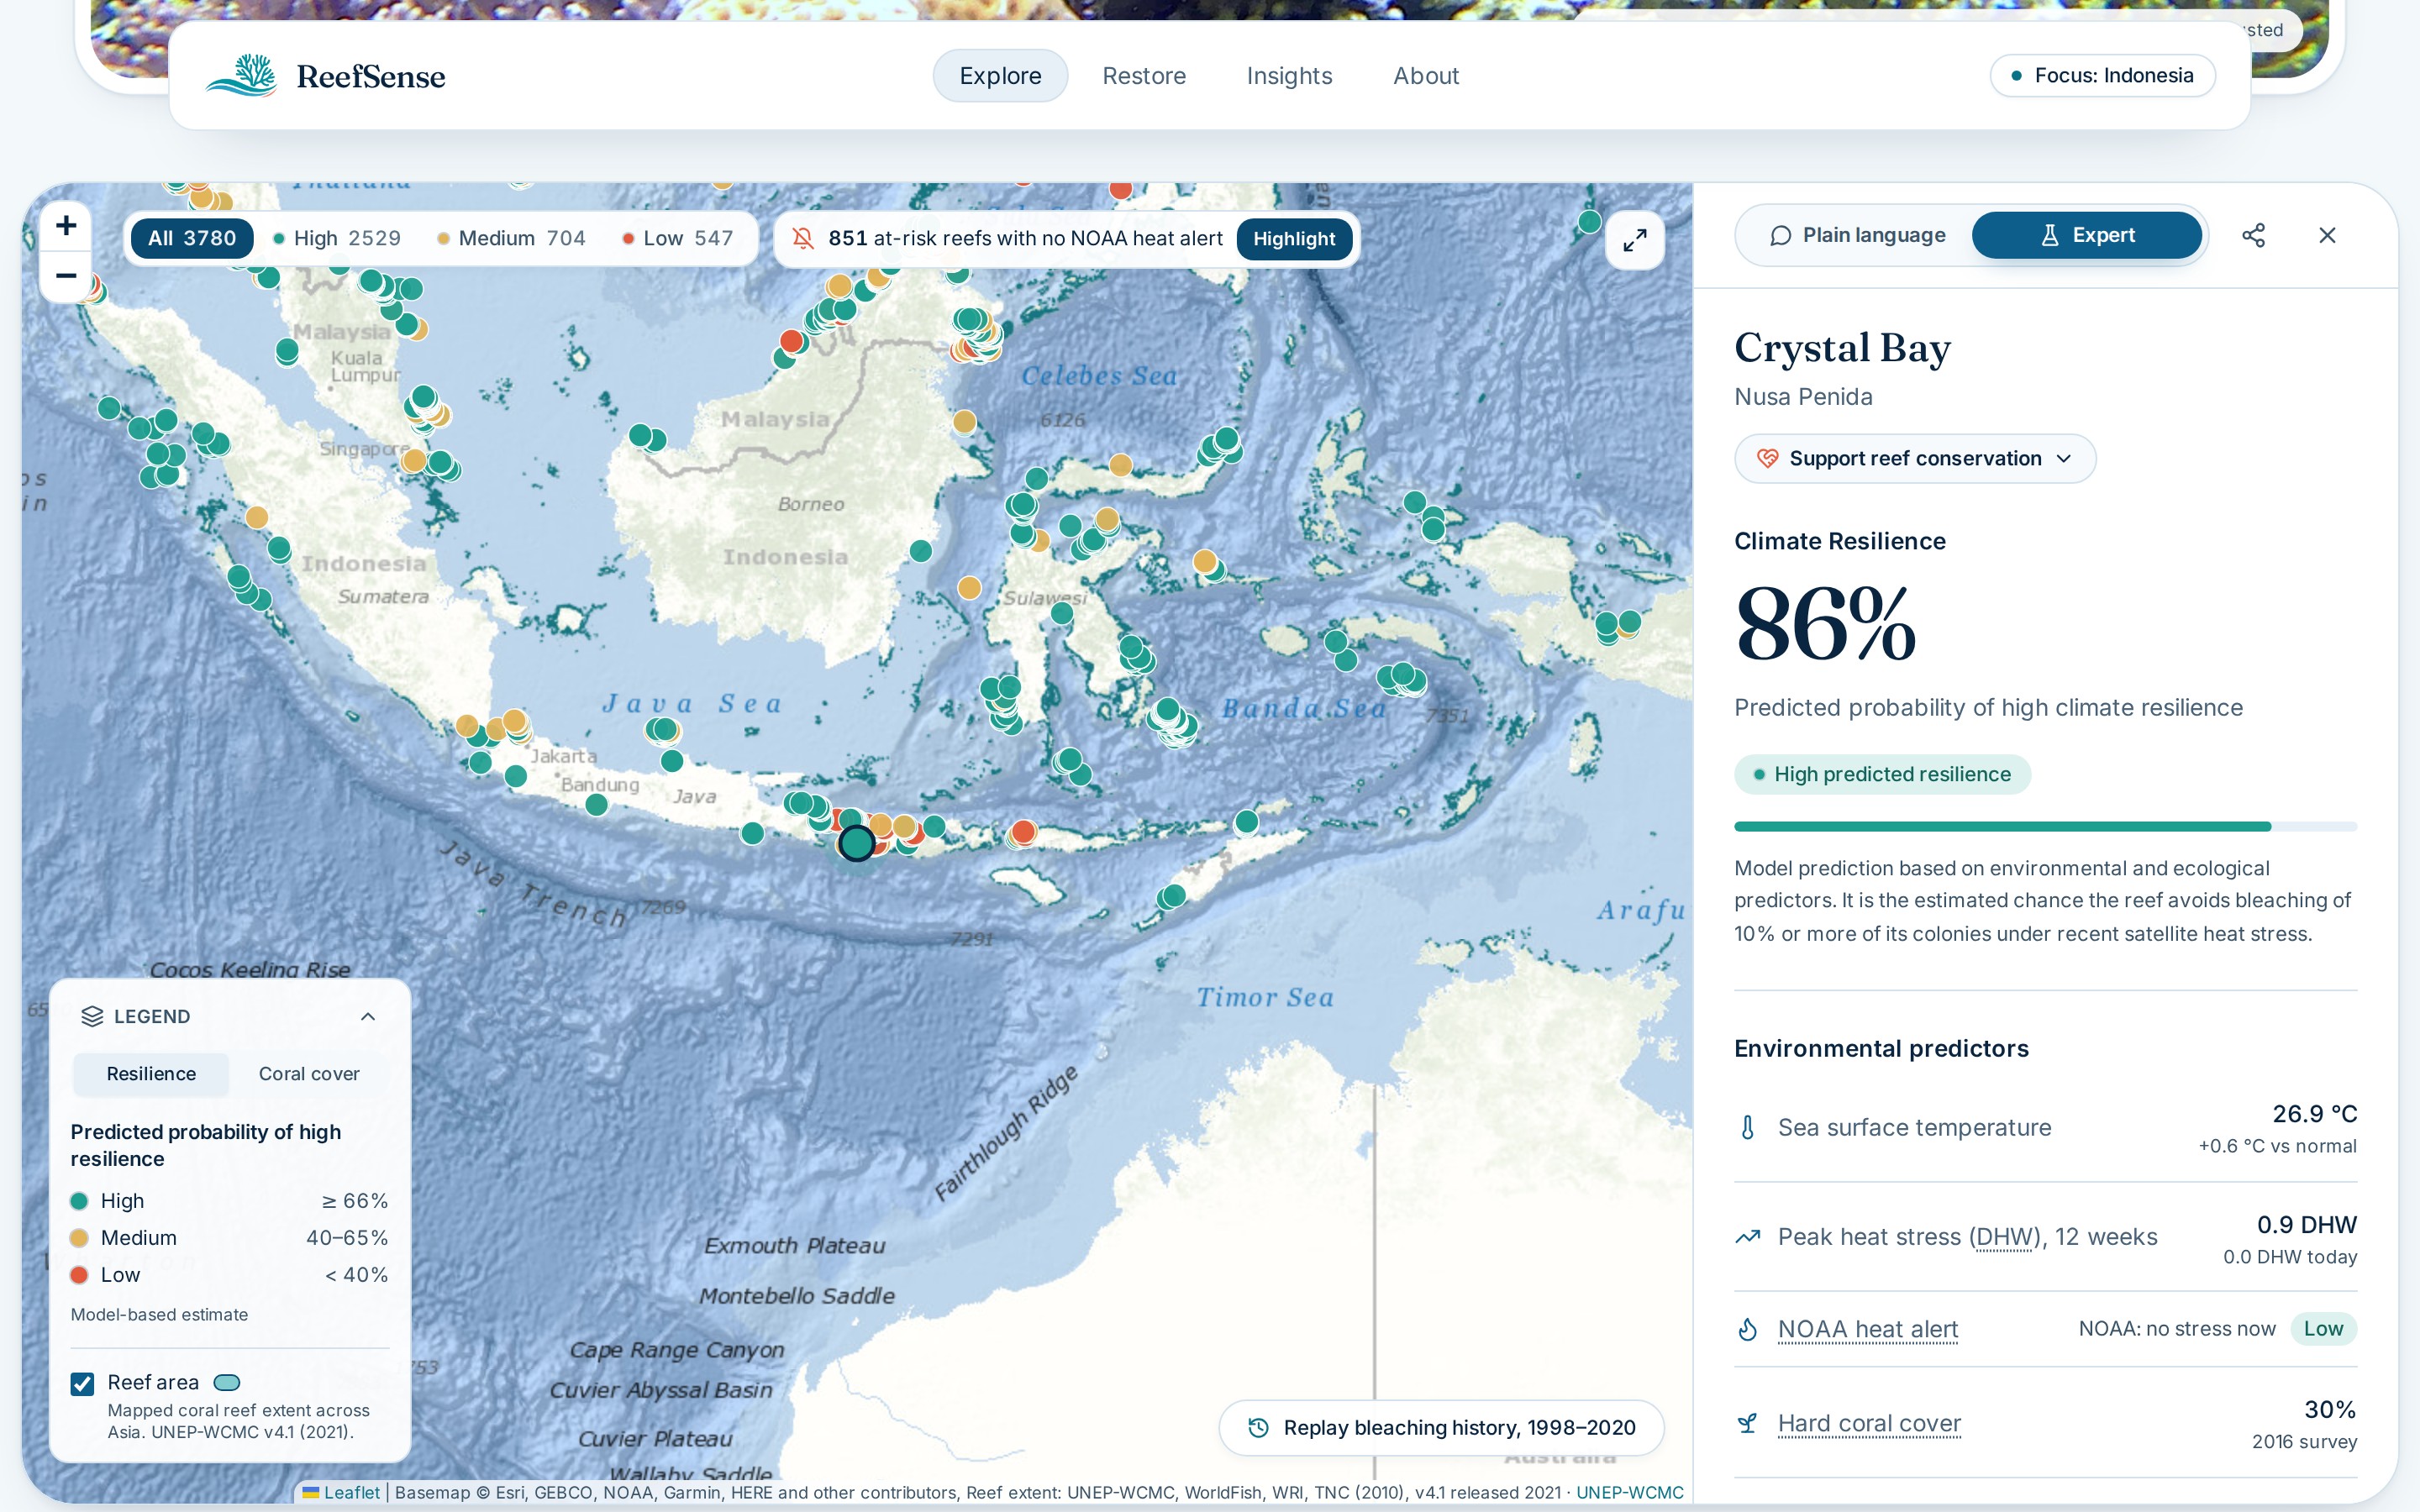
Reef Report
-
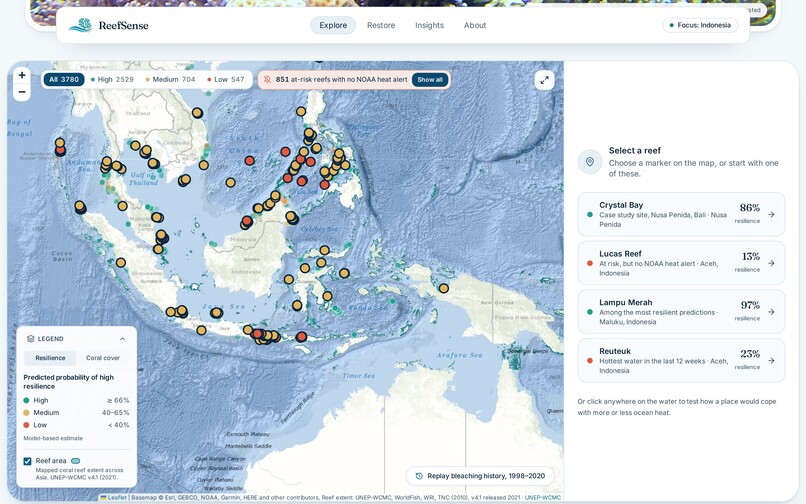
NOOA Gap
-
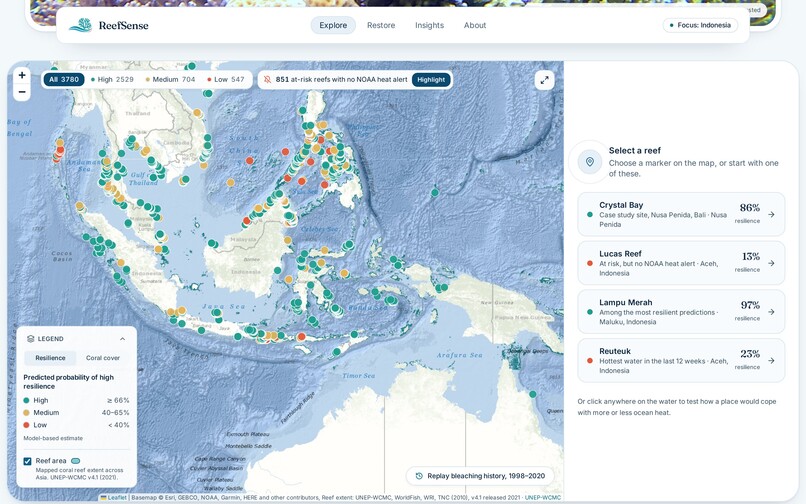
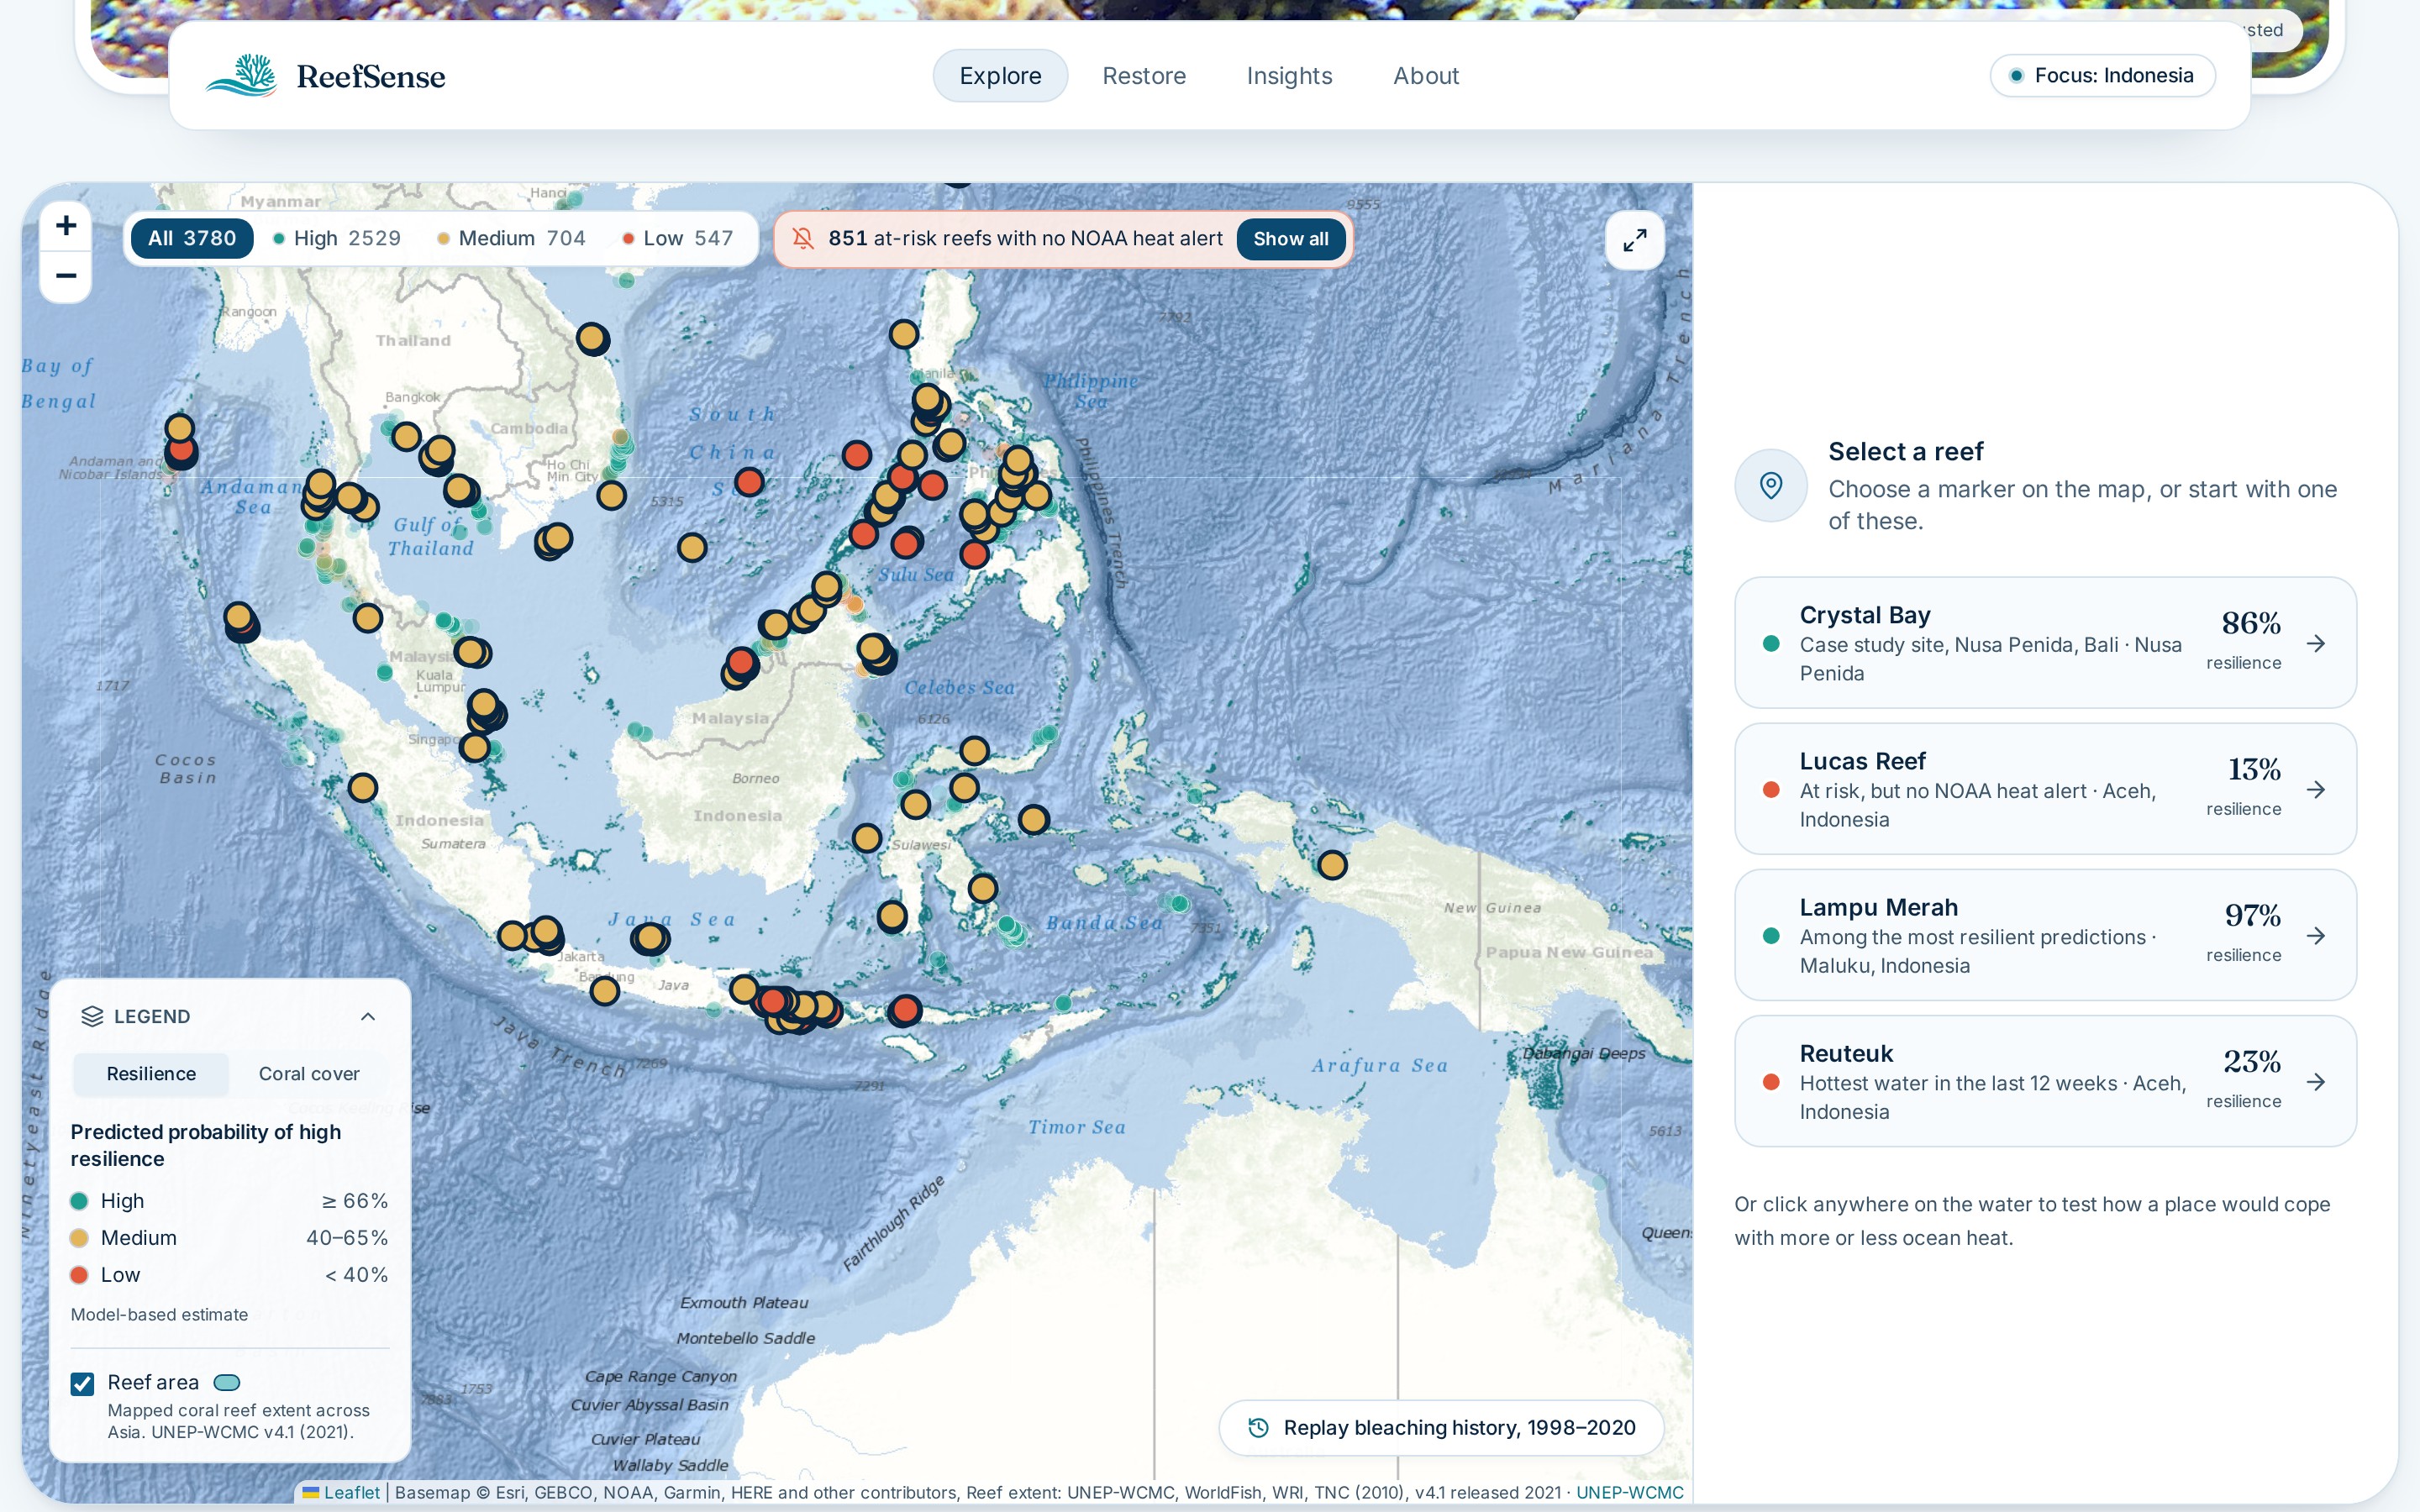
Reef Map
-
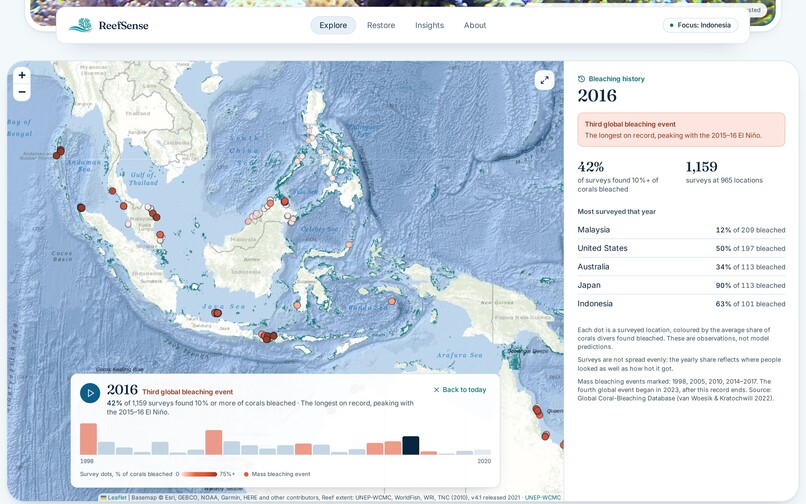
Reef Bleaching History
-
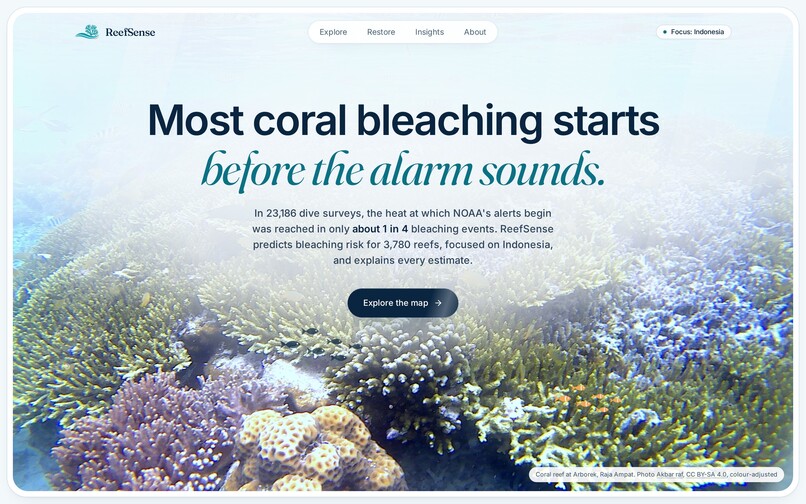
Landing Page
-
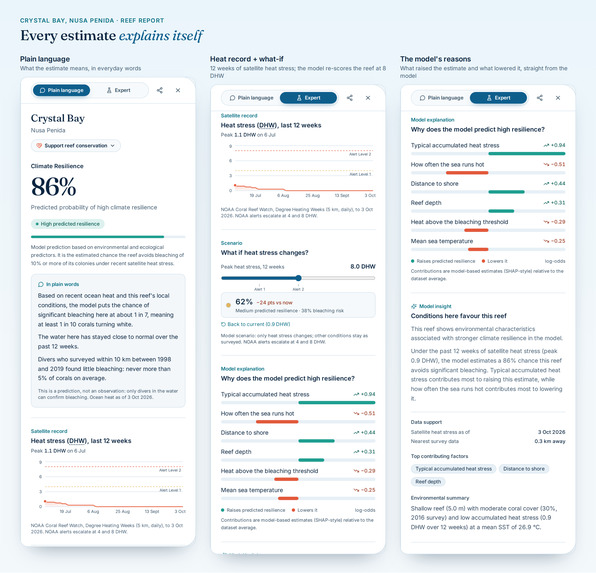
Reef Explanation
-
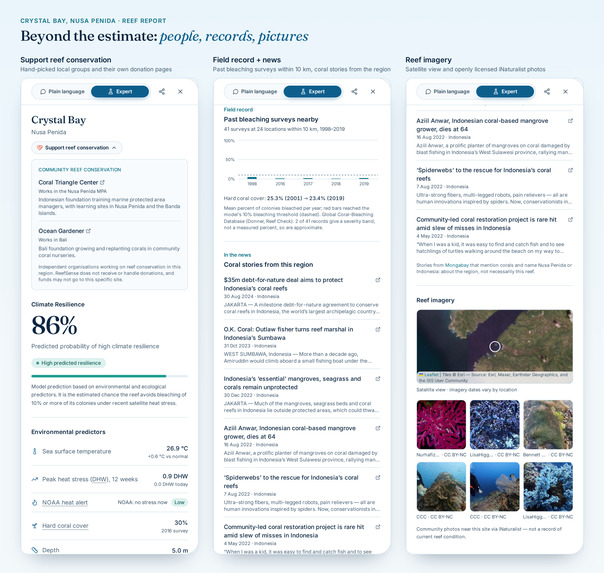
Reef context
-
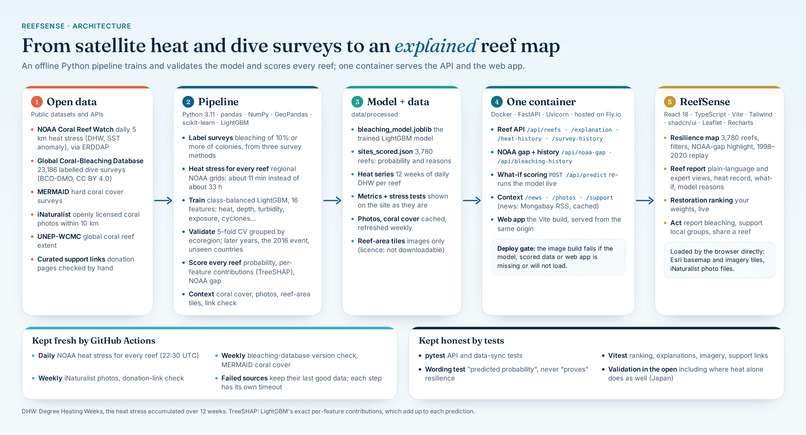
Reefsense Architecture
Inspiration
We're Antonio Owen Putra Amadeus and Glenn Putra Laymando, two computer science students from Indonesia. The idea started while we were doomscrolling. Between the usual memes, we kept seeing posts about reefs near home: coral that used to be full of colour had turned bone-white, and divers said the fish just weren't there anymore. These were places we grew up hearing about, and the whole ecosystem around them was falling apart. That hit different.
So we went looking for answers. It turns out reefs bleach when the ocean stays too hot for too long. The world's main warning system, NOAA Coral Reef Watch, tracks that heat in Degree Heating Weeks (DHW), which is basically how much hotter than usual the water has been, added up over the last 12 weeks. NOAA's alerts start escalating at 4 DHW.
Then we checked that against real data: 23,186 dive surveys from the Global Coral-Bleaching Database. The rule "DHW ≥ 4" only caught 26% of bleaching events. In about 3 out of 4 cases, the reef was already bleaching before the alarm went off. Kind of scary.
That gap matters a lot in Indonesia, right at the heart of the Coral Triangle and home to some of the richest reefs on the planet. The people trying to save them, like local restoration teams, park rangers and dive communities, usually run on tiny budgets, and restoring a reef takes years. They need to know two things:
- which reefs are at risk right now, even when there's no official alert;
- where their effort is most likely to last.
We're not marine biologists, but we can build things. So we built ReefSense in 7 days to help people actually see what's happening to their reefs, to warn earlier than heat alerts alone, and to help limited time and money go where it counts. We tried to do it honestly: every estimate shows its reasons, and we show where our model doesn't beat the existing alert too. If it gets more people paying attention to the reefs back home, that's already a win for us.
Problem statement and target users
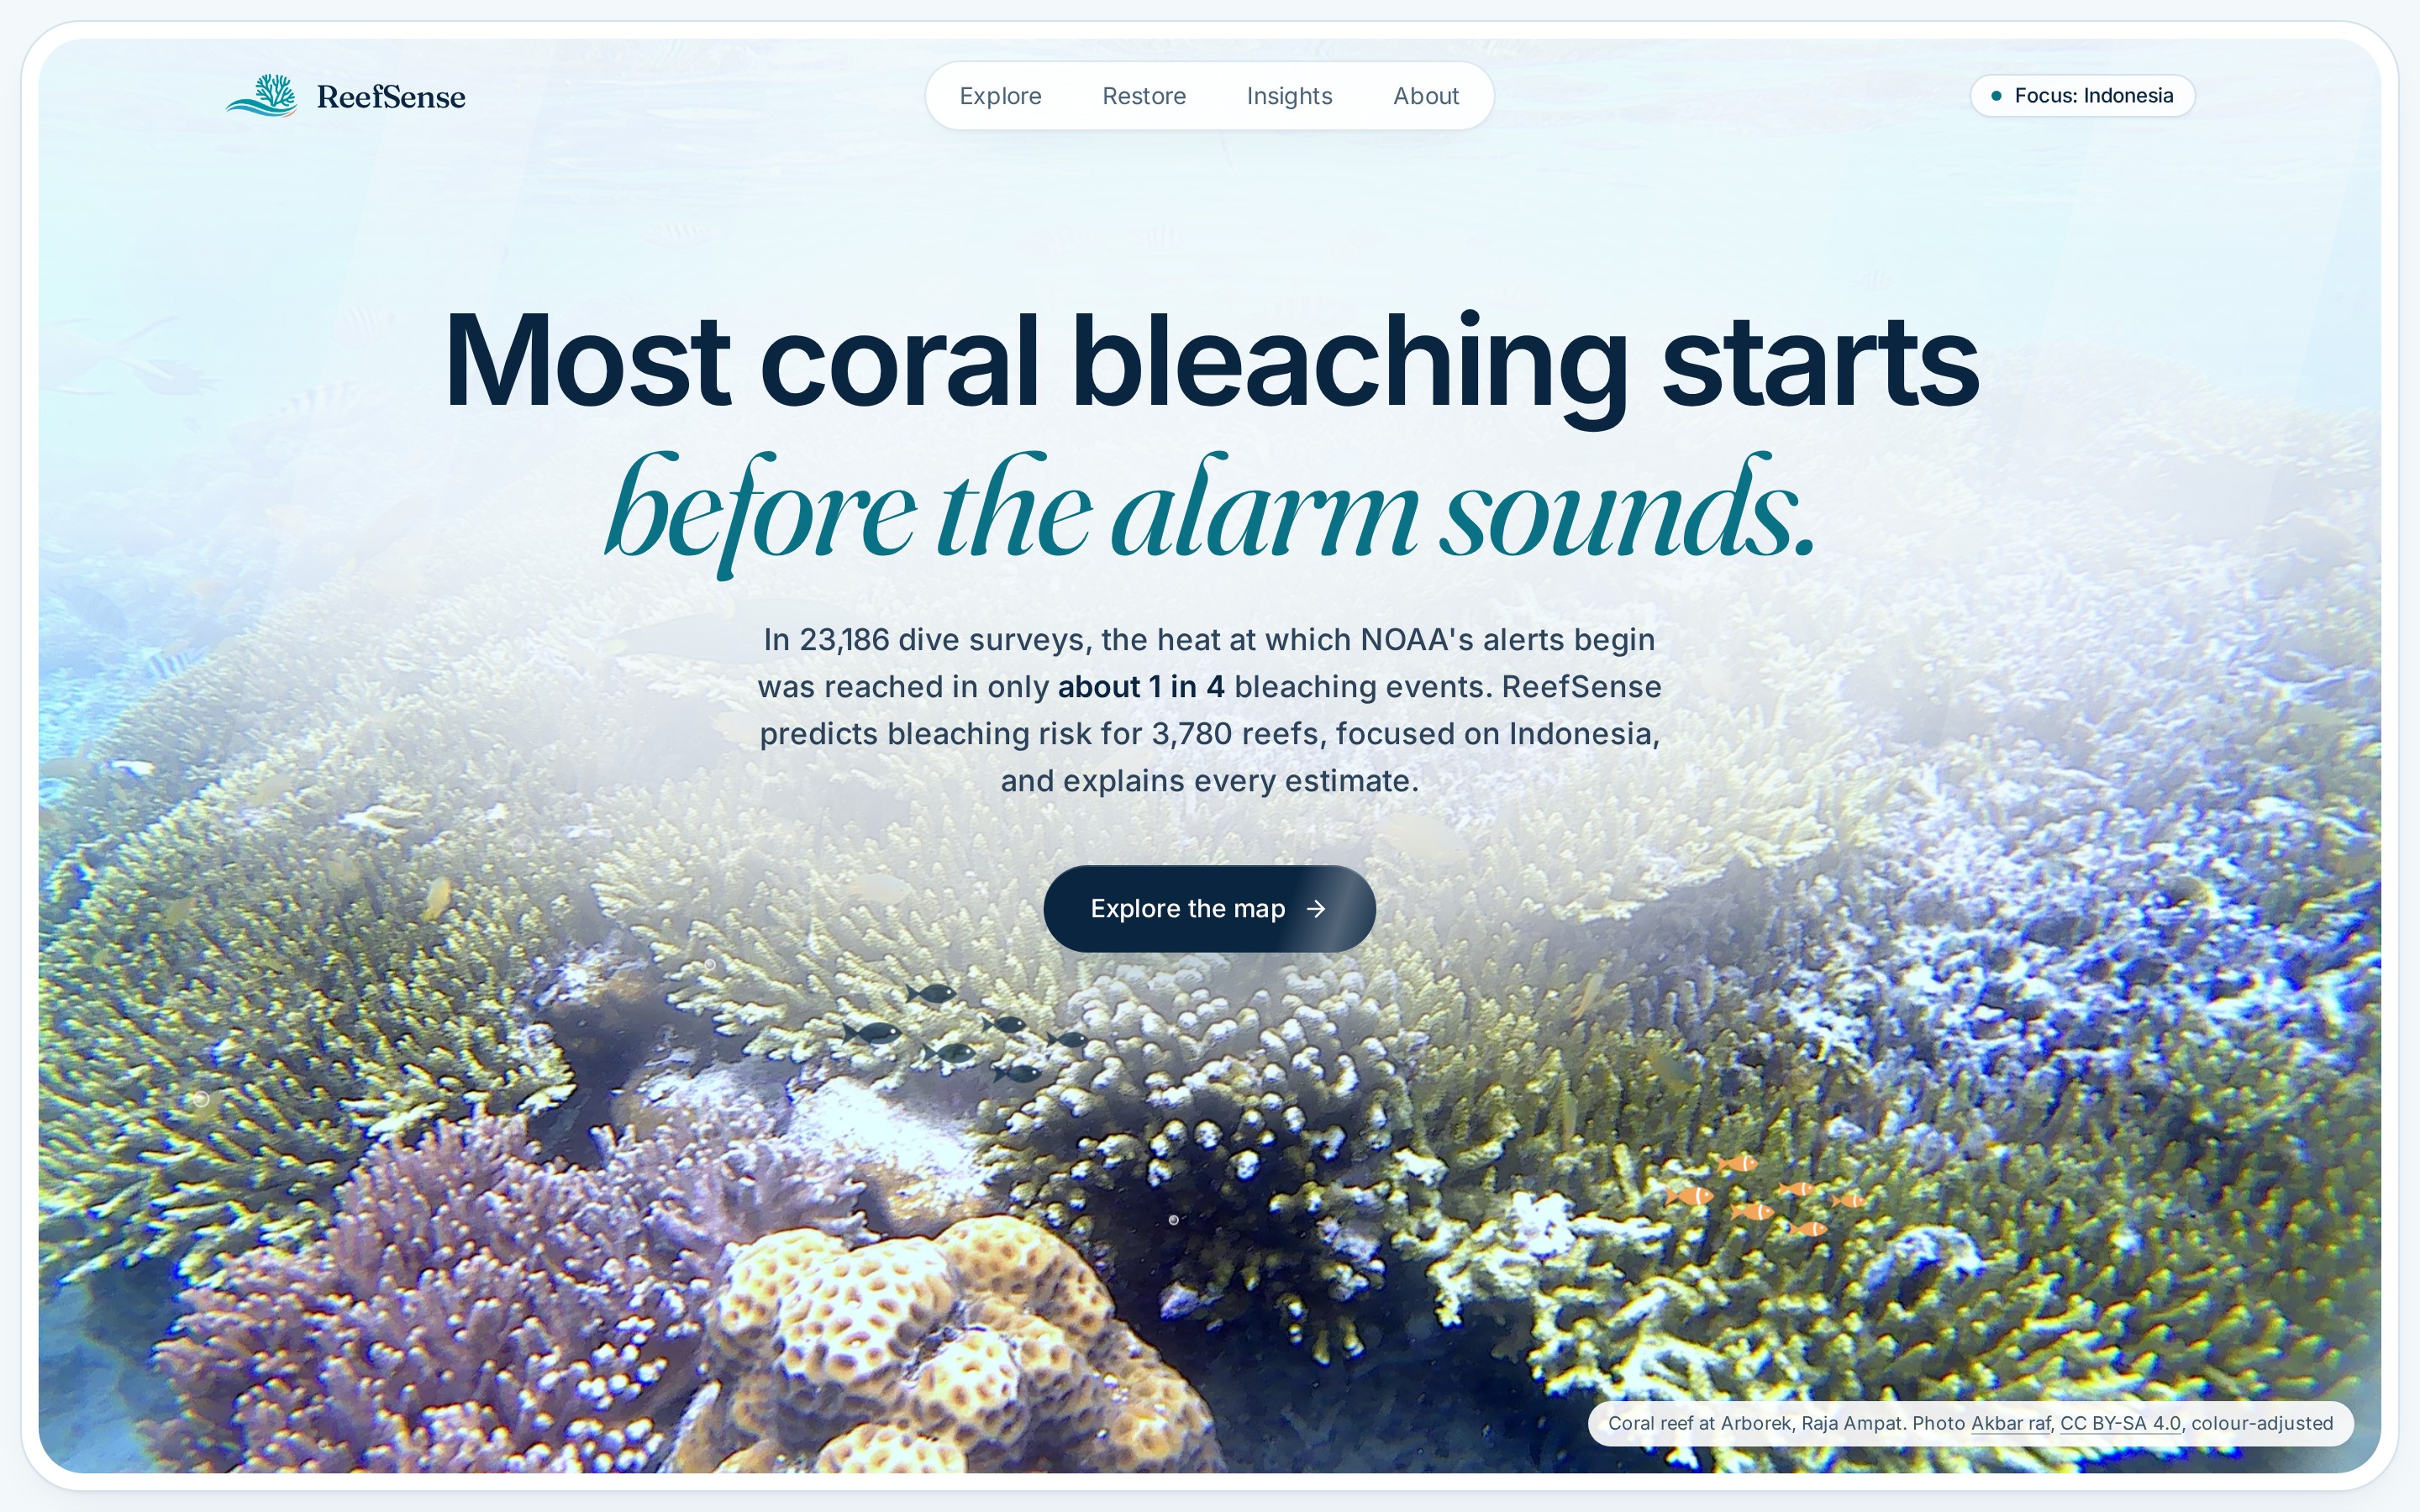
Problem. Heat-only bleaching alerts warn too late: in 23,186 labelled dive surveys, the heat at which NOAA's alerts begin (4 DHW) was reached in only about 1 in 4 bleaching events (26% globally, 22% in the Coral Triangle). And the people protecting reefs have no simple, transparent way to decide where restoration is most likely to last, so scarce money and years of work can go into reefs likely to bleach again next season.
Target users and the decisions ReefSense supports:
| User | Decision |
|---|---|
| Reef restoration teams (NGOs, community groups) | A Nusa Penida team choosing which 5 sites to plant this season: rank reefs by low bleaching risk and healthy coral cover, with weights they set. |
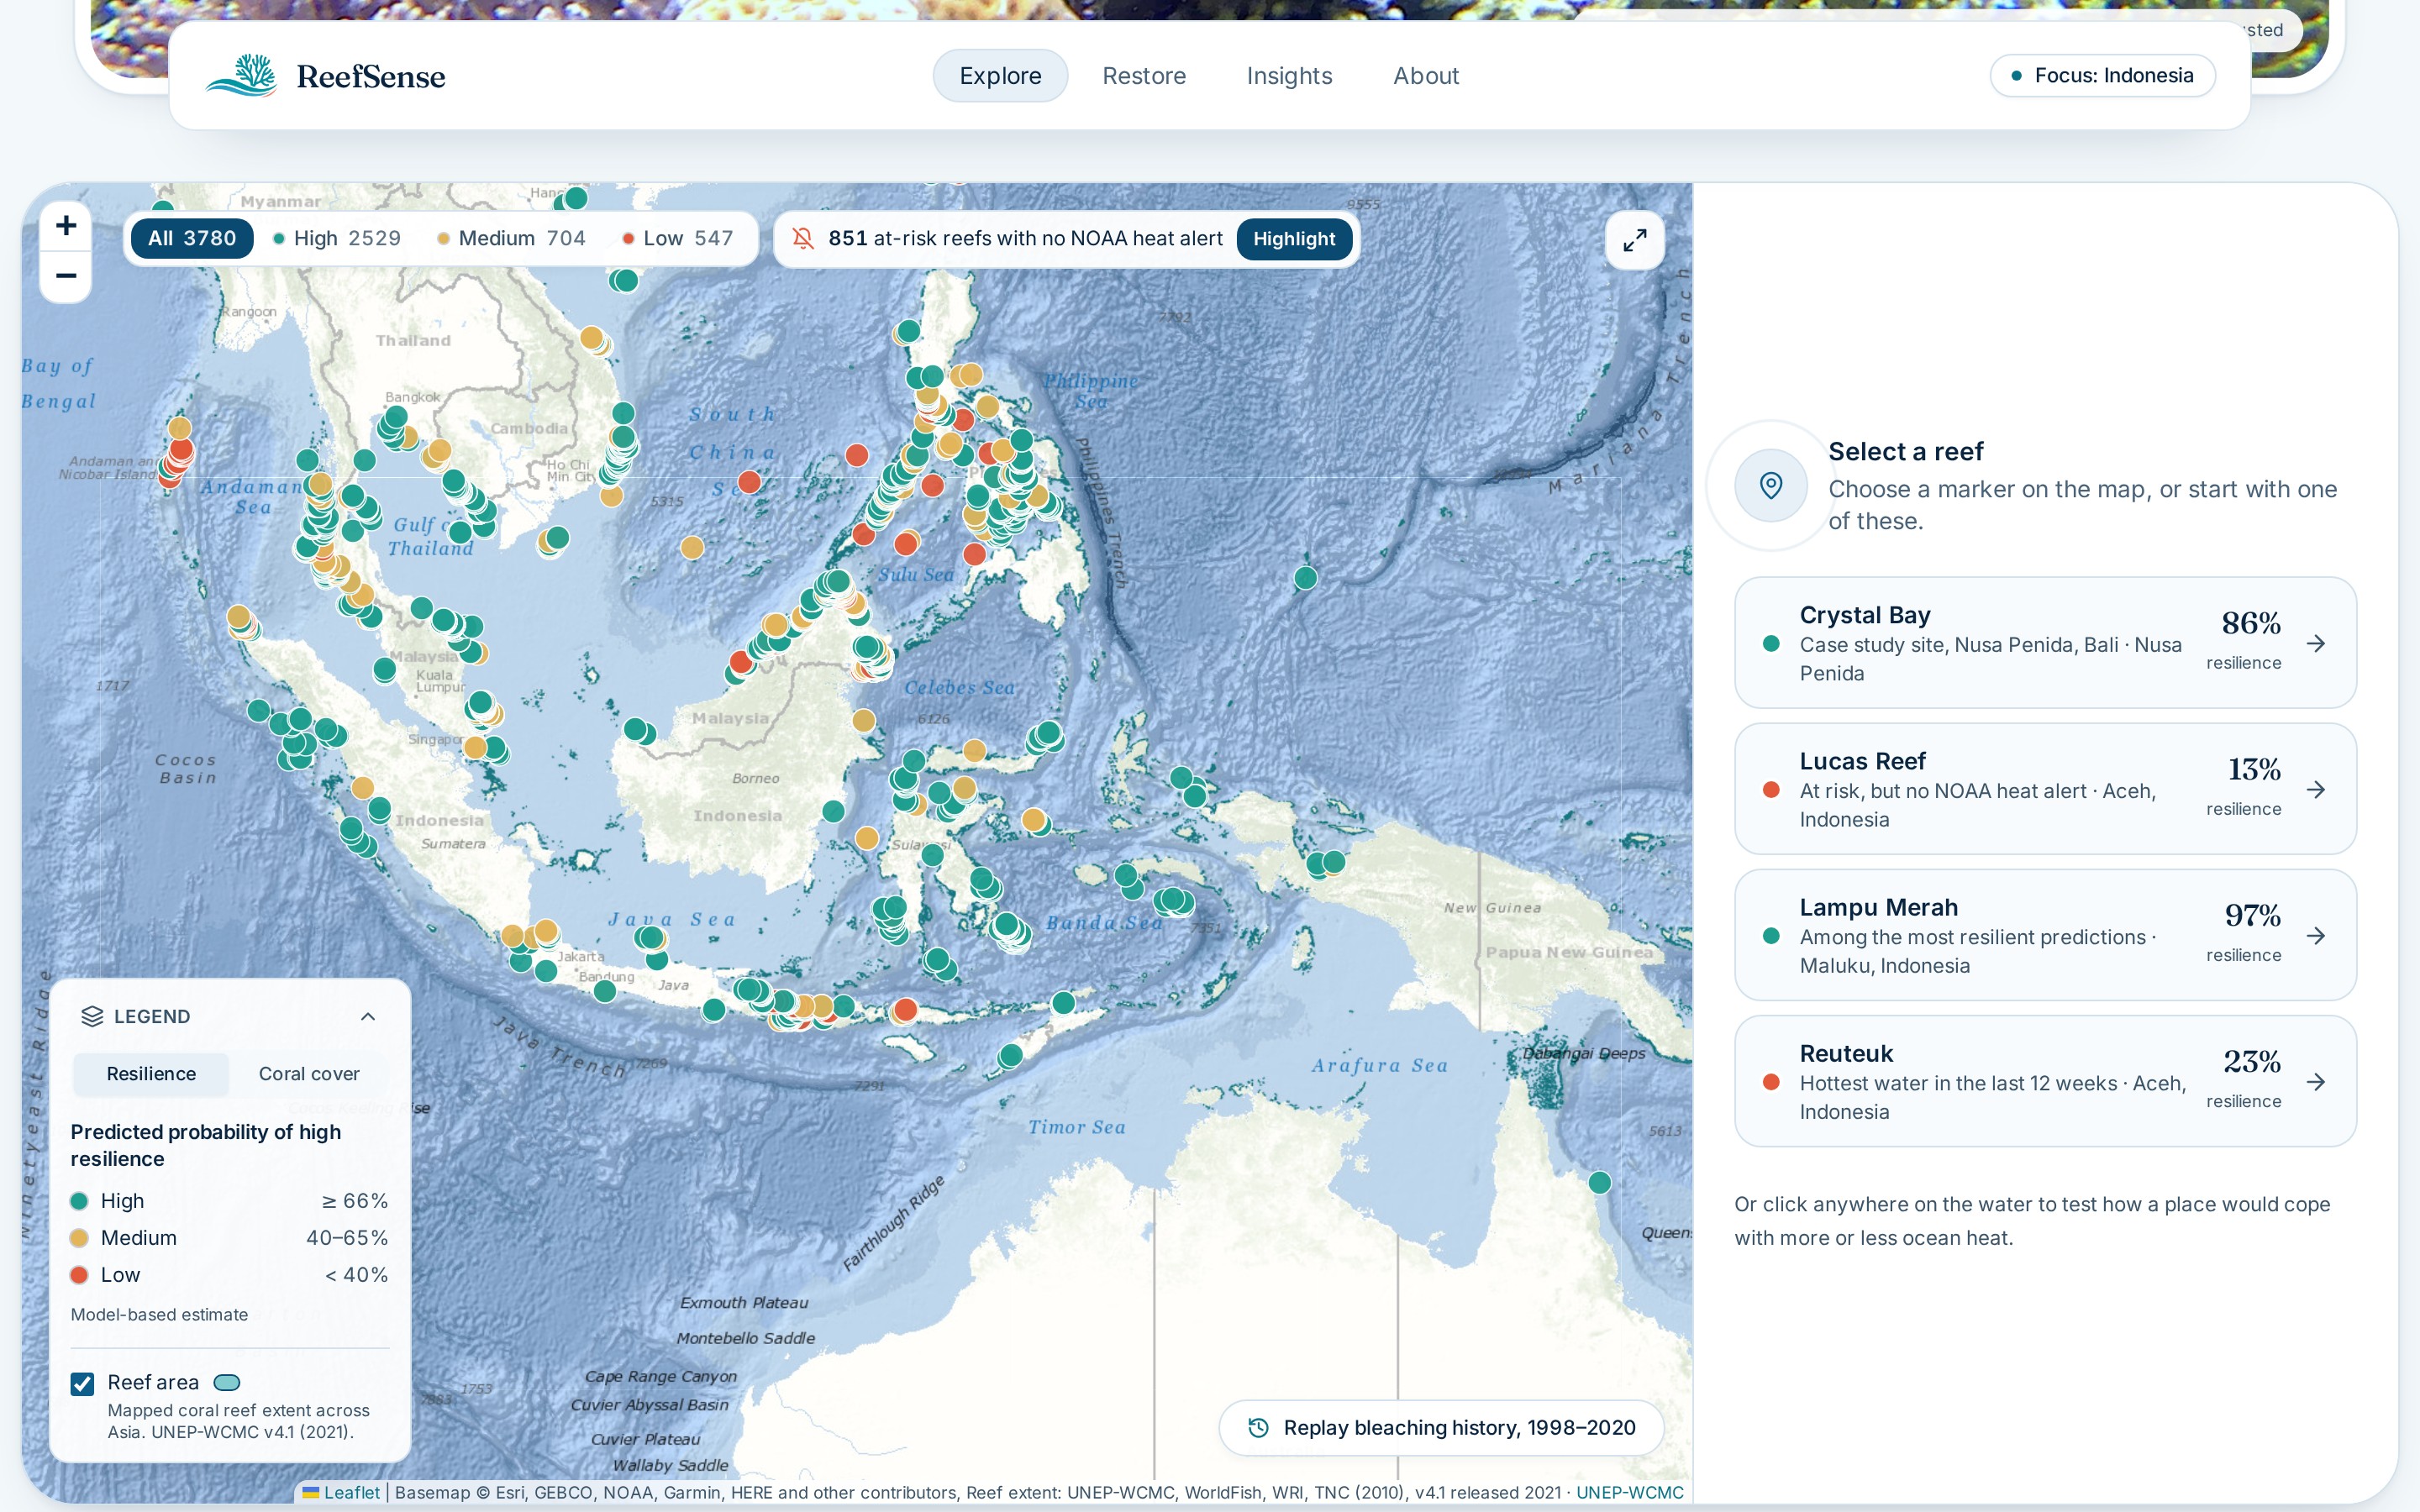
| Marine-park managers and rangers | Which reefs to survey first this month, starting with the 851 at-risk reefs where NOAA's alerts stayed silent. |
| Dive operators and local communities | Understand what's happening to "their" reef in plain language, see past bleaching nearby, and find local groups to support. |
| Researchers and students | Inspect the model's reasons for every estimate, and its validation, including where it fails. |
What it does
ReefSense (www.reefsense.online) maps 3,780 surveyed reefs, mostly across Asia (635 in Indonesia), with Crystal Bay in Nusa Penida, Bali, as our case study.
- Bleaching outlook per reef. A model estimates each reef's chance of avoiding significant bleaching (10% or more of colonies) under the last 12 weeks of live satellite heat stress: $$P(\text{high resilience}) = 1 - P\left(\text{bleaching} \ge 10\% \mid \mathbf{x}\right)$$
- The NOAA gap. One click highlights the 851 reefs at elevated risk right now where NOAA's alerts have stayed silent for 12 weeks.
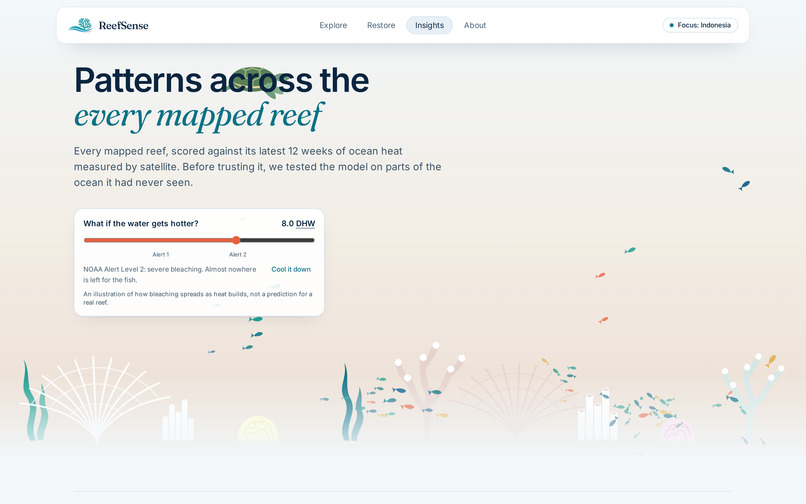
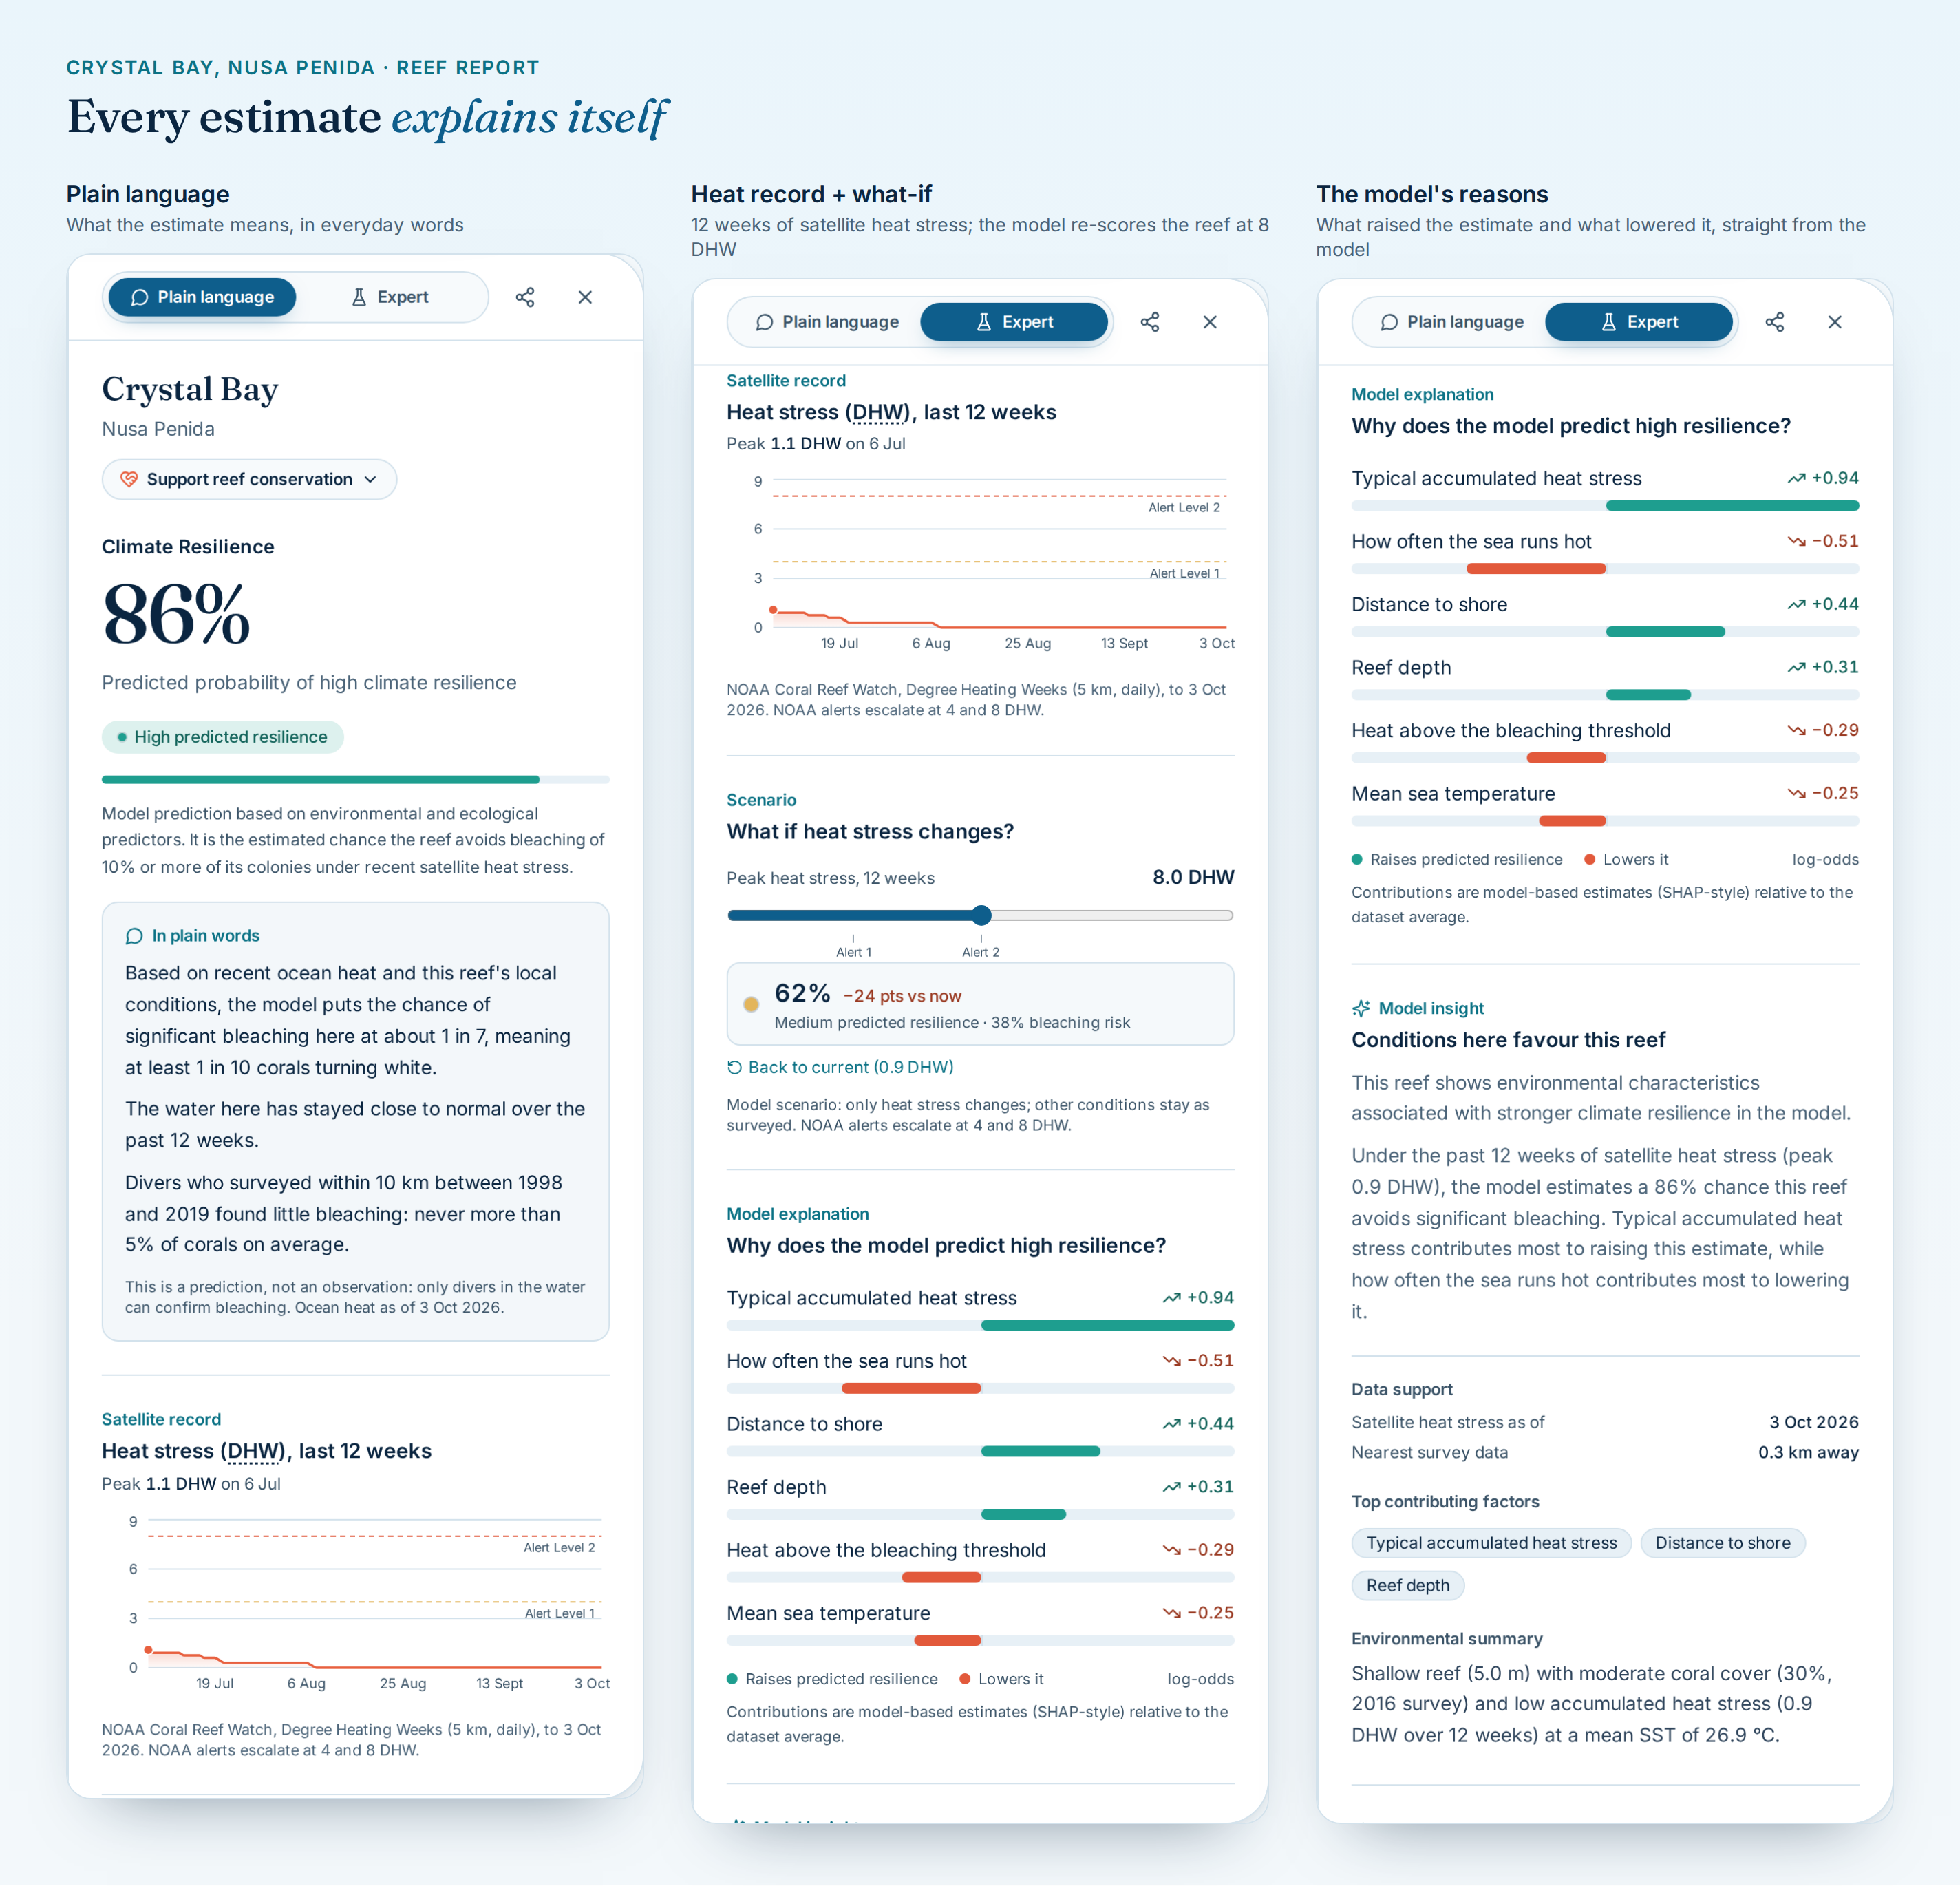
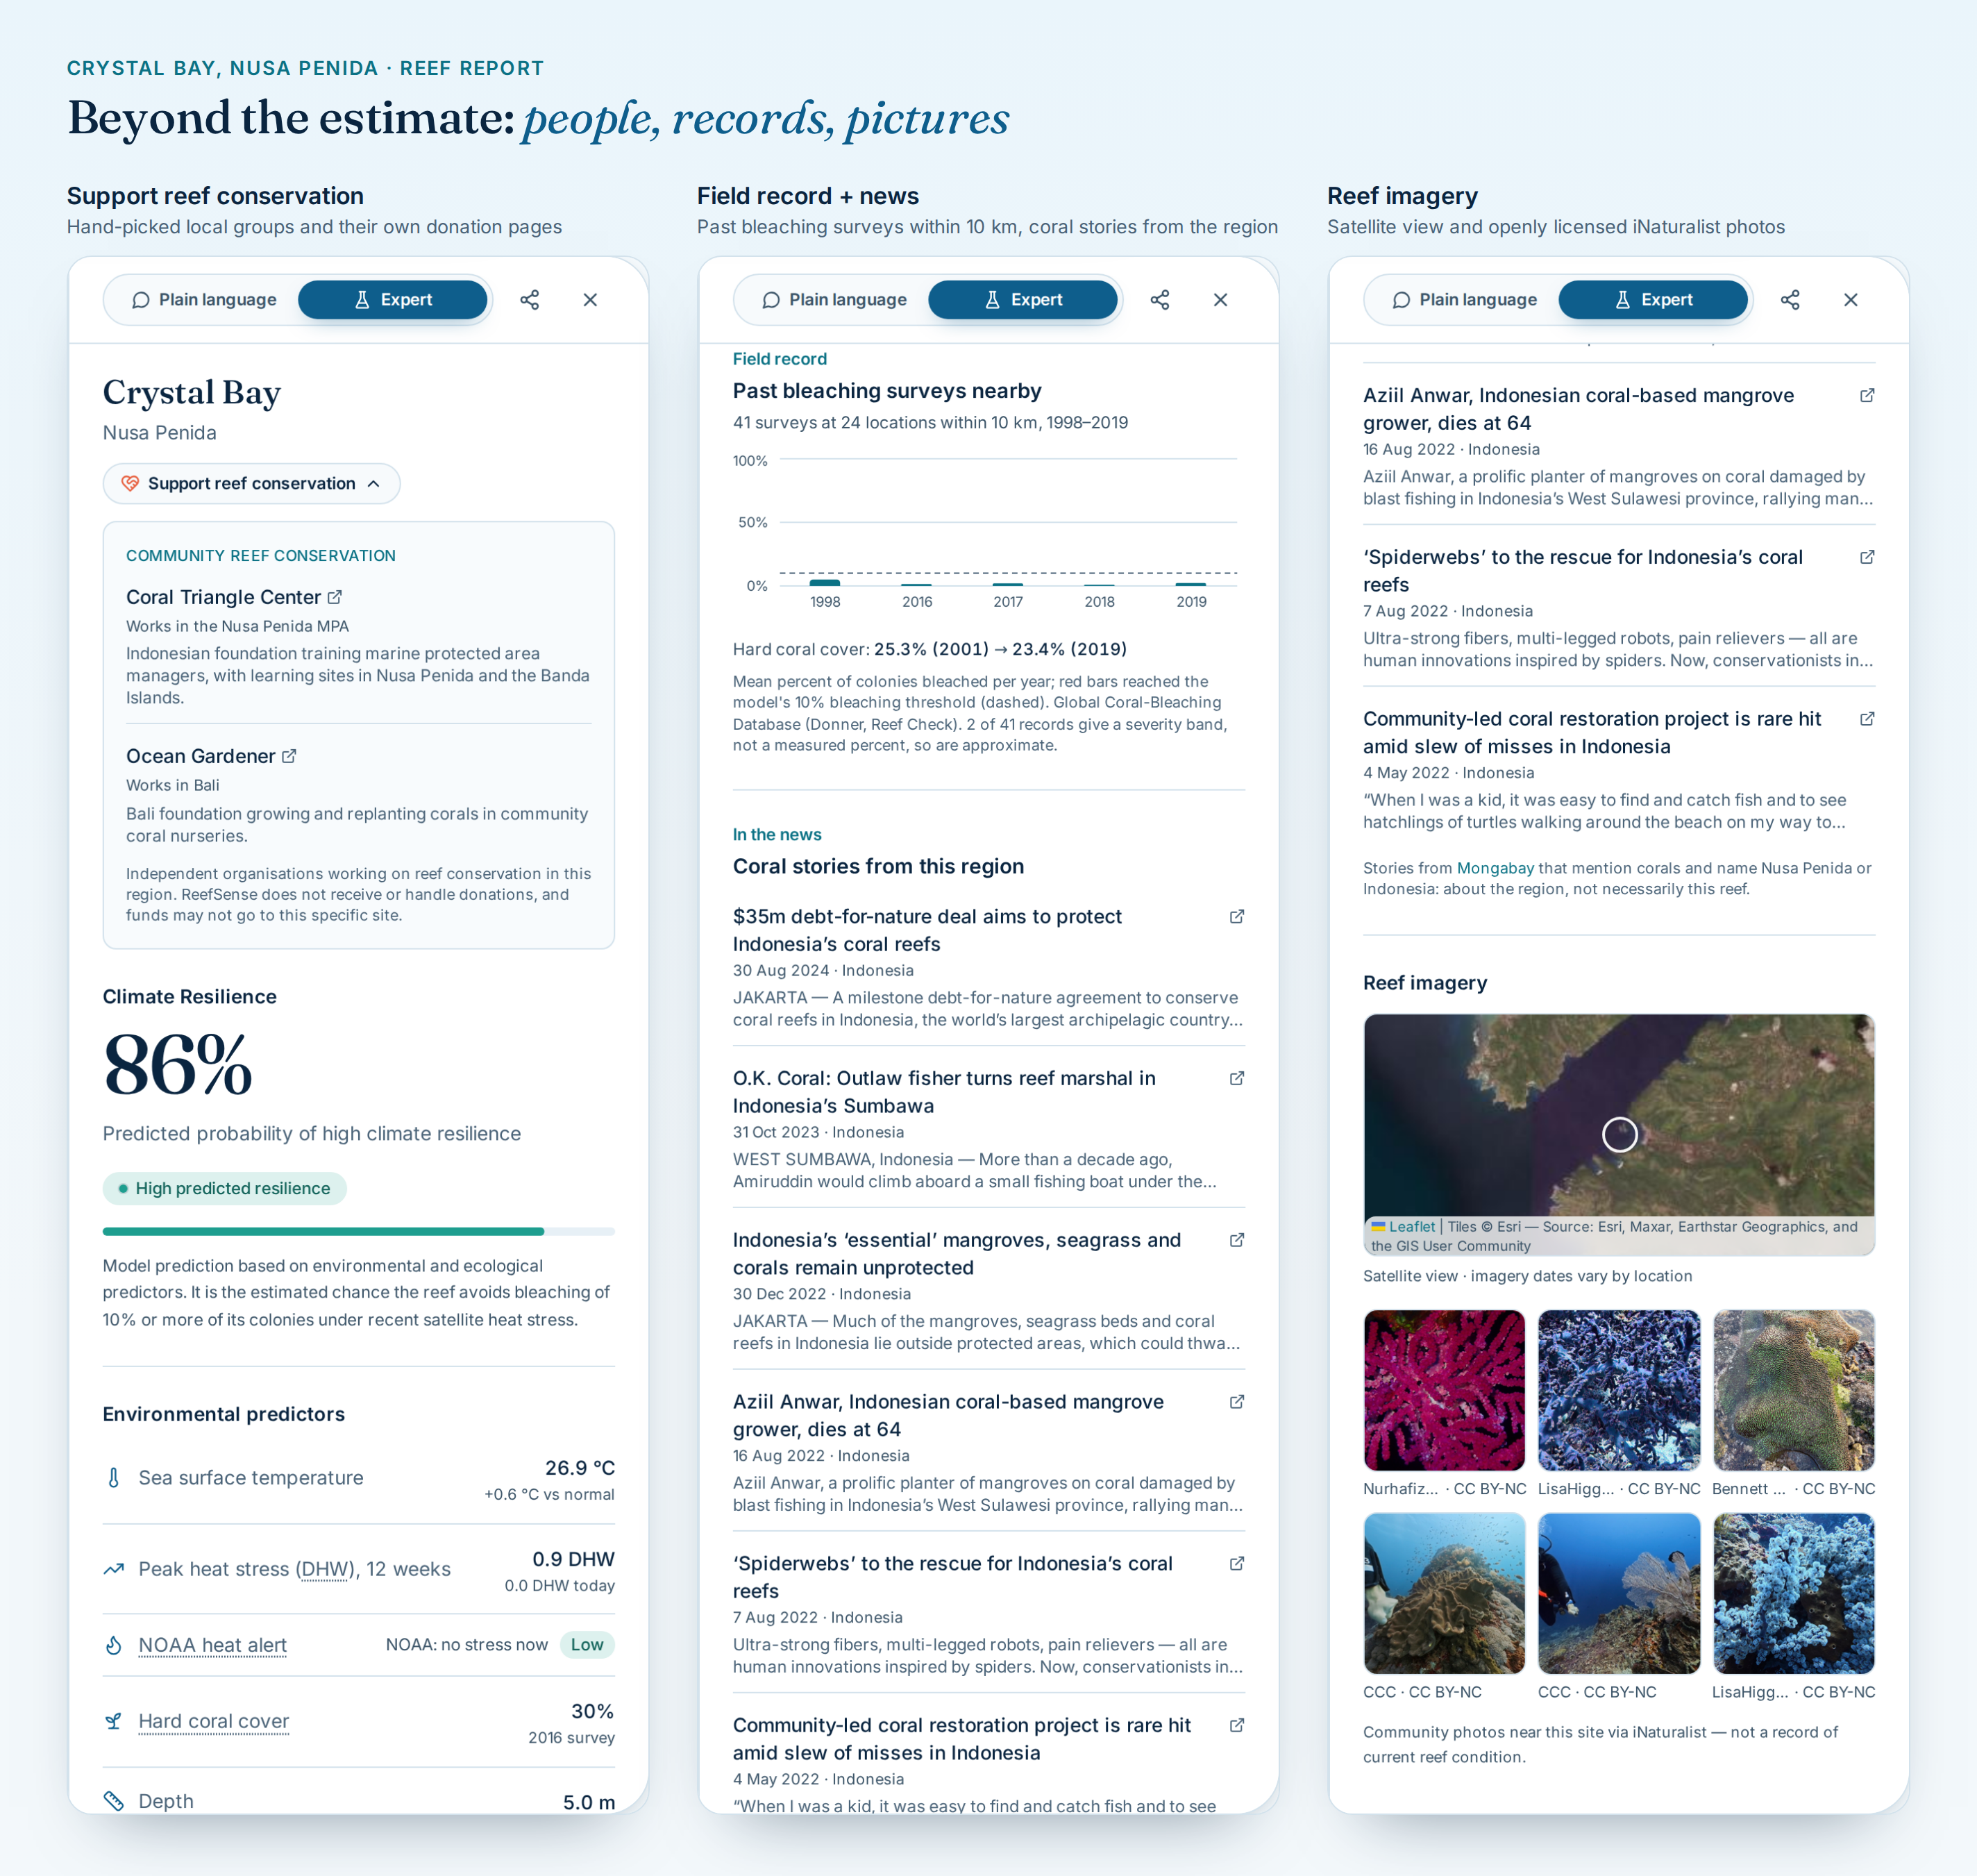
- Every estimate explains itself. A Plain language view for everyone and an Expert view for scientists, with the satellite heat record, a what-if heat slider and the model's reasons: which factors pushed the estimate up and which pulled it down.
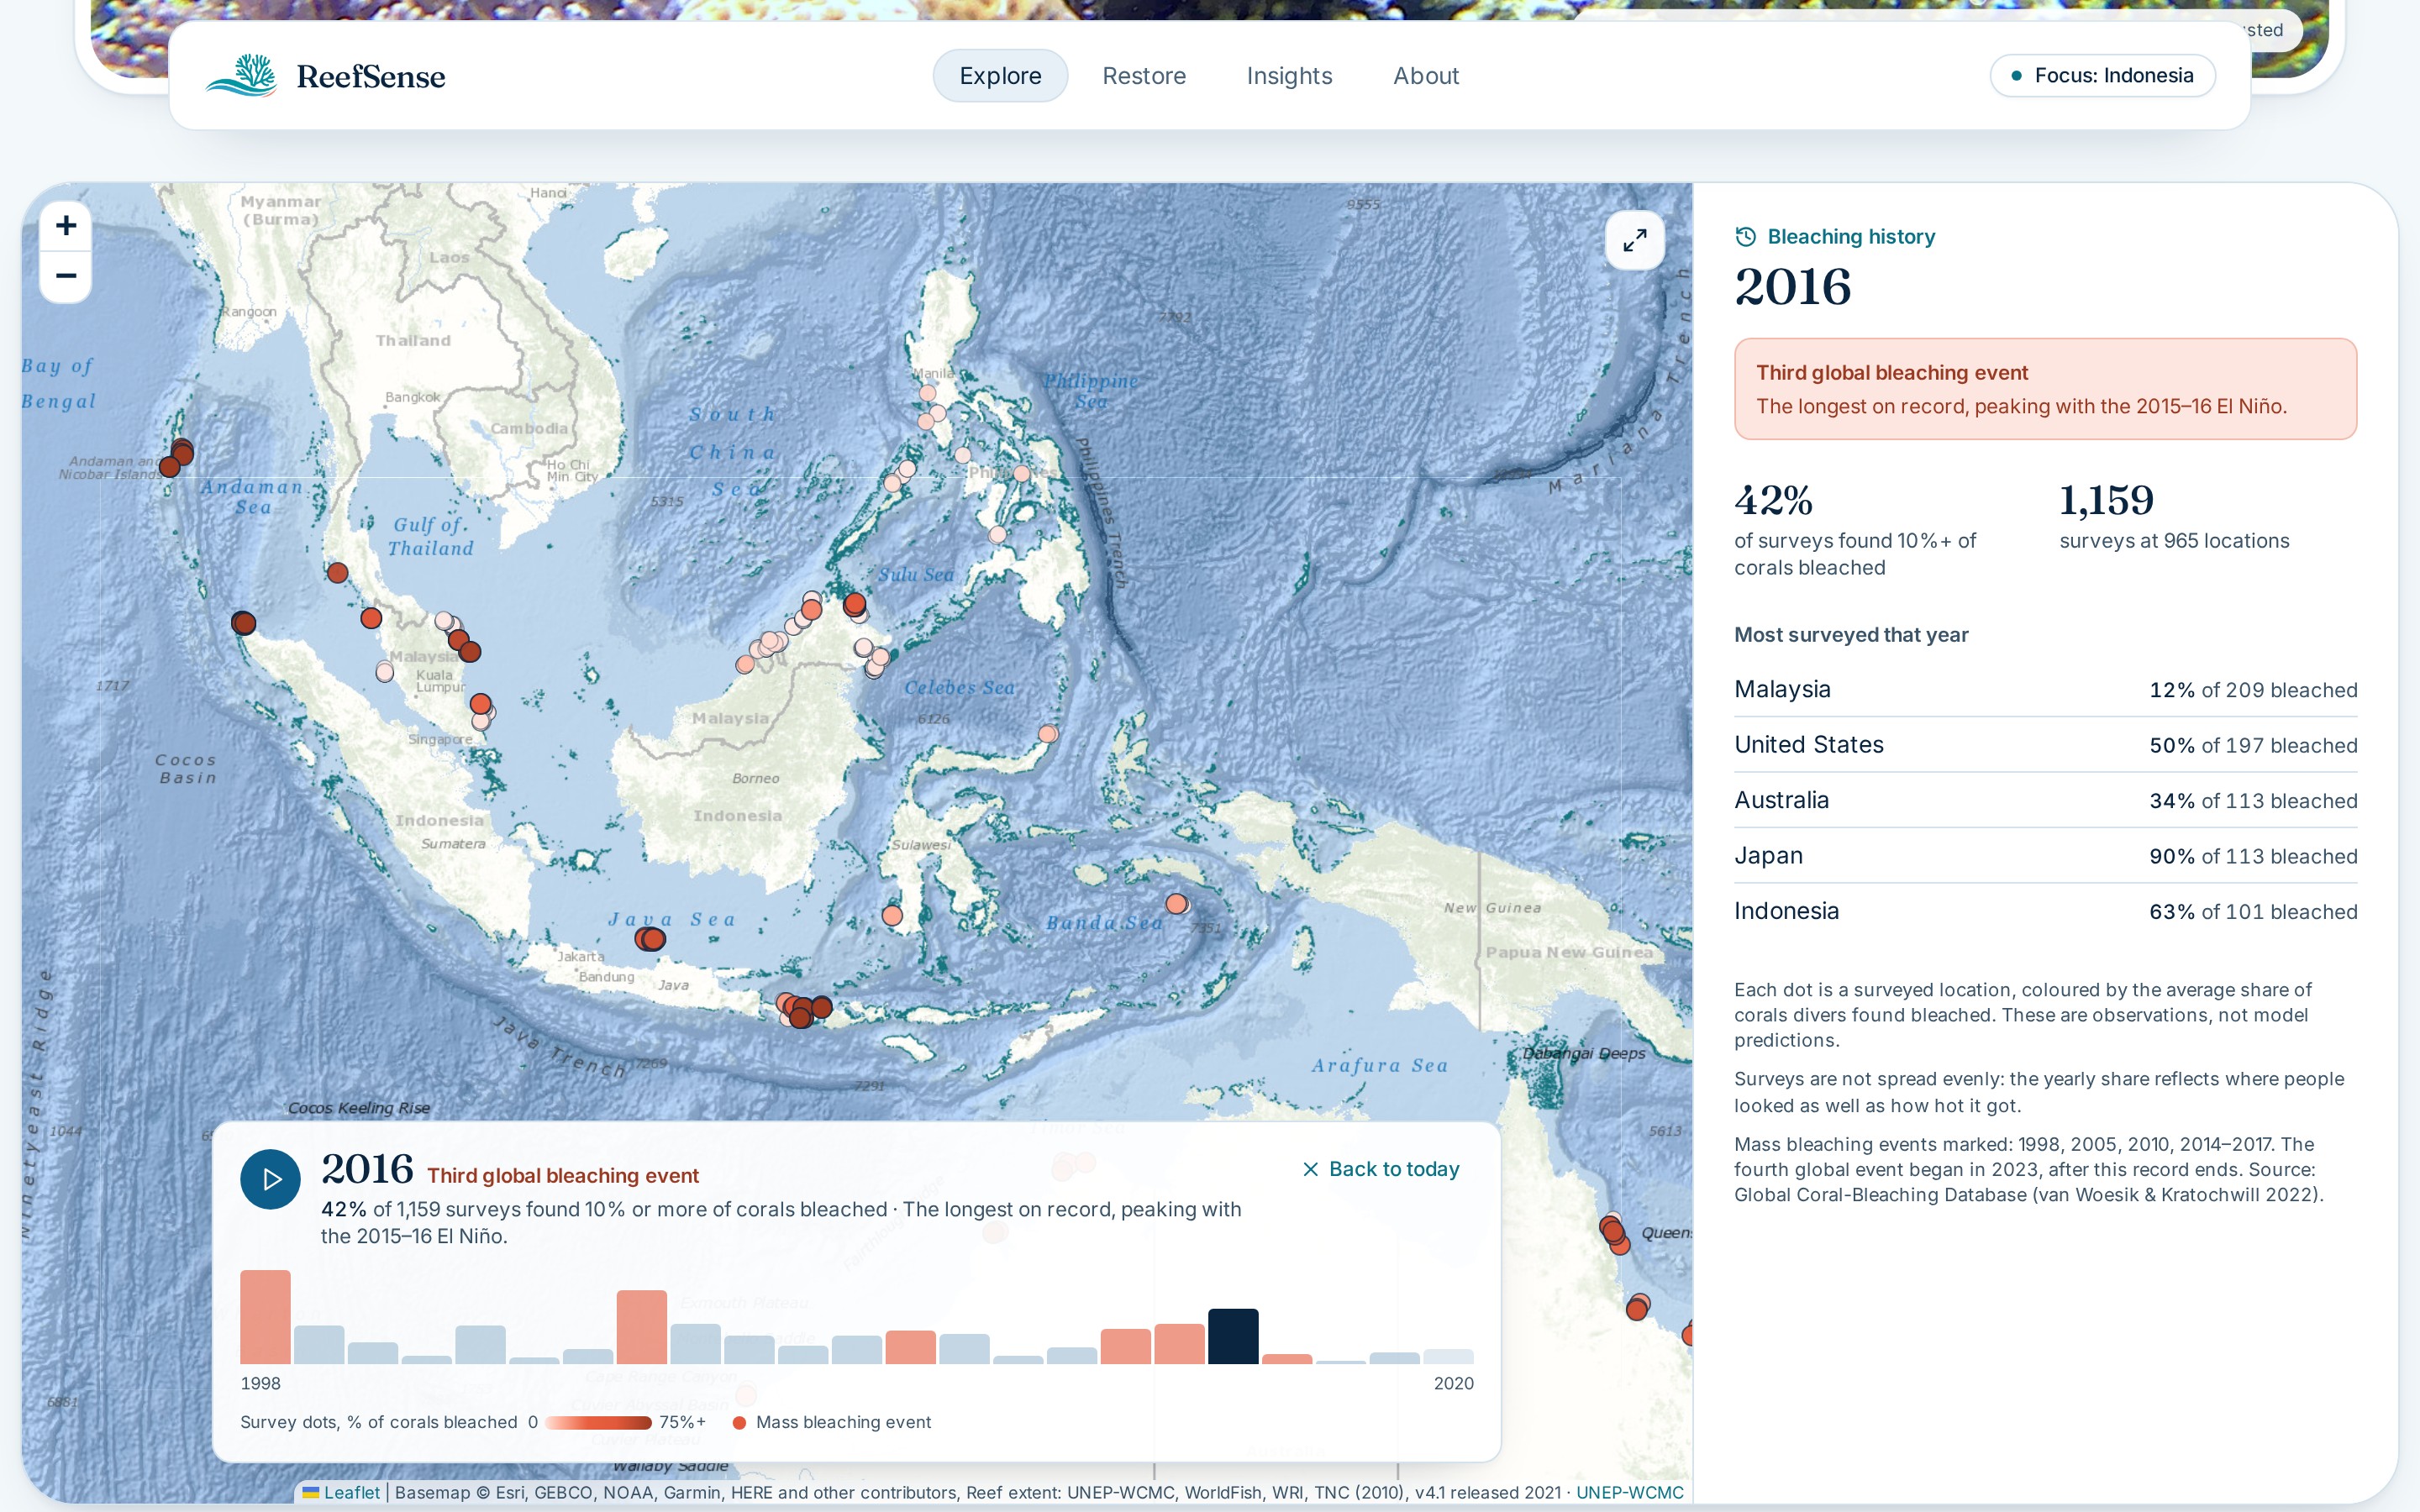
- The full reef report. Past bleaching surveys nearby, coral news from the region, a satellite view, openly licensed community photos from iNaturalist, and Support reef conservation: hand-picked local groups and their own donation pages. ReefSense never handles money.
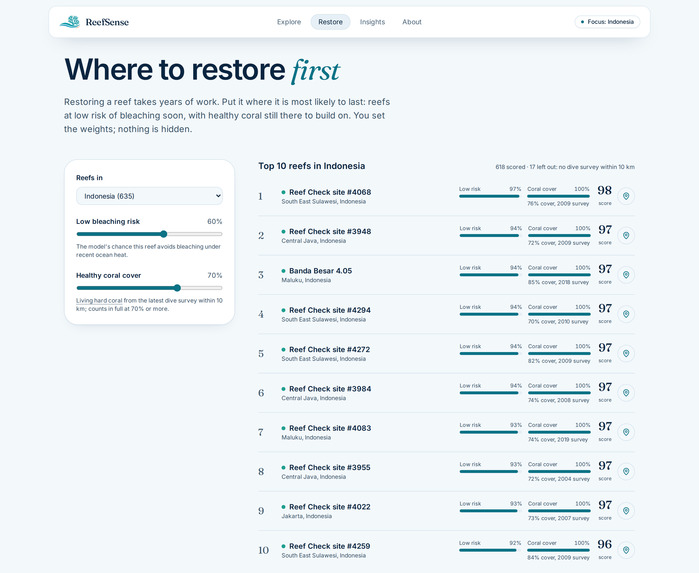
- Where to restore first. A transparent ranking that combines low bleaching risk with healthy coral cover. You set the weights: $$\text{score} = 100 \cdot \frac{w_r \, p_{\text{res}} + w_c \min\left(\tfrac{\text{cover}}{70\%},\, 1\right)}{w_r + w_c}$$ A reef without a dive survey is left out, not guessed.
- Shareable links. Any reef opens directly from a link, for example
?reef=NP01.
How the solution creates real-world impact
- Earlier warning. It flags reefs at elevated risk that heat-only alerts miss, so rangers and divers can check them before bleaching spreads, not after.
- Budgets go further. Restoration teams can see where effort is most likely to last, instead of planting coral on a reef likely to bleach next season.
- Trust through transparency. Every estimate shows its reasons, every ranking shows its weights, and the validation shows where the model fails (Japan). Users can judge the tool instead of taking it on faith.
- Awareness that leads to action. Plain-language summaries, nearby news and community photos make reef change understandable to non-scientists, and every reef report links to local conservation groups people can support directly.
- Always current. Scheduled jobs refresh satellite heat stress daily, so the map reflects the ocean now, not a one-off snapshot.
ReefSense supports decisions; it doesn't replace field surveys. Every estimate is labelled a prediction, not an observation.
How we built it
Technical approach
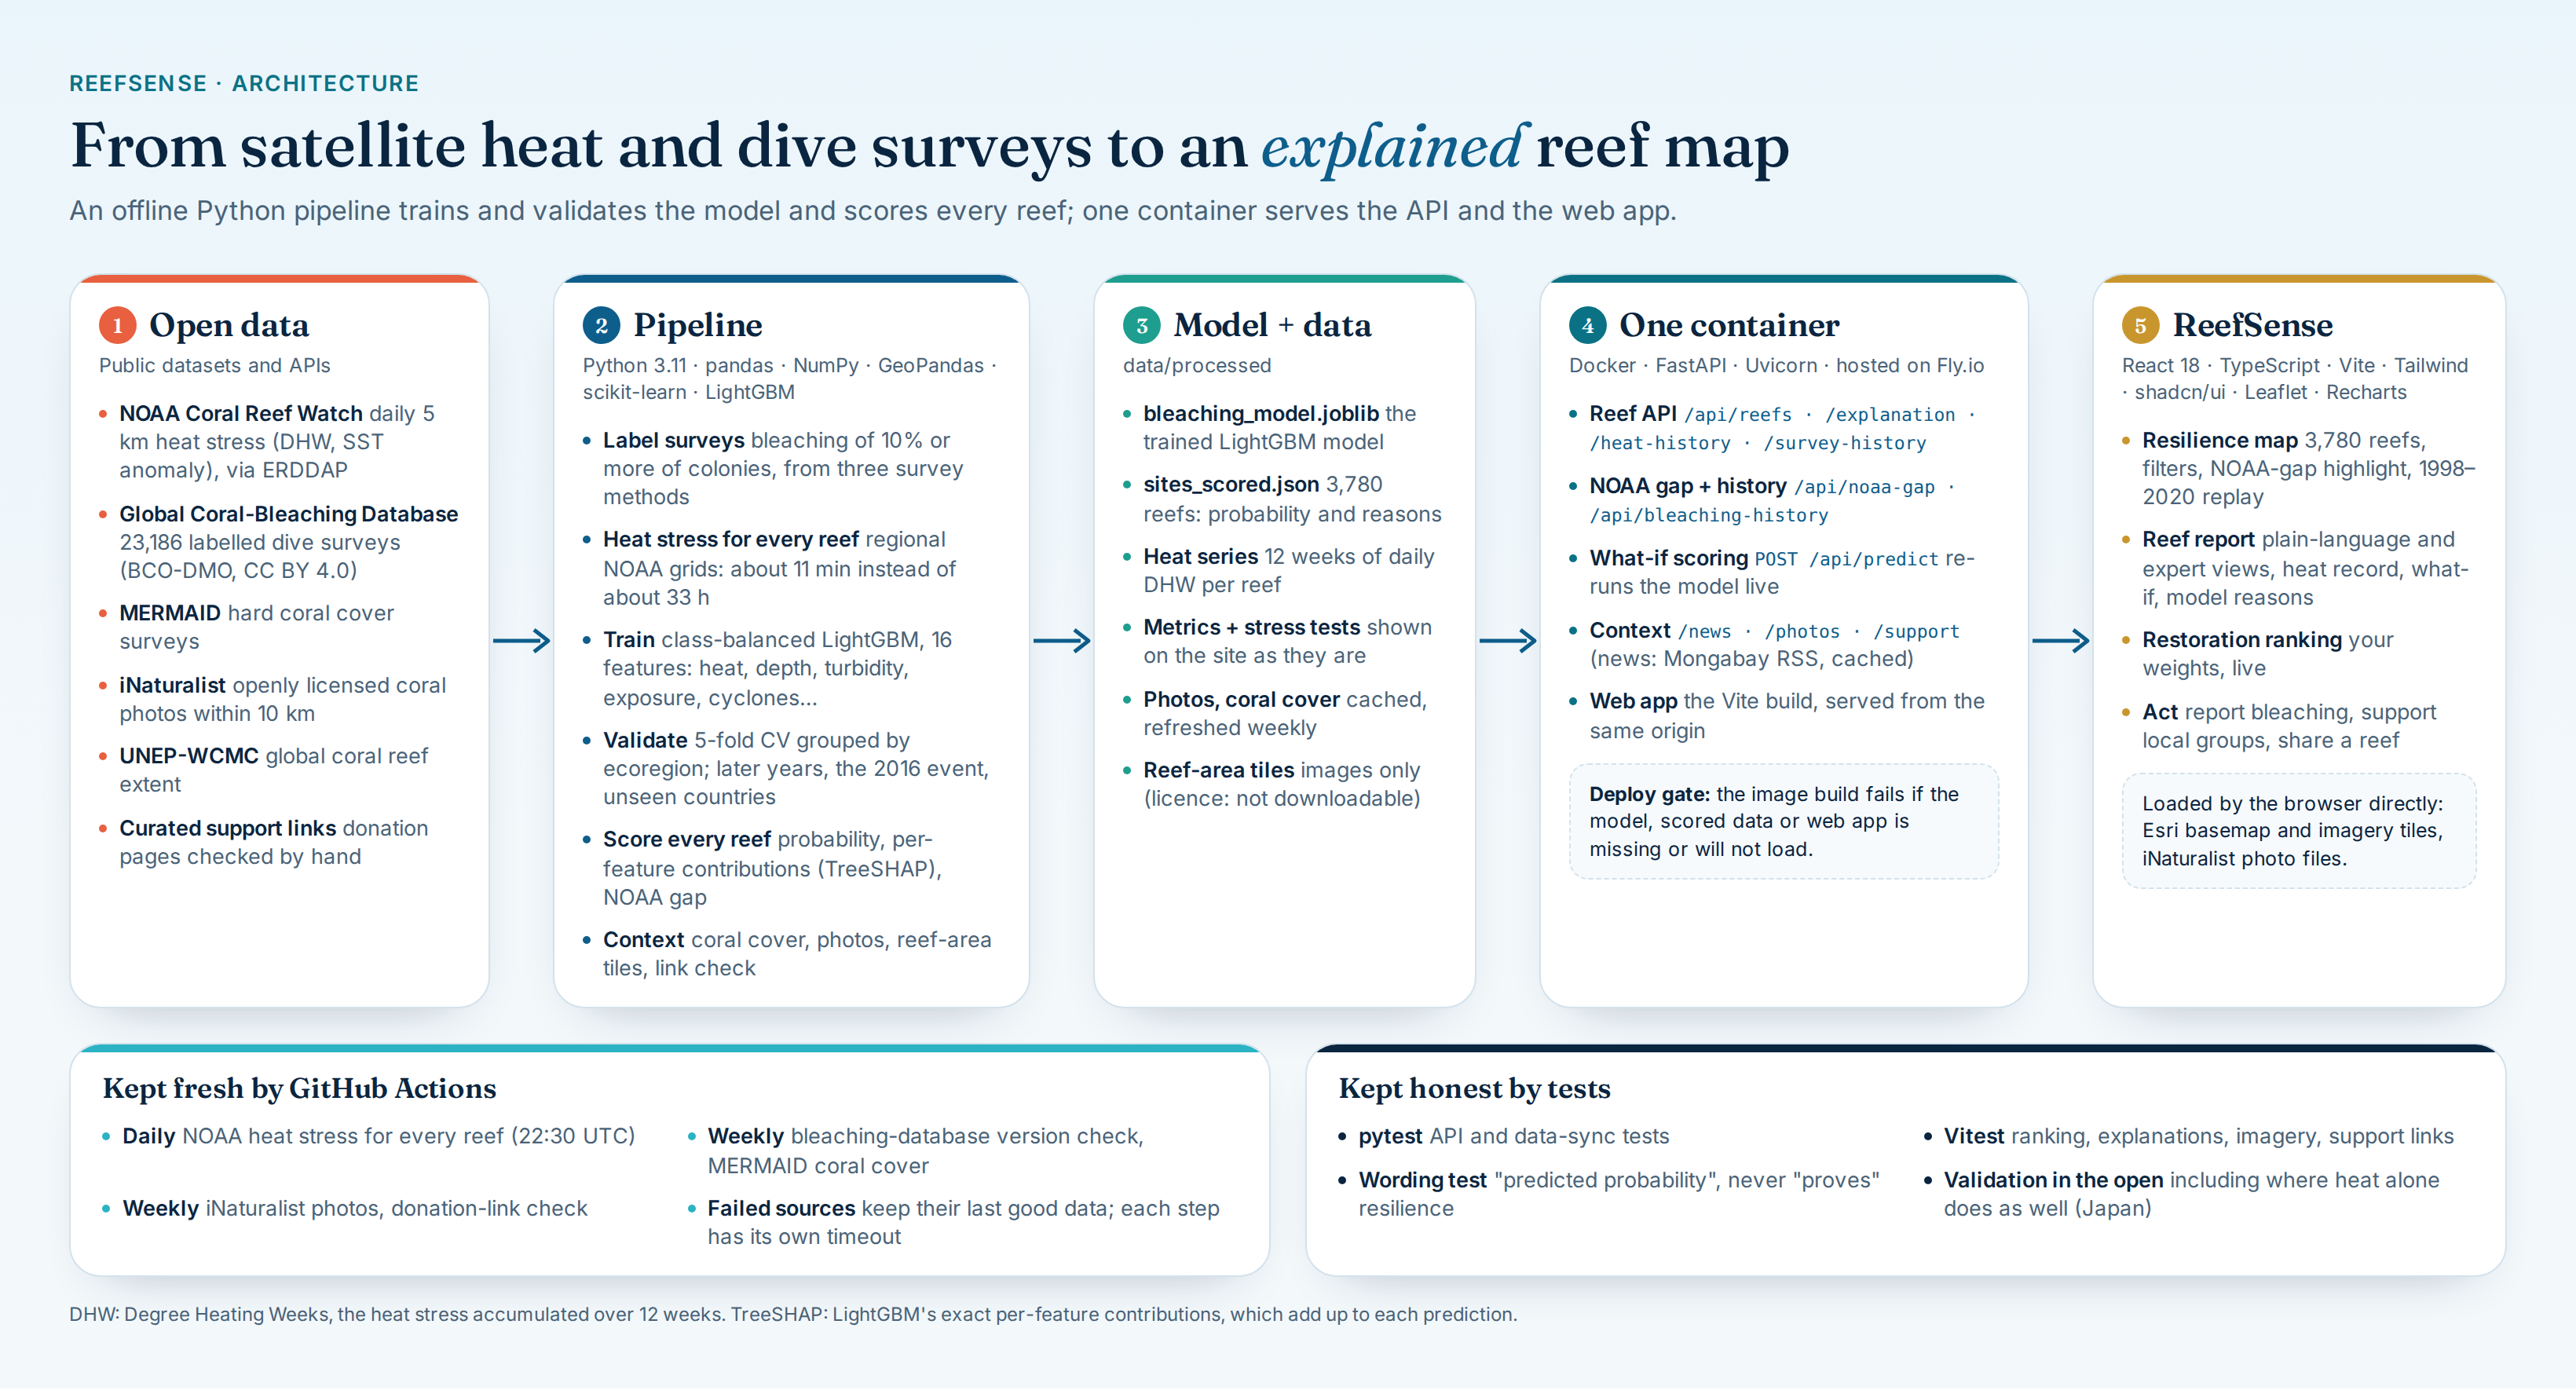
The AI is a model we trained and validated ourselves, not a call to a chatbot API.
NOAA Coral Reef Watch (daily 5 km heat stress)  ─┐
Global Coral-Bleaching Database (dive surveys)  ─┼─> LightGBM model ─> scores + reasons ─> FastAPI ─> React map
MERMAID coral cover / reef extent               ─┘        │                                    └─> restoration ranking
                                                          └─> live what-if predictions (/api/predict)
Data. Labels come from the Global Coral-Bleaching Database (van Woesik & Kratochwill 2022). Each survey's percent bleached is taken, in order of preference, from the recorded percent of colonies (8,947 surveys), the mean of Reef Check's four transect segments (11,297), or the midpoint of a coarse severity code (2,942). Live heat stress comes from NOAA Coral Reef Watch's daily 5 km product. Coral cover comes from MERMAID, and photos from iNaturalist. Reefs without their own survey borrow site conditions from the nearest surveyed reefs (a BallTree nearest-neighbour search).
Model. A class-balanced LightGBM classifier over 16 features: accumulated heat (DHW, max and mean DHW, SST anomaly and their frequencies) plus each reef's own conditions (turbidity, depth, distance to shore, exposure, cyclone frequency, wind speed). The explanations are LightGBM's exact per-feature contributions (SHAP-equivalent), which add up to the prediction in log-odds:
$$\log\frac{\hat p}{1-\hat p} = \phi_0 + \sum_{j=1}^{16} \phi_j$$
So the reasons on screen come straight from the trained model, not from a chatbot.
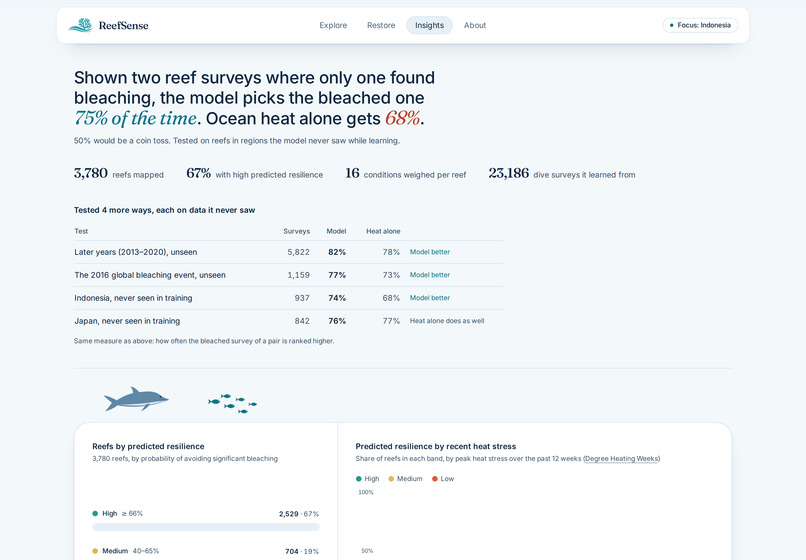
Validation. A random split would leak information between neighbouring reefs, so we used 5-fold cross-validation grouped by ecoregion: every fold is tested on places the model never saw. Then we stress-tested it on later years, the 2016 global bleaching event, and whole countries held out of training, always against heat alone on the same surveys. We report ROC AUC, which has a plain meaning: shown one survey that bleached and one that didn't, how often the model ranks the bleached one higher.
| Test (never seen in training) | ReefSense | Heat alone (DHW) |
|---|---|---|
| Ecoregions (5-fold, grouped) | 0.754 | 0.677 |
| Later years, 2013–2020 | 0.822 | 0.778 |
| The 2016 global bleaching event | 0.771 | 0.726 |
| Indonesia | 0.744 | 0.680 |
| Japan | 0.759 | 0.767 |
Technical components
| Layer | What we used |
|---|---|
| Machine learning | LightGBM, scikit-learn, pandas, NumPy, joblib |
| Data pipeline | Python scripts for download, cleaning, training, scoring and validation; GeoPandas for reef-area tiles |
| Data sources | NOAA Coral Reef Watch v3.1, Global Coral-Bleaching Database, MERMAID, iNaturalist, Mongabay, UNEP-WCMC reef extent |
| Backend | FastAPI + Uvicorn: scores, explanations, heat and survey history, news, photos, support links, live predictions |
| Frontend | React + TypeScript + Vite, Tailwind CSS + shadcn/ui, Leaflet maps, Recharts charts |
| Automation | GitHub Actions: daily NOAA refresh and rescoring; weekly coral cover, photos and donation-link check |
| Deployment | One Docker image (web app + API on one URL) on Fly.io, custom domain with HTTPS |
| Demo video | Remotion + Playwright recordings of the live site, synthesised narration, music generated in code |
Challenges we ran into
- Labels from three survey methods. Percent bleached, transect means and coarse severity codes had to be merged into one label. We document which method each record uses, and the site warns when a reef's history relies on approximate records.
- Two different heat products. Training heat comes from CoRTAD (inside the bleaching database), while live heat comes from NOAA Coral Reef Watch. Both measure accumulated heat stress, but they're not the same product, so we state that as a limitation.
- Fetching heat stress for thousands of reefs. Requesting NOAA data one reef at a time would have taken about 33 hours for 3,756 reefs. Fetching regional grids and sampling every reef from them cut that to about 11 minutes.
- Reefs that satellites see as land. Many coastal reefs fall in 5 km pixels masked as land. We use the nearest ocean pixel within 0.25°.
- Being honest about where it fails. In Japan, heat alone does as well as our model. We checked whether one feature (cyclone frequency) was standing in for "Japan". Removing it barely changed anything (0.763 vs 0.754), so we kept the result in the table instead of hiding it.
- Data licences. The UNEP-WCMC reef-area layer may be shown online only if it can't be downloaded, so we serve it as image tiles rather than data.
- Donation links you can trust. No API maps a reef to a donation page, so every link is curated by hand with a verification rule (a page we opened ourselves, https, the organisation's own site) and a script that re-checks every link weekly.
- Deploying a trained model. The model only loads reliably with the exact scikit-learn and LightGBM versions it was trained with, so the deploy image pins them and refuses to build if the model doesn't load.
What we learned
- The validation design is the result. A random split made the model look better than it is. Grouping by ecoregion and holding out years and countries gave smaller numbers, but numbers we can defend.
- Comparing against what people use today matters more than a high score. 0.75 isn't impressive on its own. Beating the heat-only alert on regions, years and an event the model never saw is.
- Showing a loss builds trust. The Japan row is in the table on purpose.
- Words are part of the science. We say "predicted probability of high climate resilience", never "resilience score", and the model never "proves" a reef is resilient. A unit test enforces that wording across the app.
- Most of the work is data plumbing. Downloading, cleaning, joining and refreshing the data took far more time than training the model.
What's next
We had 7 days, so we kept the scope honest. Next:
- Climate refugia (50 Reefs+) and larval connectivity in the ranking. The method supports them; we left them out rather than fake data we haven't loaded yet.
- Bahasa Indonesia for the plain-language view, ranking and reef report, so local communities and rangers can use it directly.
- Grounded Q&A per reef: ask questions about a reef and get answers written only from that reef's model output, survey history and news, with sources shown, and "we don't know" when the data doesn't cover it.
- Feedback from restoration teams working in Nusa Penida on whether the ranking helps them choose sites.
- Coverage beyond Asia, and an alert when a reef's predicted risk rises.
Built With
- docker
- esri
- fastapi
- fly.io
- geopandas
- github-actions
- global-coral-bleaching-database
- inaturalist
- leaflet.js
- lightgbm
- noaa-coral-reef-watch
- numpy
- pandas
- python
- react
- recharts
- remotion
- scikit-learn
- shadcn-ui
- tailwind-css
- typescript
- uvicorn
- vite
- vitest


Log in or sign up for Devpost to join the conversation.