Inspiration
In 2024 alone, wildfires decimated over 8.1 million acres across the United States. California's Park Fire scorched over 428,000 acres in a single incident, becoming the state's fourth largest wildfire in recorded history. The 2018 Camp Fire in Paradise, CA killed 85 people and brought 18,804 structures to ruins in under 4 hours. Unfortunately, these deaths were preventable due to most of them being attributed to delayed evacuation decisions.
Yet the Incident Commanders responsible for making those life or death decisions are still working with radio dispatches, large influxes of unreadable data, and situation reports that are 30-60 minutes stale by the time they arrive. NIFC's own after-action report consistently cite "inadequate real-time situational awareness" as a contributing factor in firefighter fatalities.
Meanwhile, the data just sits their motionless. NASA's VIIRS and GOES-16/18 satellites detect fires every 10-15 minutes. Open-Meteo serves readily available hyperlocal weather data, updated hourly. ArcGIS provides real time fire perimeter display from NIFC WFIGS. However, all of this data is useless if it can't reach the person who has the power to act. The gap isn't data availability, but data delivery.
Nowadays, wildfires cost the U.S. an estimated $394-$893 billion annually when factoring in property loss, health impacts, and suppression costs. Fire seasons are 78 days longer than they were in 1970. The firefighter workforce is also declining, with a reported 45% attrition rate in 2023 due to working conditions and unfair compensation.
I built Redhue because the brave heroes that protect our communities from the fastest-growing natural disaster in the country deserve a tool that's as modern and dangerous as the threat they're facing.
What it does
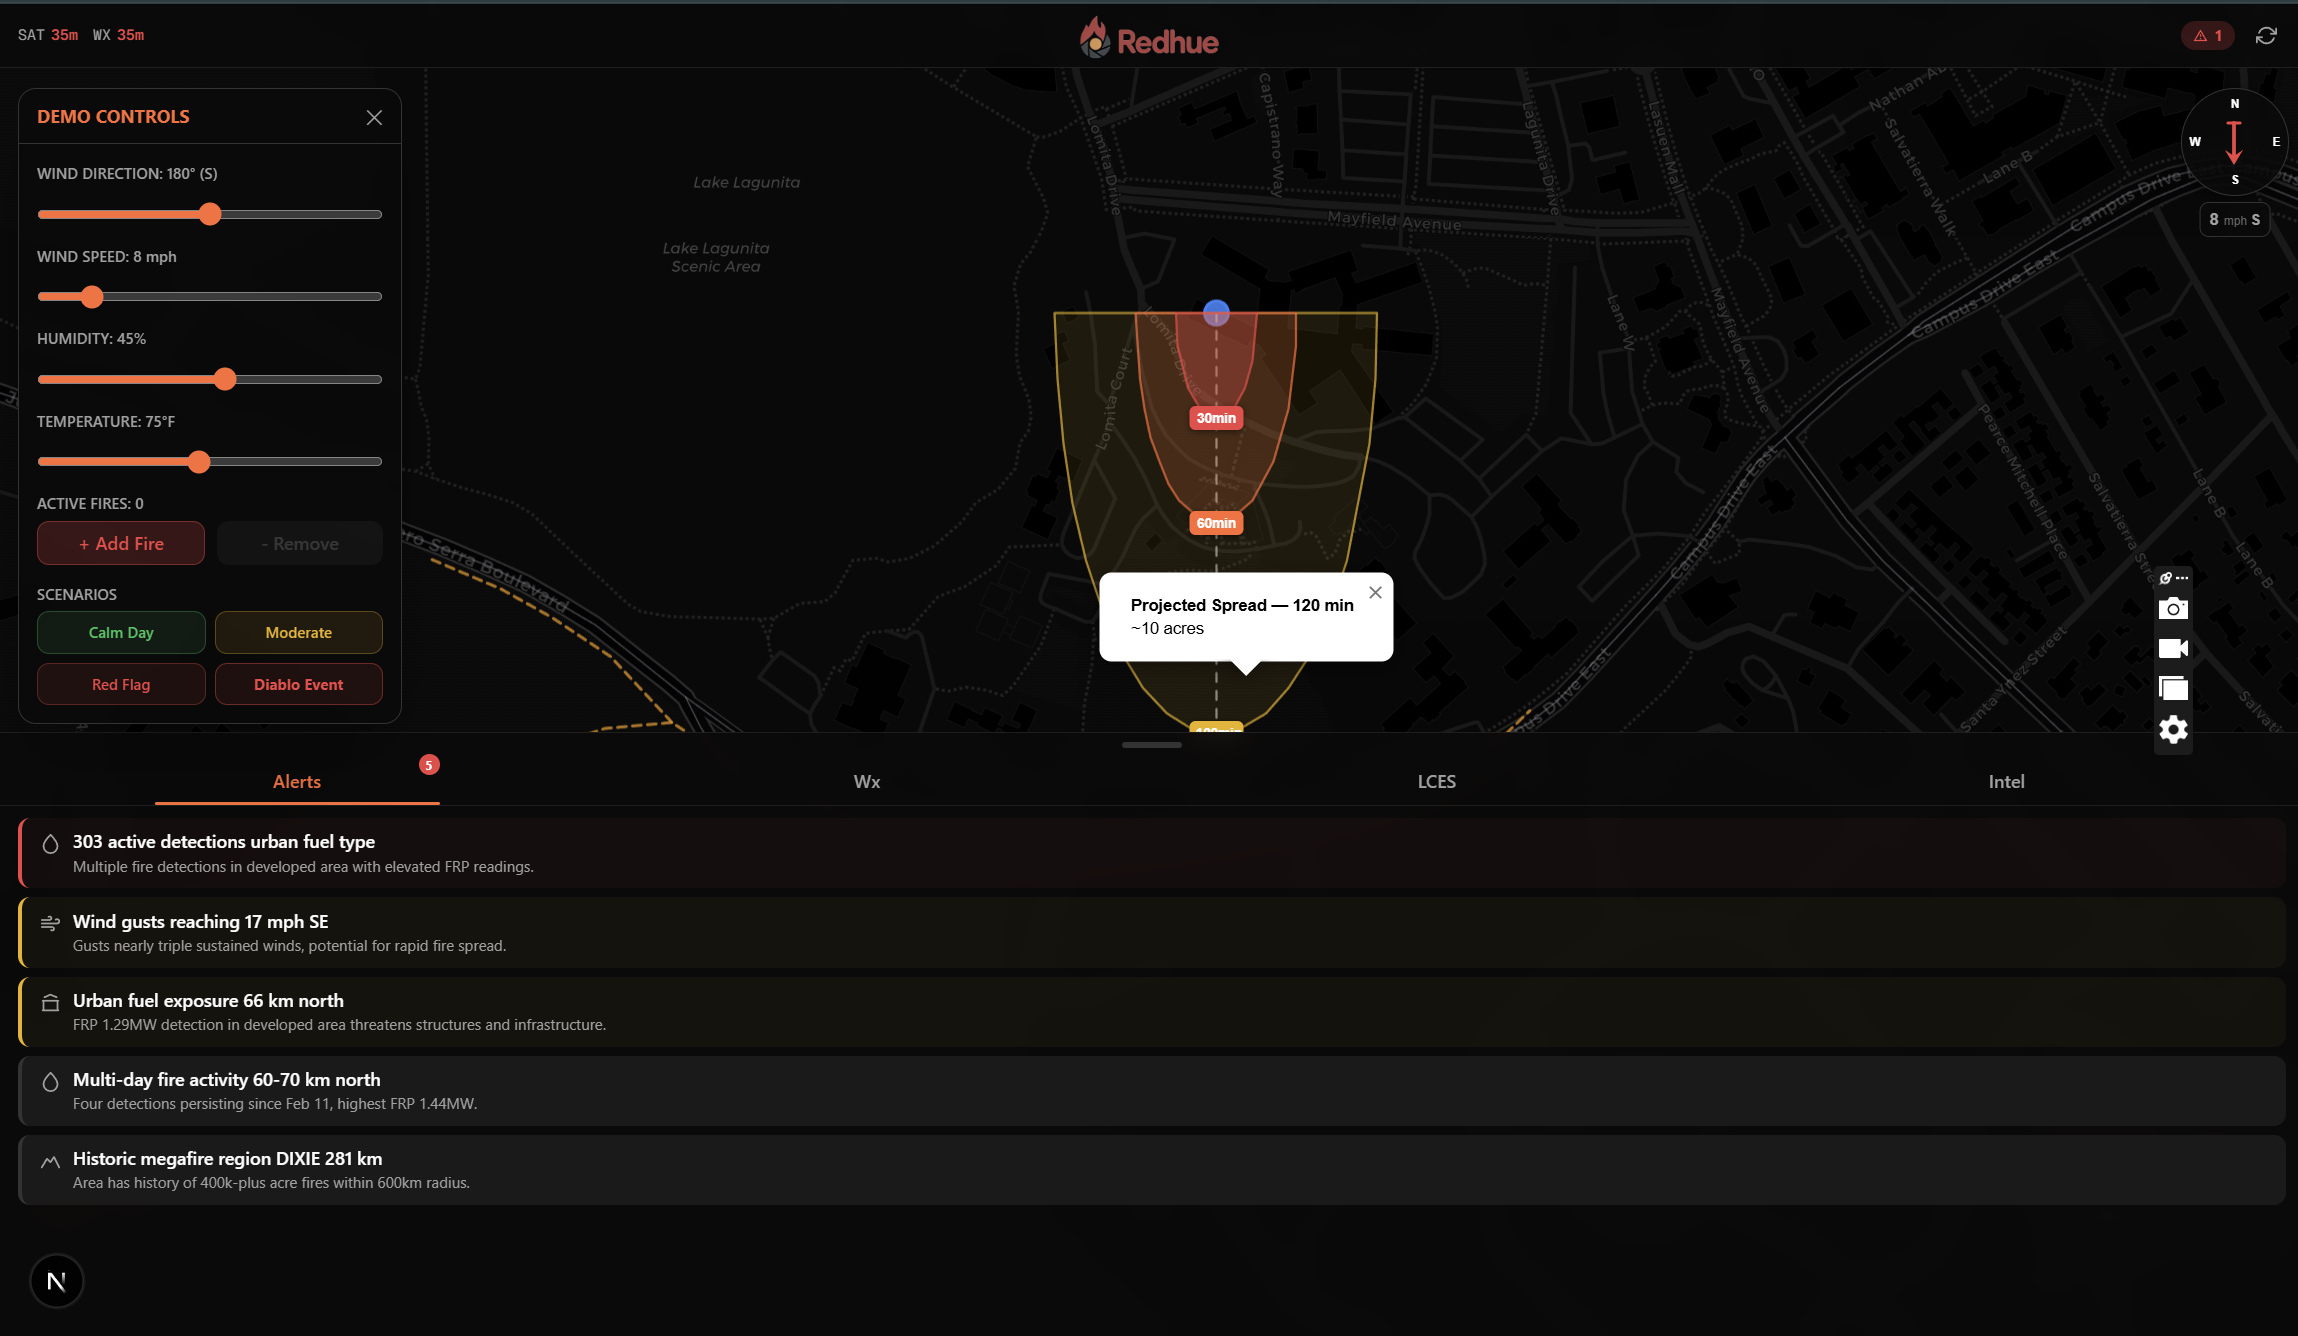
Redhue is a real-time wildfire intelligence dashboard built for Incident Commanders. It fuses 8 live data sources into a single mobile-first map interface:
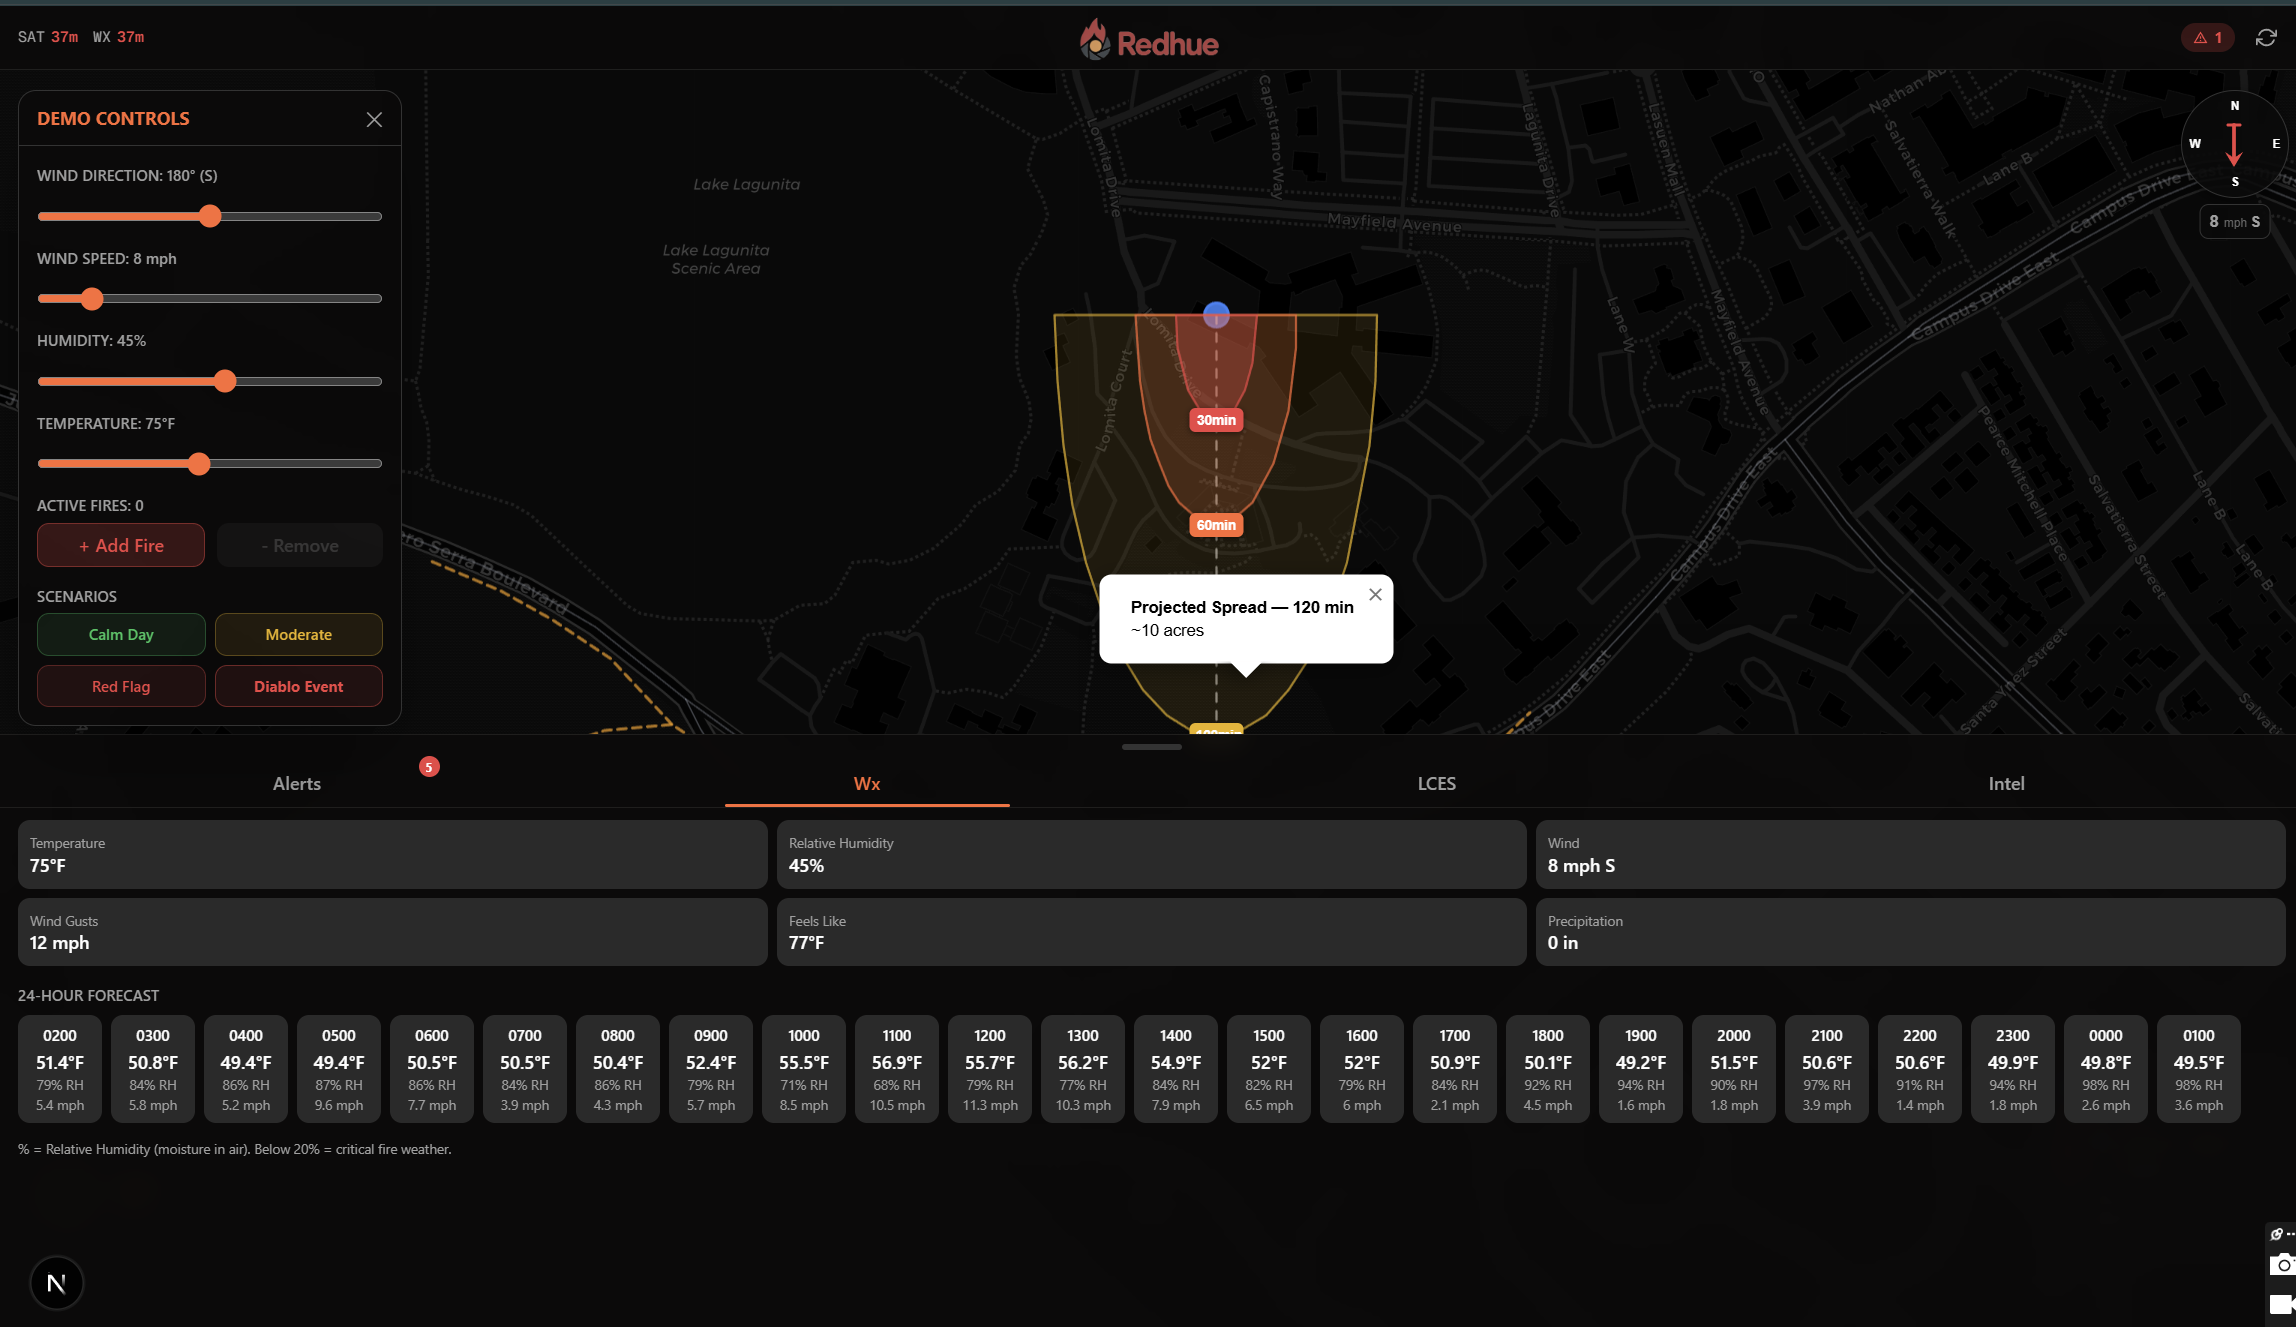
Satellite fire detection from NASA FIRMS (VIIRS + GOES-16/18) refreshing every 2.5 minutes Real-time weather with wind speed, humidity, temperature, and a scrollable 24-hour forecast with danger flagging
AI-powered fire danger scoring (0-100) mapped to NIMS incident types (Type 1-5)
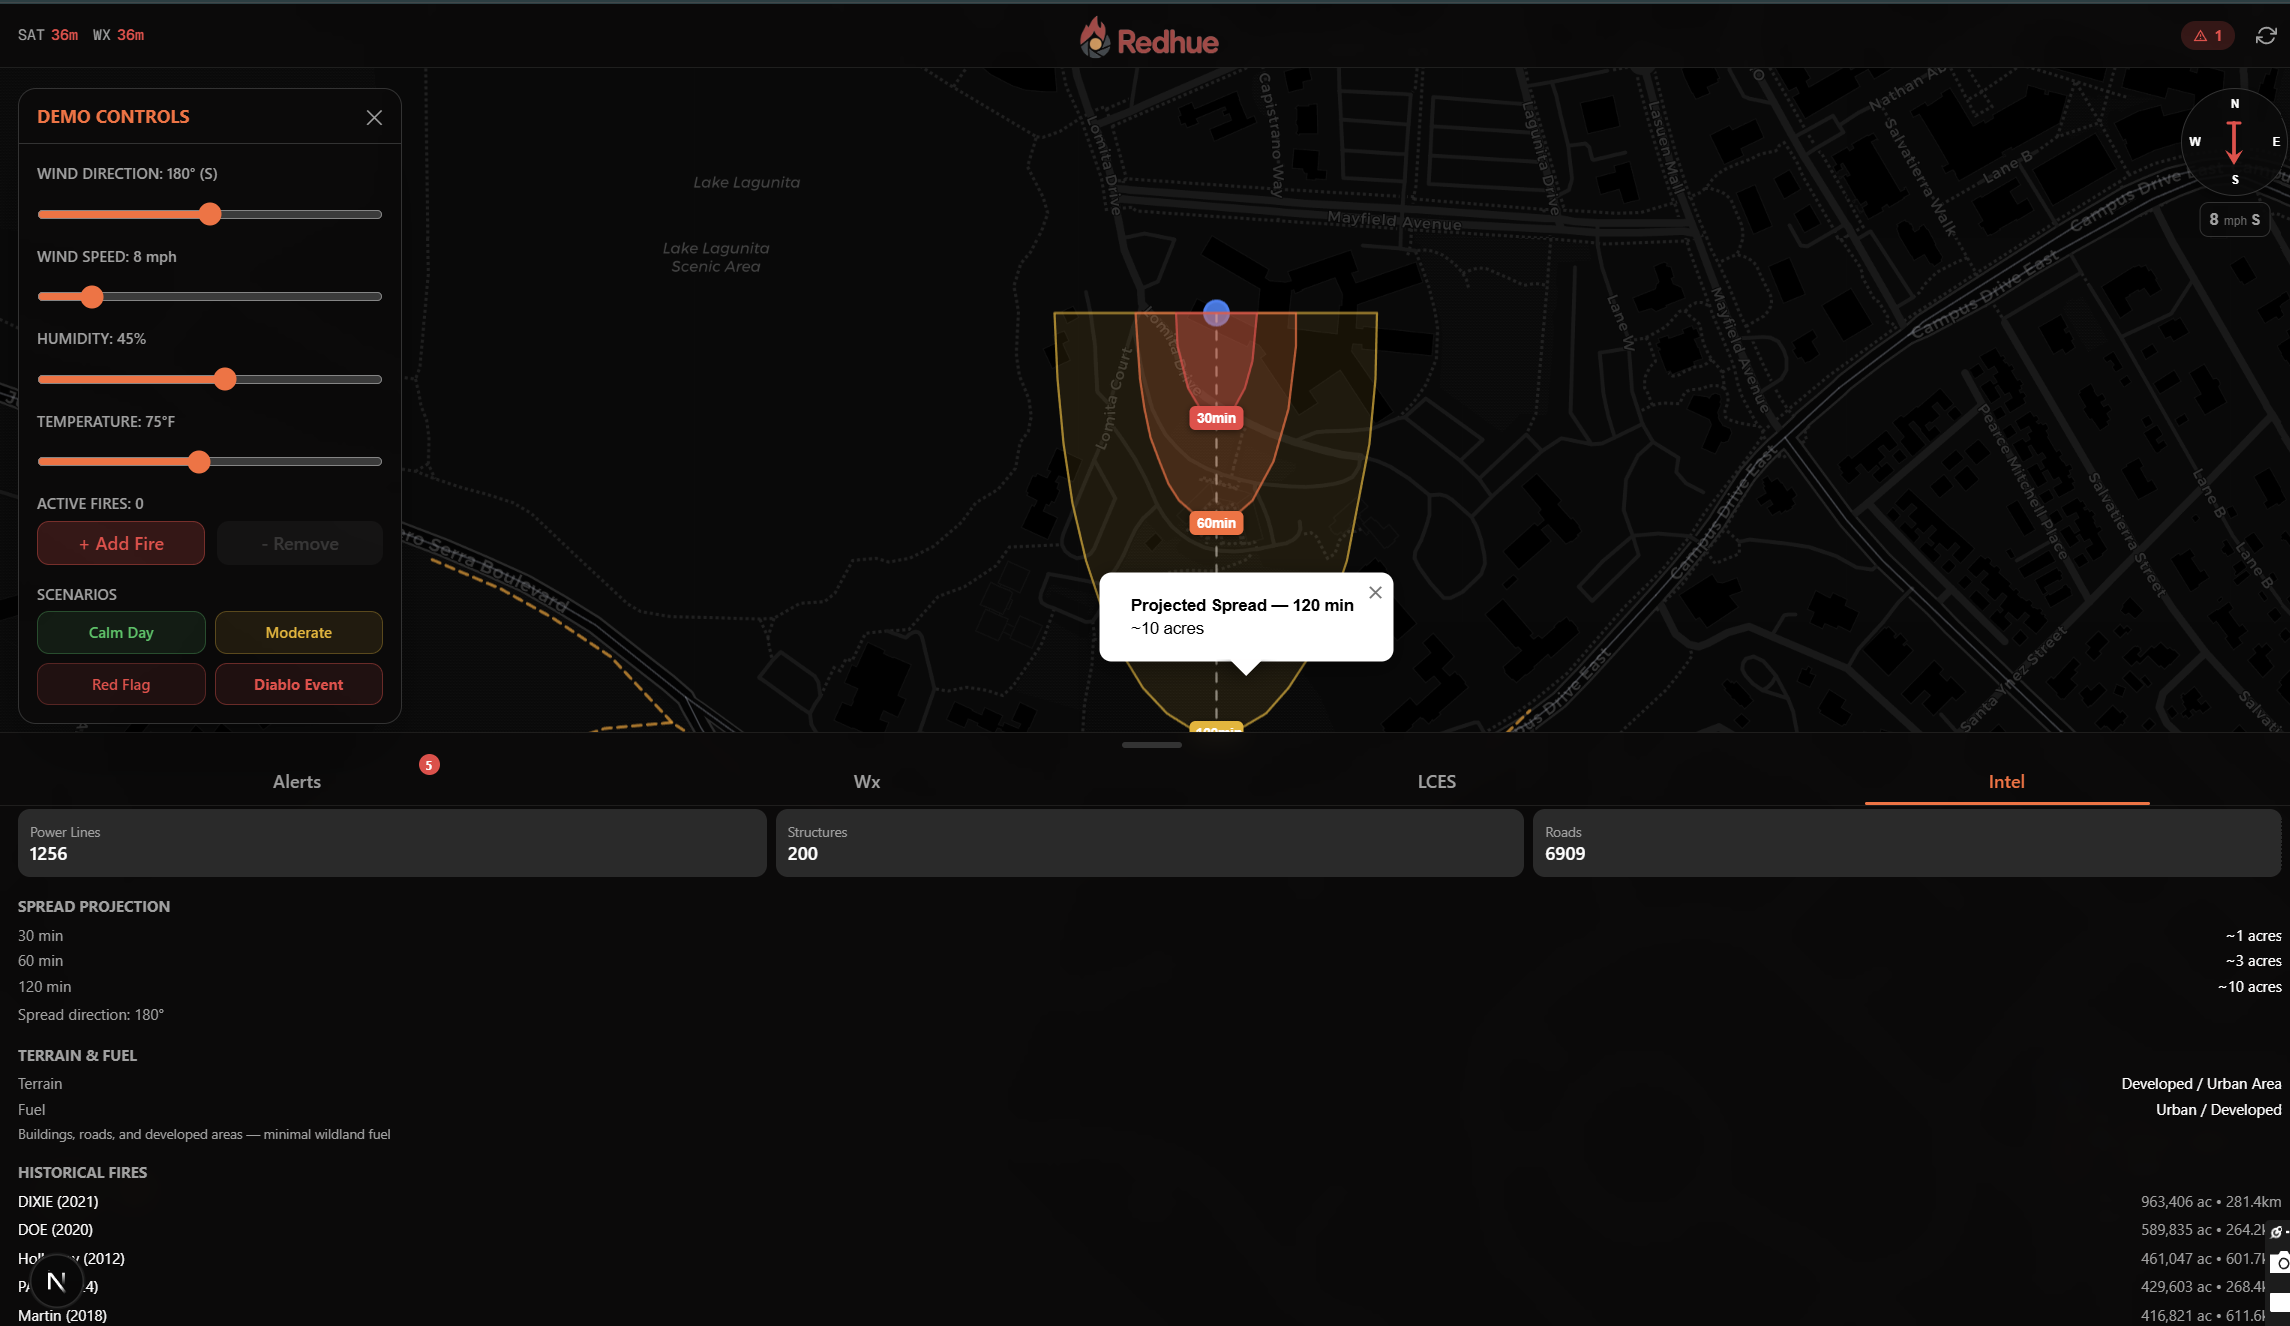
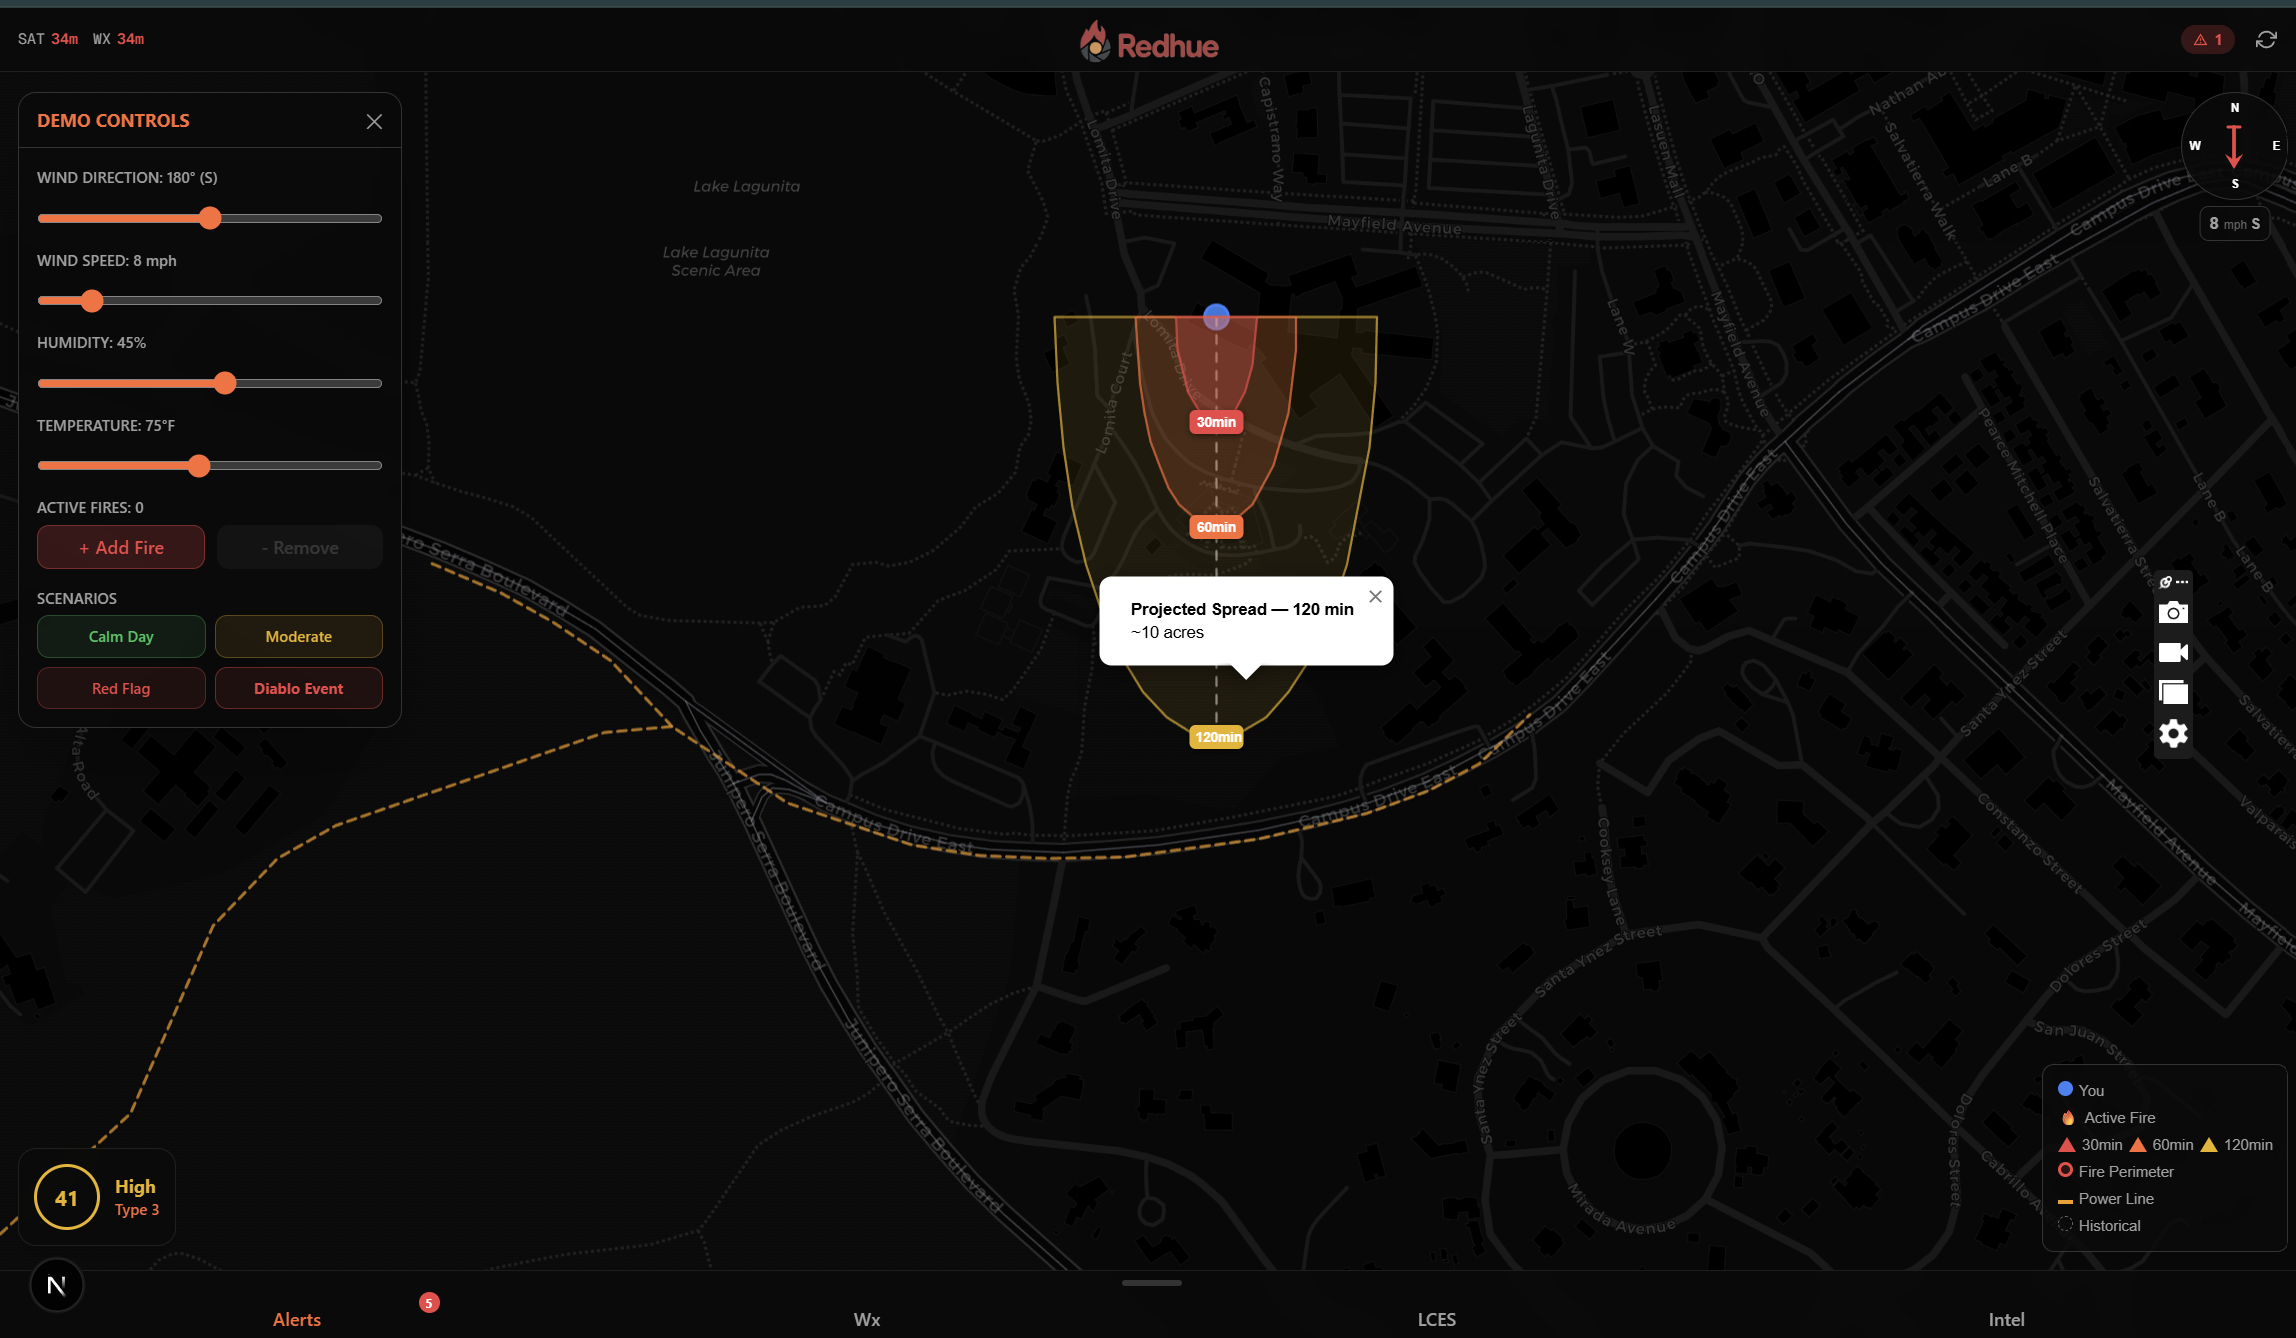
Predictive fire spread modeling using a Rothermel elliptical model that projects burn area at 30, 60, and 120 minutes
Infrastructure threat awareness: power lines, buildings, and roads overlaid on the map with counts of structures in the fire's projected path
Tactical AI alerts in radio-callout style: short headlines an IC can act on in seconds, not paragraphs
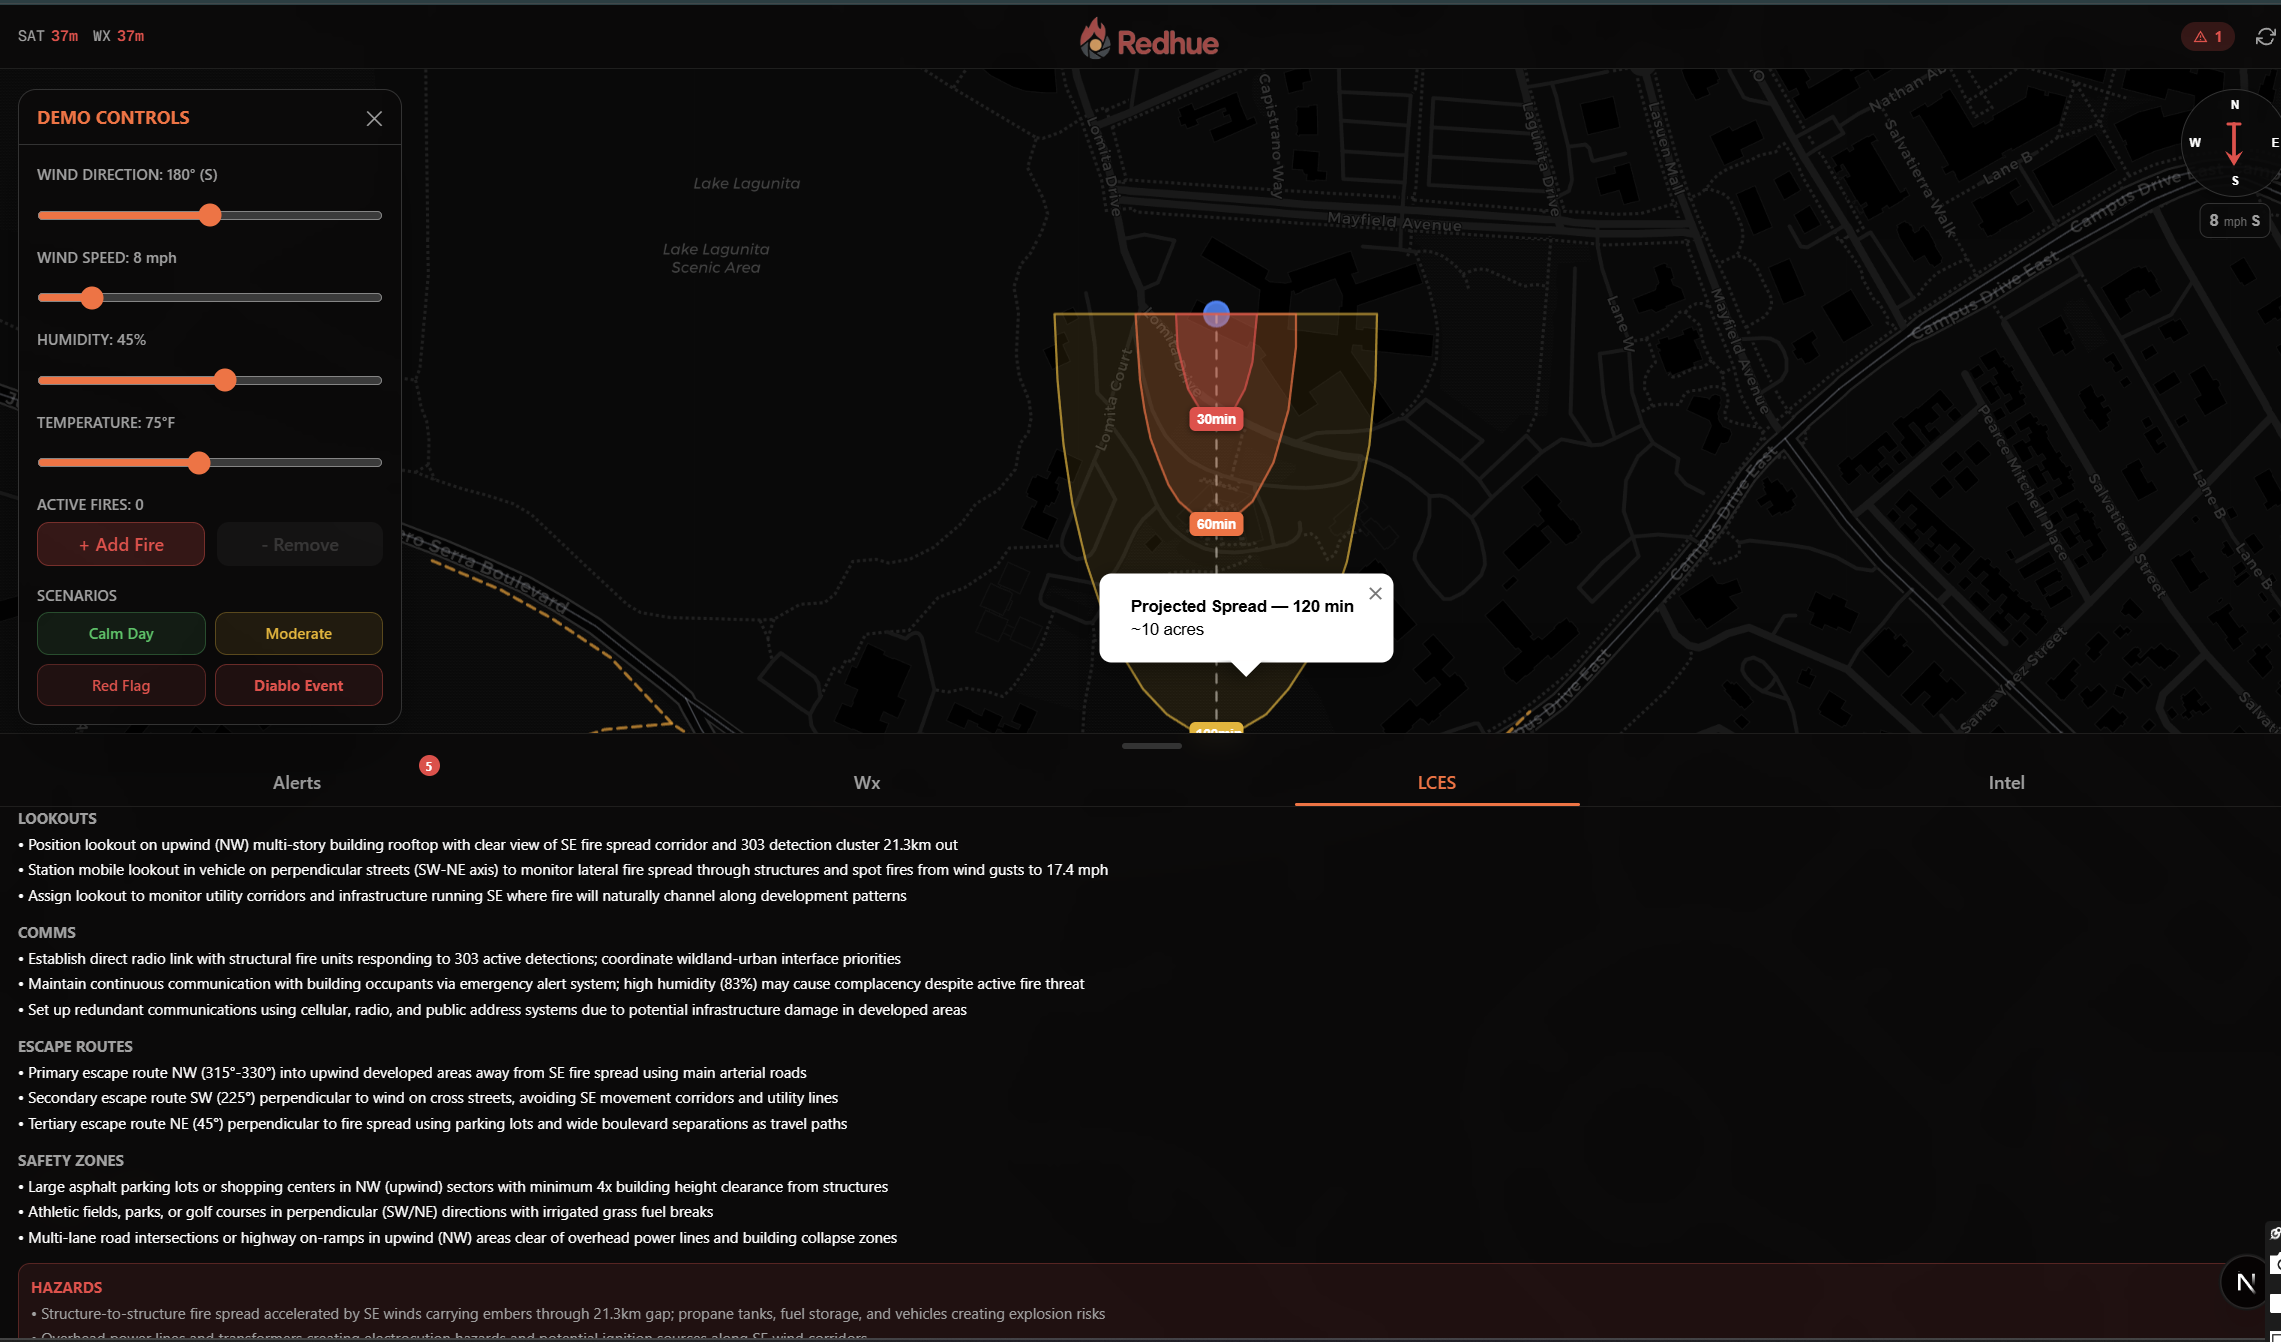
LCES safety assessment-Lookouts, Communications, Escape Routes, Safety Zones, and Hazards generated for the IC's specific location
CAL FIRE incident data and NIFC fire perimeter polygons for statewide situational awareness A device compass that rotates with the phone's magnetometer so the wind arrow always points true
An IC opens Redhue on their phone, and within seconds they have a full operational picture without manual input required
How we built it
Next.js 16 with App Router and Turbopack for the framework
React 19 + TypeScript for type-safe UI components
Leaflet + react-leaflet for the interactive map with 10+ layered data overlays
Tailwind CSS 4 for a dark-themed, mobile-first design
Claude API (Anthropic) for fire danger scoring, tactical alert generation, and LCES assessment
NASA FIRMS API for real-time VIIRS and GOES satellite fire detections
Open-Meteo API for weather data and hourly forecasts
OpenStreetMap Overpass API for infrastructure queries (power lines, buildings, roads)
ArcGIS FeatureServer endpoints for CAL FIRE incidents, NIFC fire perimeters, and MTBS/NIFC historical data
Client-side Rothermel model-the fire spread prediction runs entirely in the browser with zero latency, using fuel model lookup tables and Anderson's length-to-breadth ratio formula
DeviceOrientationEvent API for phone magnetometer integration
The architecture uses independent polling loops per data source so stale satellite data doesn't block fresh weather updates, and AI alerts only regenerate when conditions materially change (wind shifts >20°, new fire within 10km, humidity crosses critical thresholds).
Challenges I ran into
Overpass API timeouts: Our initial infrastructure query combined power lines, buildings, and roads into a single Overpass call. It consistently timed out on anything larger than a few square kilometers. I solved it by splitting into two parallel queries: power lines + roads .
Compass spinning at the 0°/360° boundary: When the user rotated their phone past north, the wind arrow would spin 359° the wrong way instead of moving 1° smoothly. I fixed this with a cumulative angle tracker using shortest-path delta rotation.
GeoJSON coordinate flipping: Every GIS API returns coordinates in [longitude, latitude] order. Leaflet expects [latitude, longitude]. I lost hours to invisible polygons before catching this.
Balancing AI call frequency: Claude produces excellent tactical analysis, but calling it on every 2.5-minute satellite refresh would be wasteful and slow. I built a smart diffing system that only triggers AI re-analysis when the situation materially changes.
Fire spread model calibration: The Rothermel model is well-documented in forestry literature but translating chains-per-hour and length-to-breadth ratios into accurate Leaflet polygon overlays required careful coordinate math and fan polygon generation.
Accomplishments that I am proud of
8 data sources, one screen, zero manual input. GPS does the rest.
The fire spread prediction runs entirely client-side. Adjust wind speed in the demo controls and watch the spread cones reshape in real time.
Radio-style tactical alerts. We spent significant time making the AI output concise enough to be read at a glance from a truck. Headlines under 8 words, details under 15 words.
The demo mode simulates a realistic Paradise, CA wildfire scenario (the site of the 2018 Camp Fire) with full interactivity: adjustable wind, humidity, temperature, and fire placement with scenario presets (Calm Day, Moderate, Red Flag, Diablo Event).
The wind compass actually works with the phone's magnetometer. Point your phone and the arrow shows true wind direction relative to where you're facing.
What I learned
Fire behavior is governed by surprisingly few variables: wind, humidity, fuel, and slope account for nearly all of it.
ICs don't want more data. They want less, presented better. Every design decision came down to "can you read this from 3 feet away in bright sunlight?"
Satellite fire detection has a real gap: VIIRS passes every 12 hours, GOES refreshes every 10-15 minutes but at lower resolution.
Building for emergency responders means designing for the worst possible conditions: low connectivity, bright sunlight, one-handed use, high stress.
What's next for Redhue
Crew tracking-blue-force GPS tracking so ICs can see where every engine company and hand crew is positioned in real time.
Evacuation route modeling-road capacity analysis and traffic prediction during mass evacuations.
Terrain-aware spread modeling-incorporate digital elevation models for slope/aspect effects on fire behavior.
Built With
- calfire
- claude
- claudeapi
- leaflet.js
- mtbs
- nasa
- next.js
- open-meteo
- react
- tailwind
- typescript

Log in or sign up for Devpost to join the conversation.