-
-
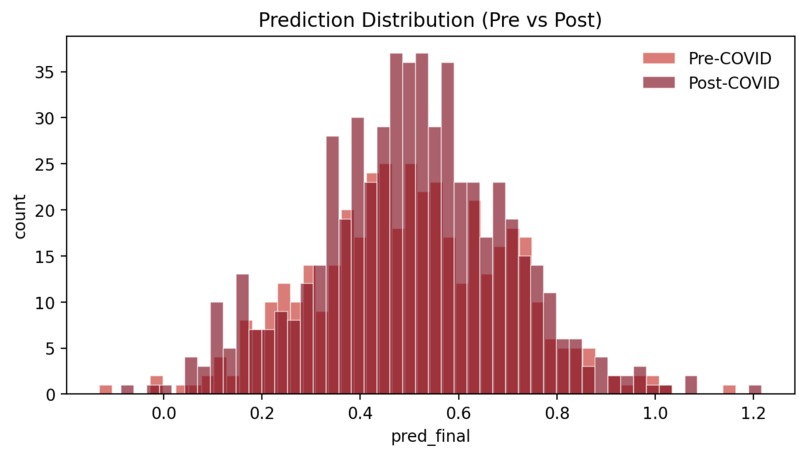
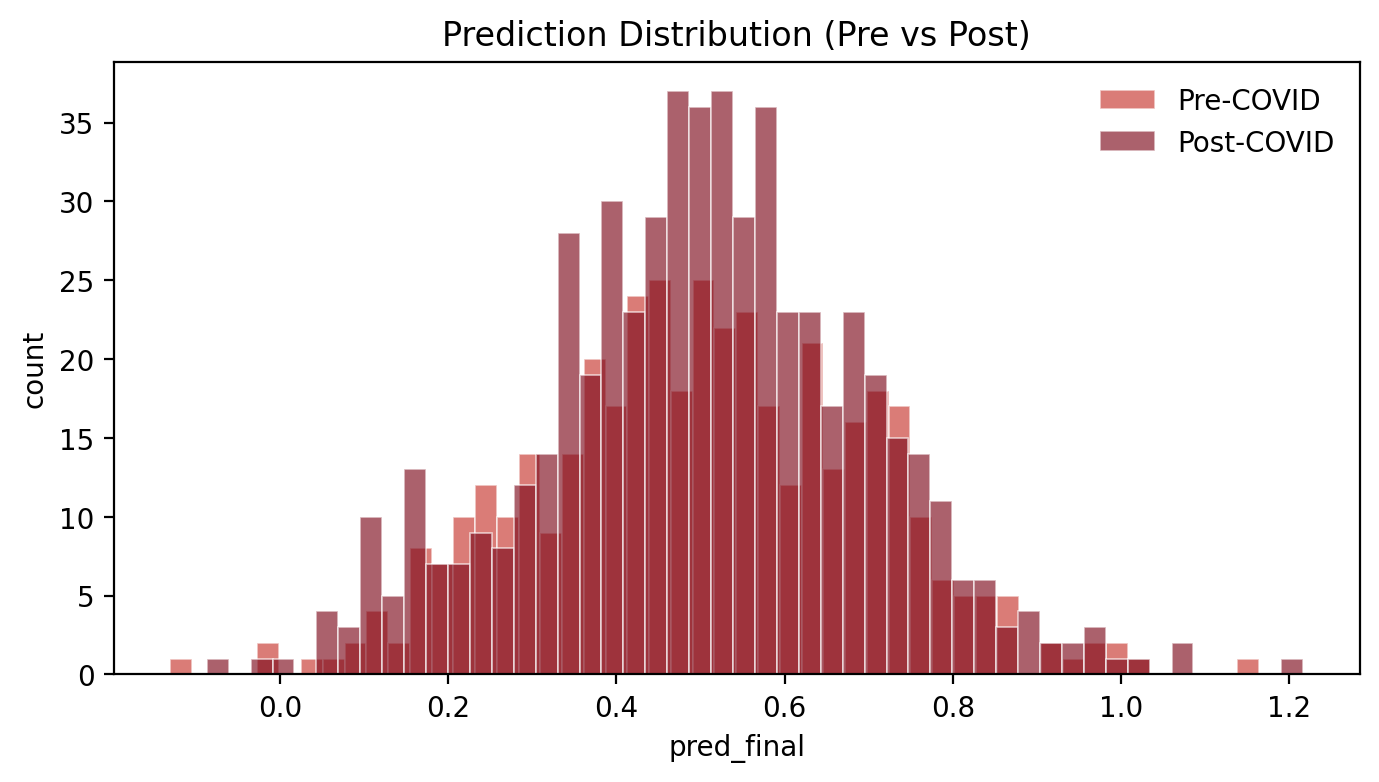
Distribution of model-predicted RevPAR growth for pre-COVID and post-COVID periods.
-

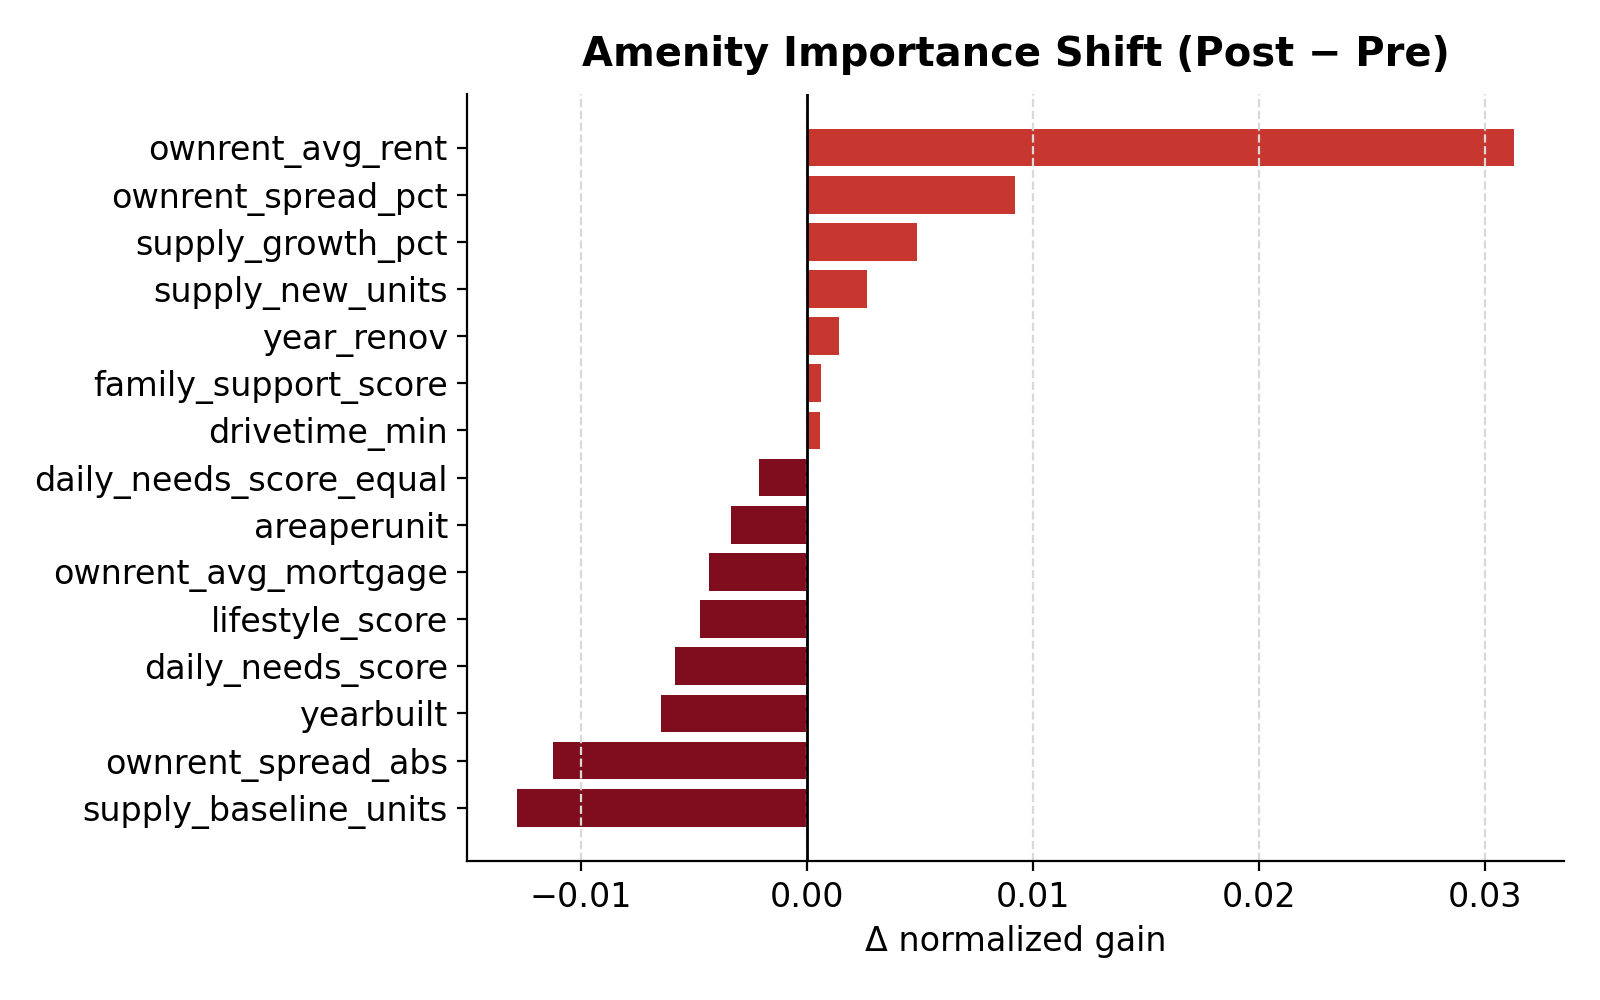
Change in normalized feature importance between post-COVID and pre-COVID models.
-
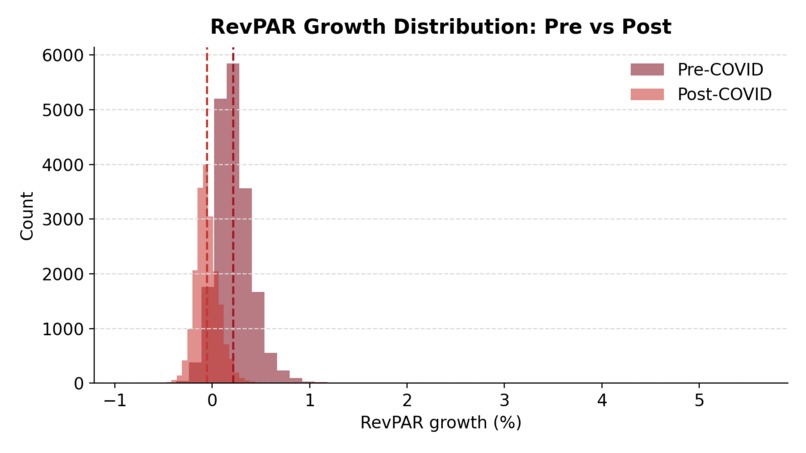
Observed RevPAR growth distributions before and after COVID.
-
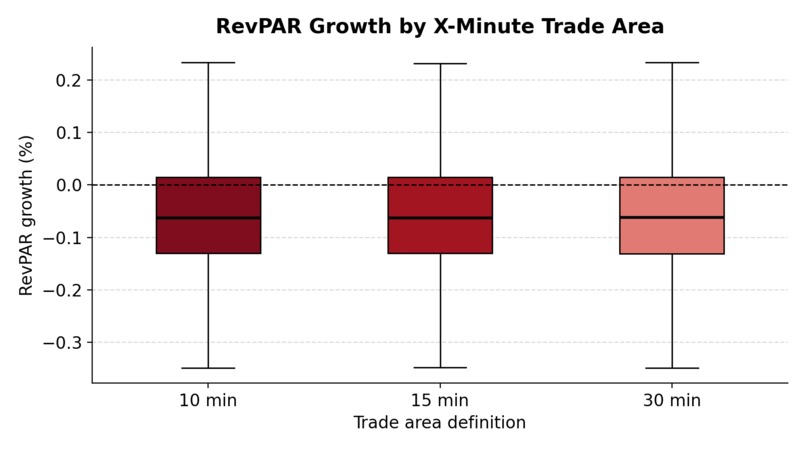
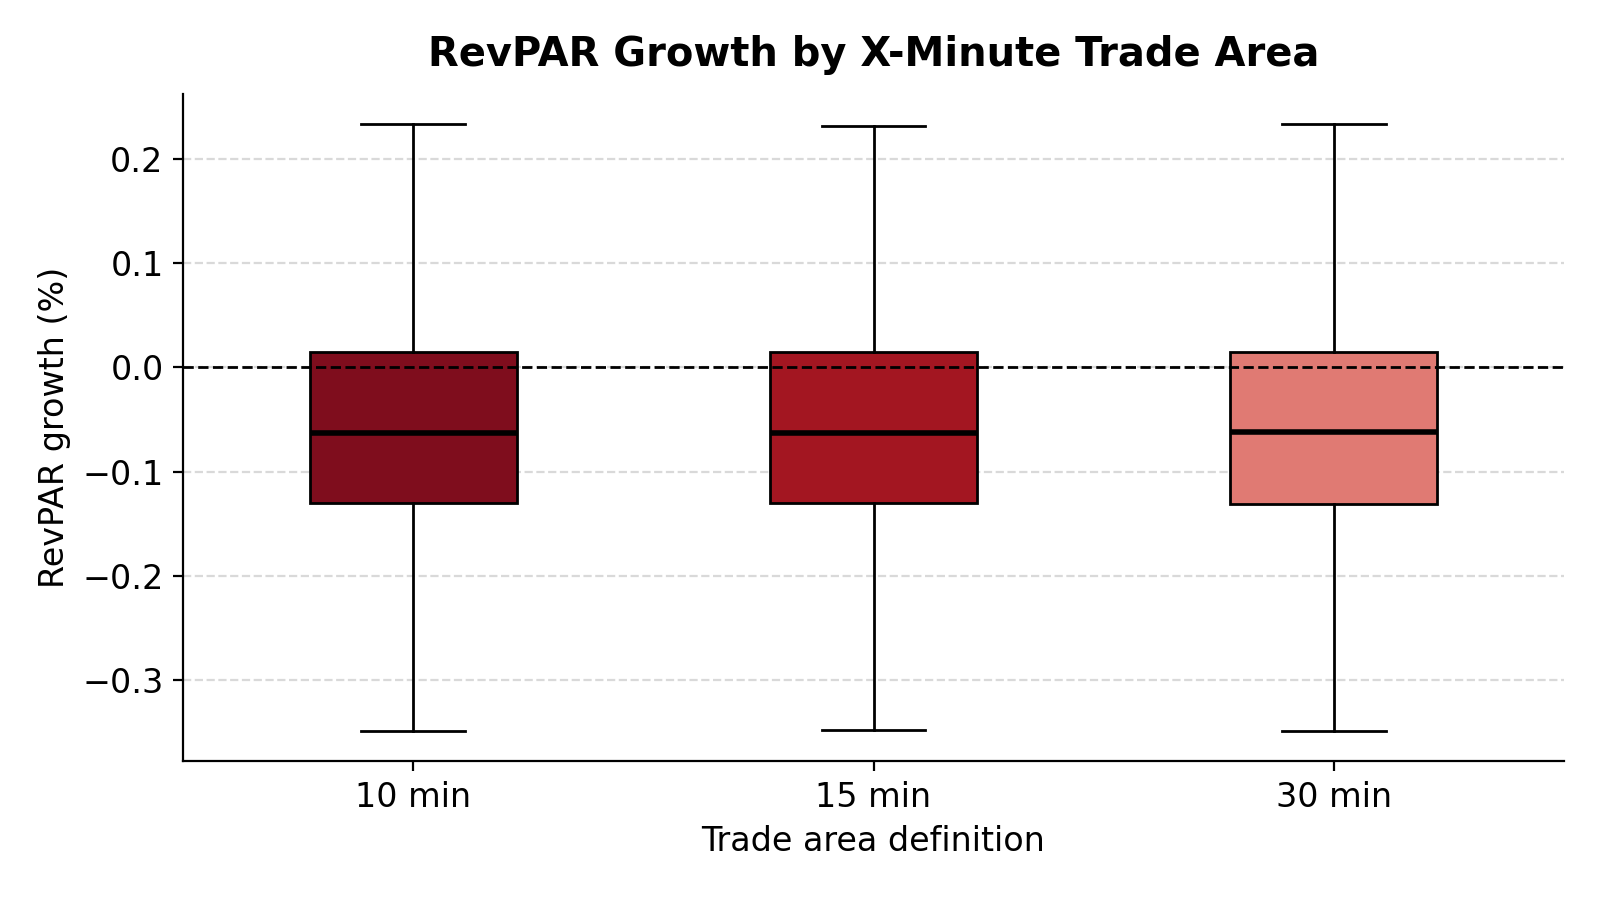
Distribution of RevPAR growth across 10-, 15-, and 30-minute trade area definitions.

Inspiration
This project was inspired by the rapid shift in renter behavior following COVID. Historically, apartment performance was closely tied to proximity to downtown jobs and dense urban cores. However, hybrid and remote work changed how renters think about distance, daily travel, and what it means for a neighborhood to be “convenient.”
We wanted to move beyond anecdotal claims and use data to test whether the definition of “local” has structurally changed.
Core Problem We Addressed
Our core problem was to understand and predict why some multifamily properties outperform their peers in RevPAR growth, and whether the drivers of that outperformance differ before versus after COVID.
Specifically, we focused on whether different definitions of local access (10/15/30‑minute trade areas) and different bundles of neighborhood amenities better explain performance in each period.
How We Built the Project
We framed the task as a property‑level machine learning problem, using panel data with repeated observations of the same assets across time windows and trade‑area definitions.
To ensure realistic evaluation, we used property‑grouped cross‑validation, so that a property never appears in both training and validation sets.
Rather than relying on thousands of raw amenity counts, we engineered interpretable amenity bundles (e.g., daily needs, lifestyle, and family support) designed to reflect how renters actually experience neighborhoods.
We used gradient‑boosted decision trees (LightGBM) to capture nonlinear relationships and interactions while maintaining strong performance on structured, tabular real estate data.
What We Found
We found that neighborhood advantage is not static. The drivers of apartment outperformance depend on both time period and how “local” is defined.
More broadly, we learned that modeling renter‑relevant bundles of amenities and respecting the panel structure of the data materially improves both predictive performance and interpretability. This reinforced the importance of aligning feature engineering with real‑world behavioral concepts rather than relying on raw proximity metrics alone.
Challenges We Faced
One major challenge was avoiding data leakage in a panel setting, which required careful use of GroupKFold and group‑safe encoding strategies.
We also evaluated multiple model families, including linear regression and random forest–style models. These simpler models struggled to capture nonlinear interactions between asset characteristics, market structure, and amenity access. Gradient‑boosted trees (LightGBM) provided a better balance of accuracy, flexibility, and interpretability for this problem.
Finally, limitations in the data, such as the lack of direct measures of remote work intensity, commuting behavior, and amenity quality, required careful framing of results as predictive and associational, rather than strictly causal.
Future Improvements
Future work could strengthen this framework by incorporating direct measures of work‑from‑home intensity, commuting patterns, and transit usage, allowing a more precise link between travel behavior and amenity value.
Additional improvements could include amenity quality and capacity measures, richer asset‑level operational data (e.g., renovations and management changes), and causal modeling approaches to better separate structural neighborhood effects from short‑term property‑specific shocks.
Built With
- catboost
- lightgbm
- matplotlib
- numpy
- pandas
- python
- scikit-learn


Log in or sign up for Devpost to join the conversation.