-
-
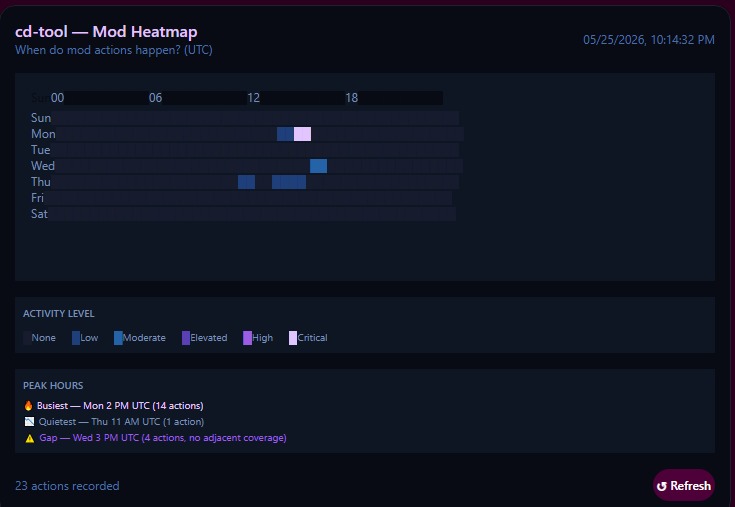
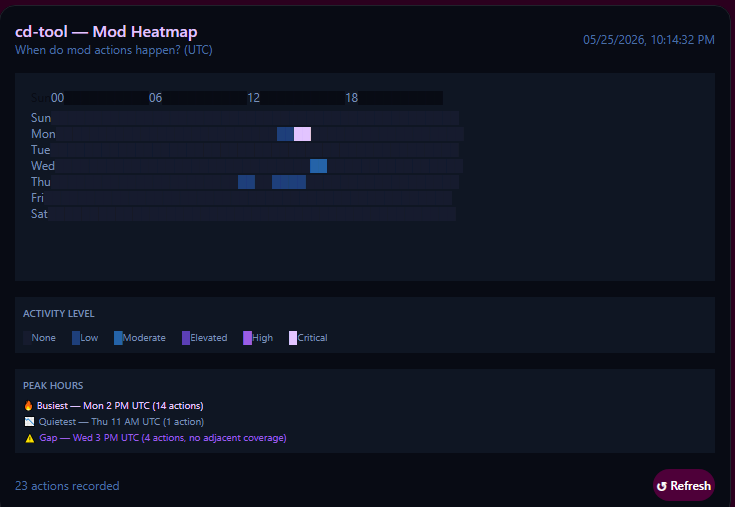
cd-tool Moderation Heatmap 7×24 grid showing mod action patterns with Peak Hours summary
Inspiration
Moderators spend too much time reacting to problems instead of preventing them. We wanted to give mod teams data-driven tools built directly into Reddit.
What it does
cd-tool gives moderators two connected capabilities:
Moderation Heatmap A 7×24 visual grid showing when mod actions (removals, bans) are most concentrated by day and hour. Includes a Peak Hours card showing the busiest time, quietest time, and coverage gaps.
Flair Risk Scorer Shows the historical removal rate for each post flair. Displays High (50%+), Medium (30–49%), Low (under 30%), or Insufficient data (under 10 posts tracked).
How we built it
Built on Devvit 0.12.22 using TypeScript. Event triggers (onPostDelete, onBanUser, onModAction) aggregate mod actions into Redis. The heatmap UI is a custom Devvit post. Flair risk scores are calculated from Redis counters tracking removals and total posts per flair.
Challenges we ran into
Devvit post-level menu items don't render reliably on new Reddit, we moved flair risk to the subreddit menu. TypeScript type definitions for ModActionTarget required casting to access post flair data.
Accomplishments that we're proud of
The heatmap renders live data with a colour intensity scale and a Peak Hours summary card that highlights coverage gaps automatically.
What we learned
Devvit's Redis storage is powerful but requires careful schema design to stay within limits. Aggregating counts instead of raw events was the right call.
What's next for cd-tool
Configurable thresholds, auto-badge on high-risk posts, cross-subreddit comparisons, and predictive alerting via Discord webhooks.
Built With
- devvit
- redis
- typescript

Log in or sign up for Devpost to join the conversation.