Inspiration
A teammate mentioned that divers at La Jolla Cove had no way to know if the water was safe before getting in. That seemed like a solvable problem. Scripps Institution of Oceanography sits 800 meters away and has been measuring the ocean every four minutes since 2005. That data is public. Nobody had connected it to the person actually entering the water. That gap is what we built for.
What it does
The La Jolla Red Tide Sentinel detects when Lingulodinium polyedra, the organism responsible for San Diego red tides, is building toward a dangerous event. It fuses 18 years of Scripps Pier oceanographic records with a live optical sensor and camera node to produce a real-time risk alert: normal, active bloom, or decay hypoxia. The system tells a diver, a dive shop, or an aquarium intake operator whether the water is safe before they find out the hard way.
How we built it
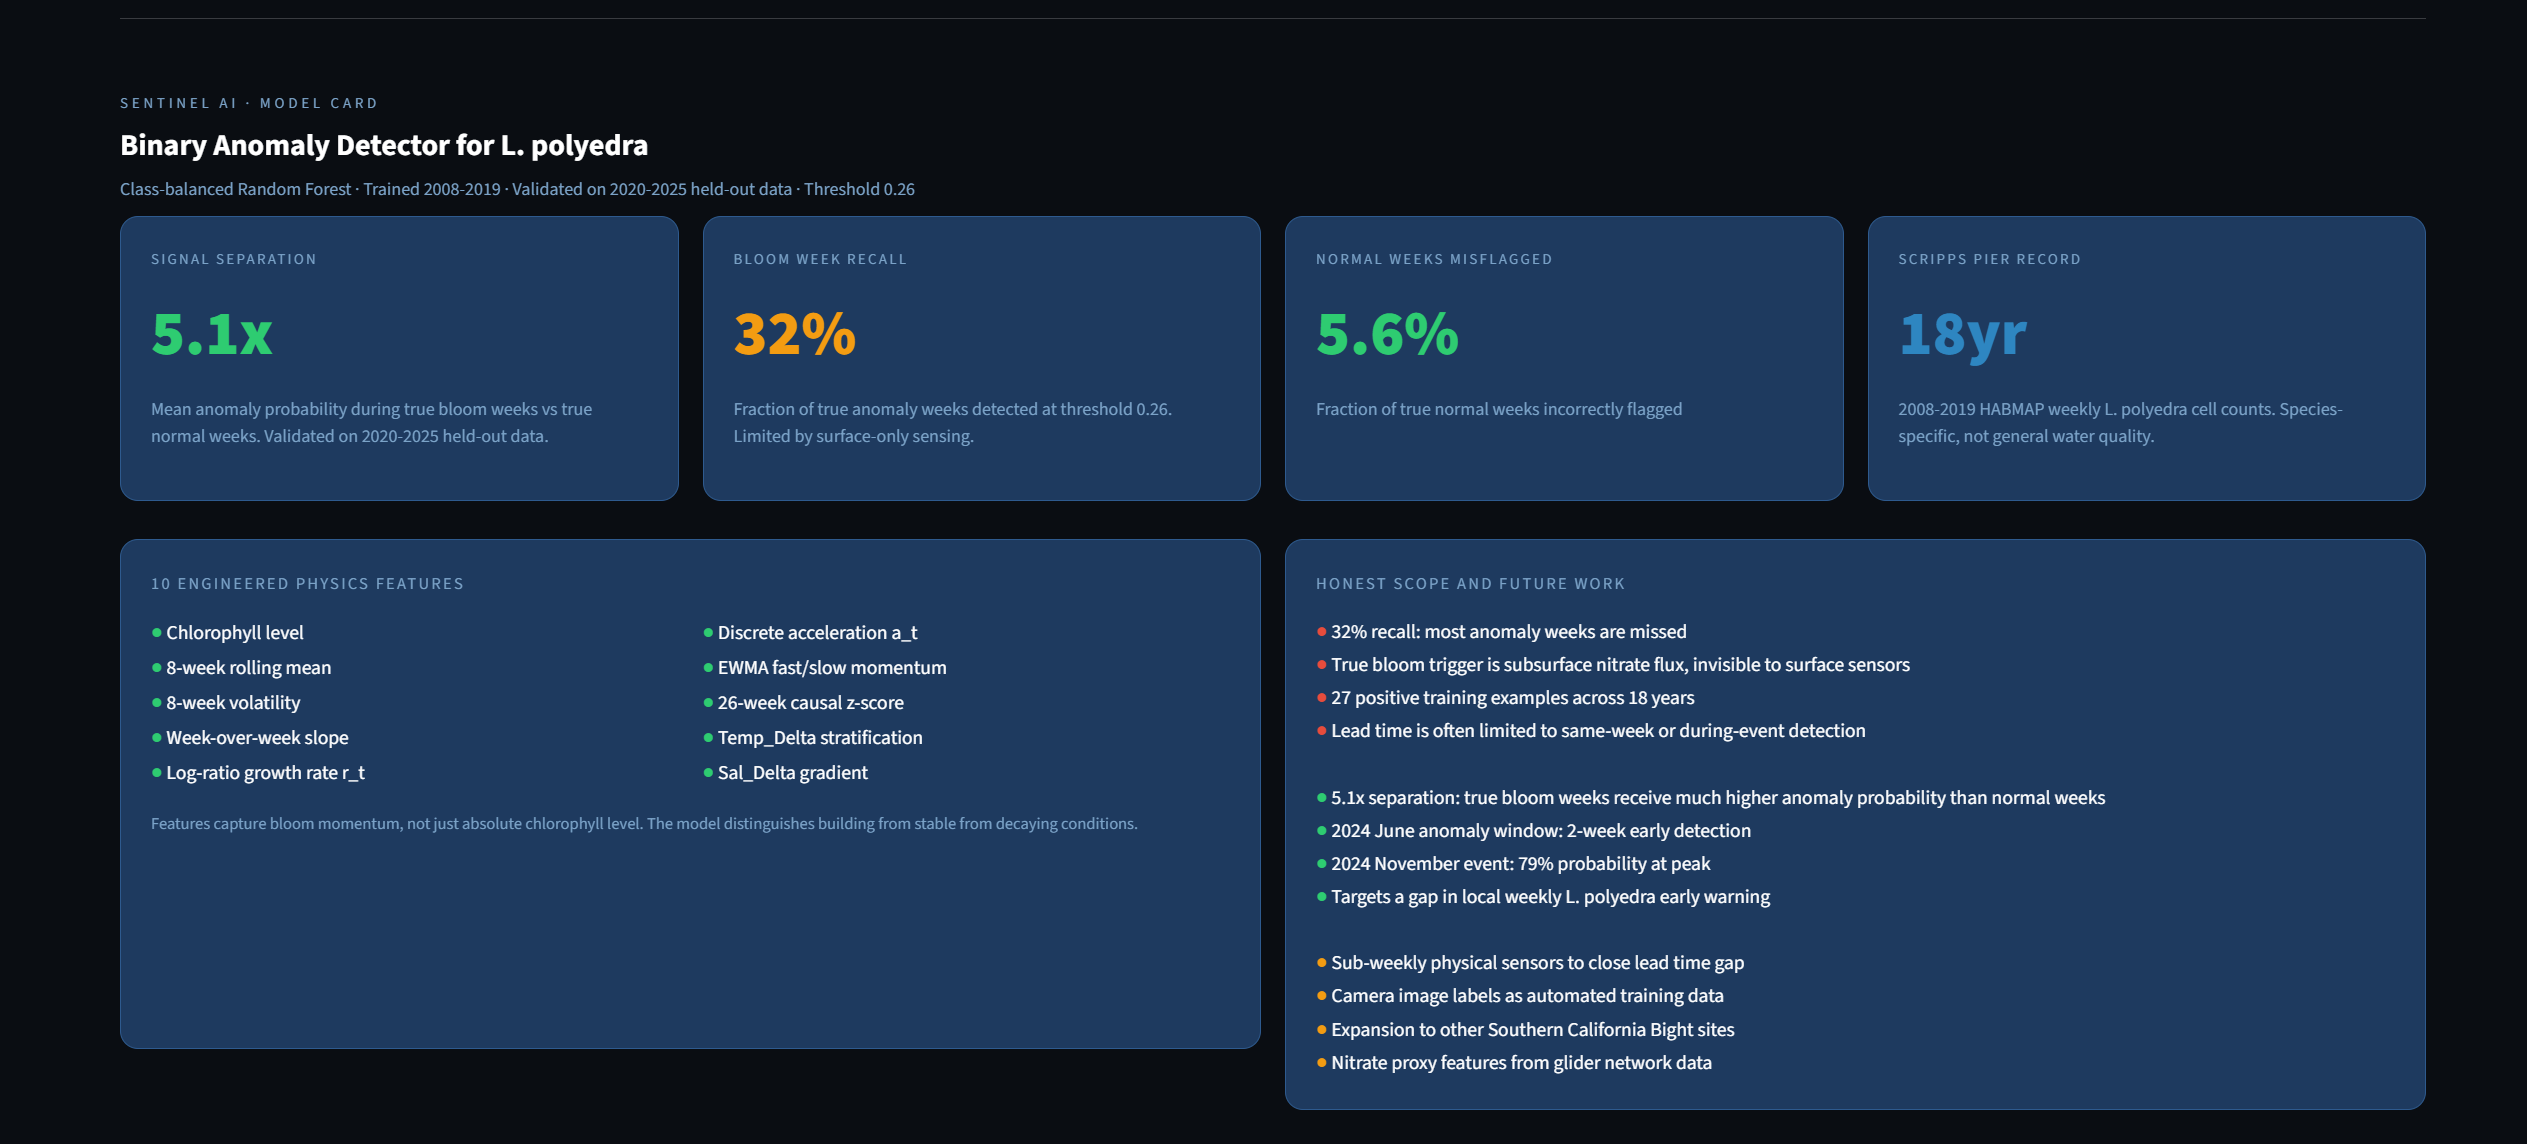
We started with the data. The SCCOOS HABMAP program has been counting L. polyedra cells weekly at Scripps Pier since 2008. We downloaded 18 years of those records alongside chlorophyll, temperature, and salinity measurements, then built a binary anomaly classifier using a class-balanced Random Forest. The model does not look at raw chlorophyll levels. It looks at how the ocean is changing: week-over-week growth rate, discrete acceleration of chlorophyll, EWMA momentum, thermal stratification from surface-to-bottom temperature delta, and a 26-week causal z-score. These features capture bloom momentum rather than bloom presence.
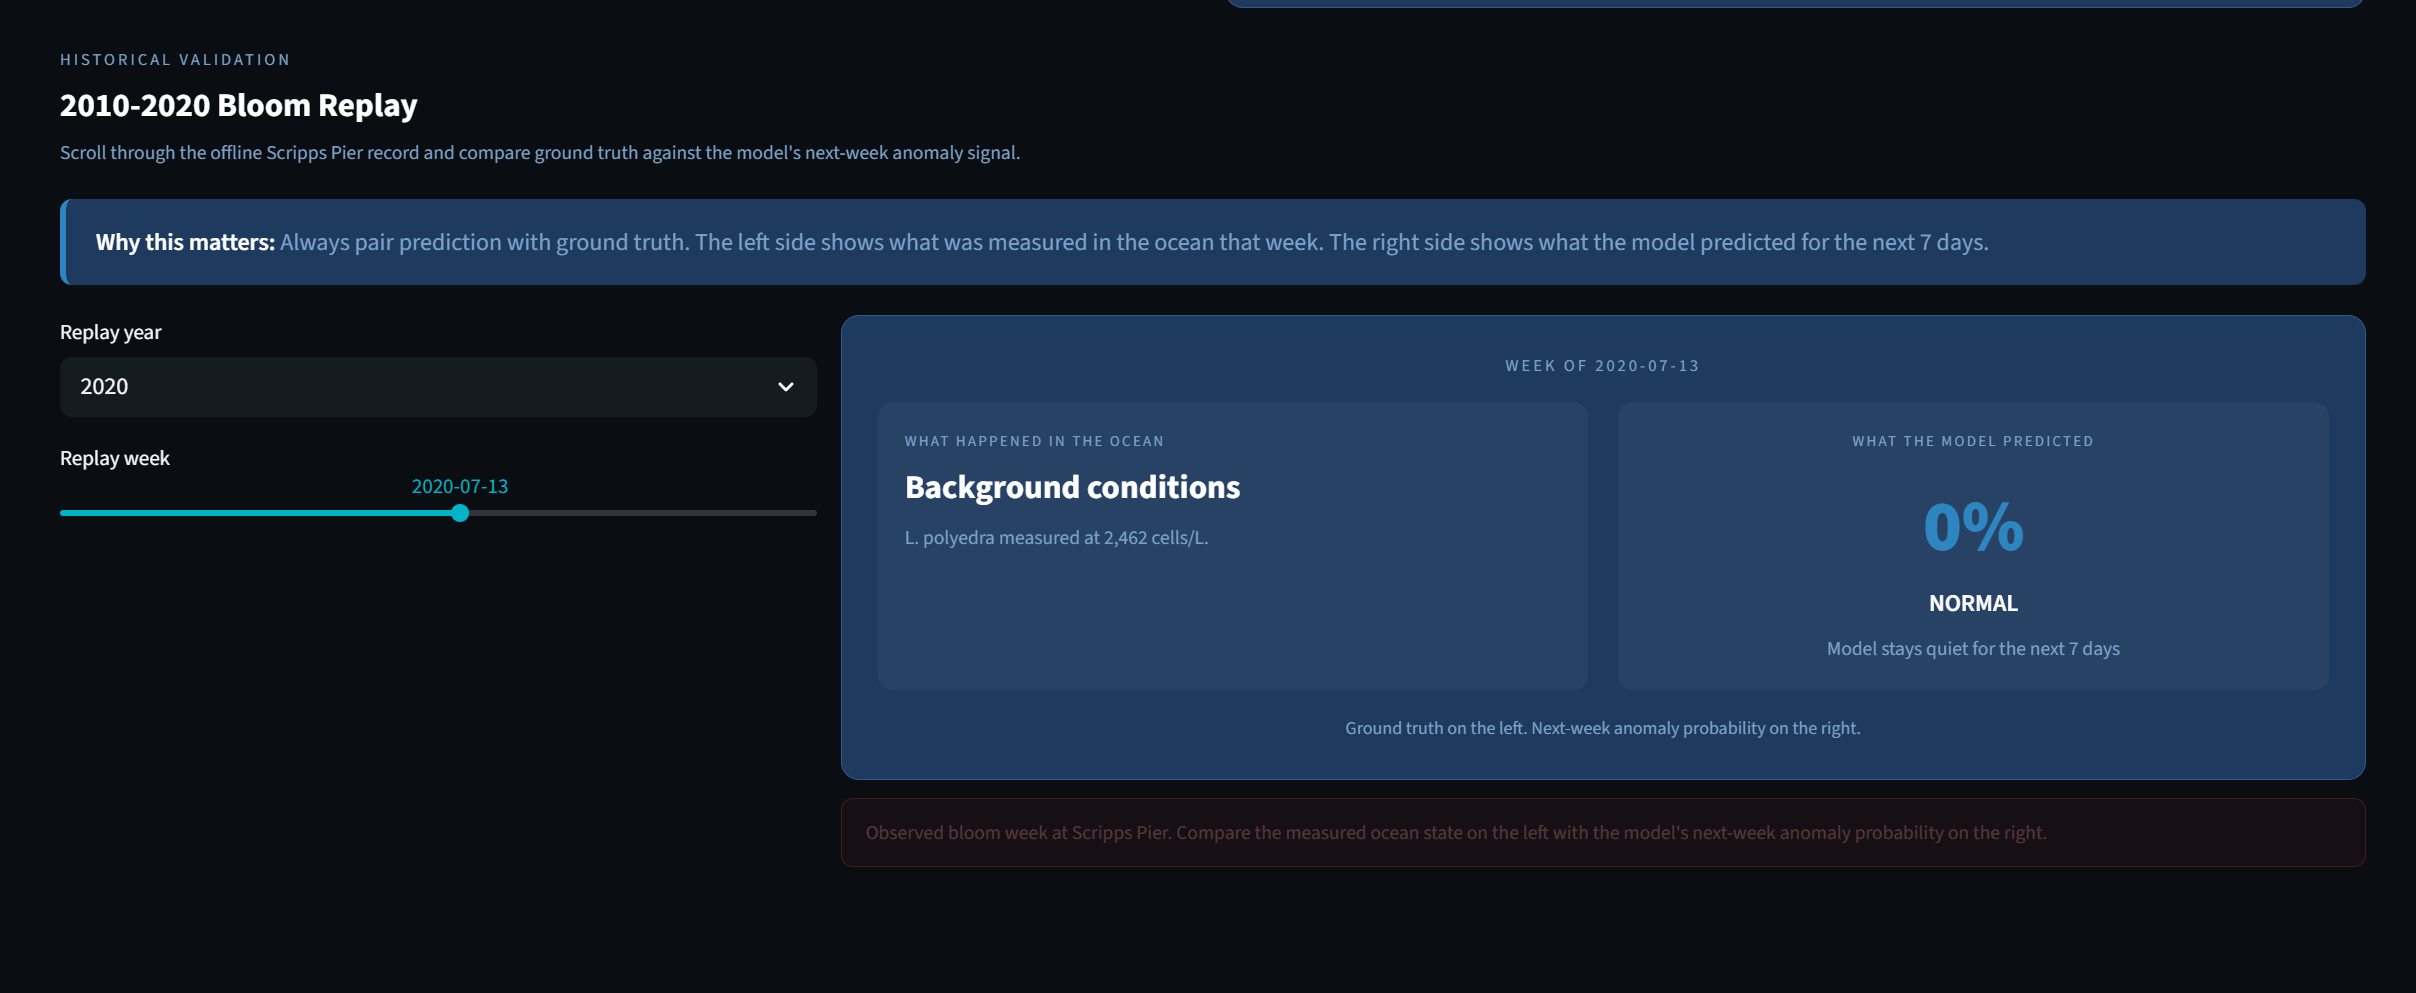
We trained on 2008 to 2019 and validated on 2020 to 2025. The model achieves 5.1 times higher anomaly probability during true bloom weeks than during normal weeks. On the 2020 event, the largest bloom in 47 years of Scripps records, it reached 95 percent confidence at the peak. On the June 2024 event, it flagged elevated risk two weeks before cell counts crossed the bloom threshold.
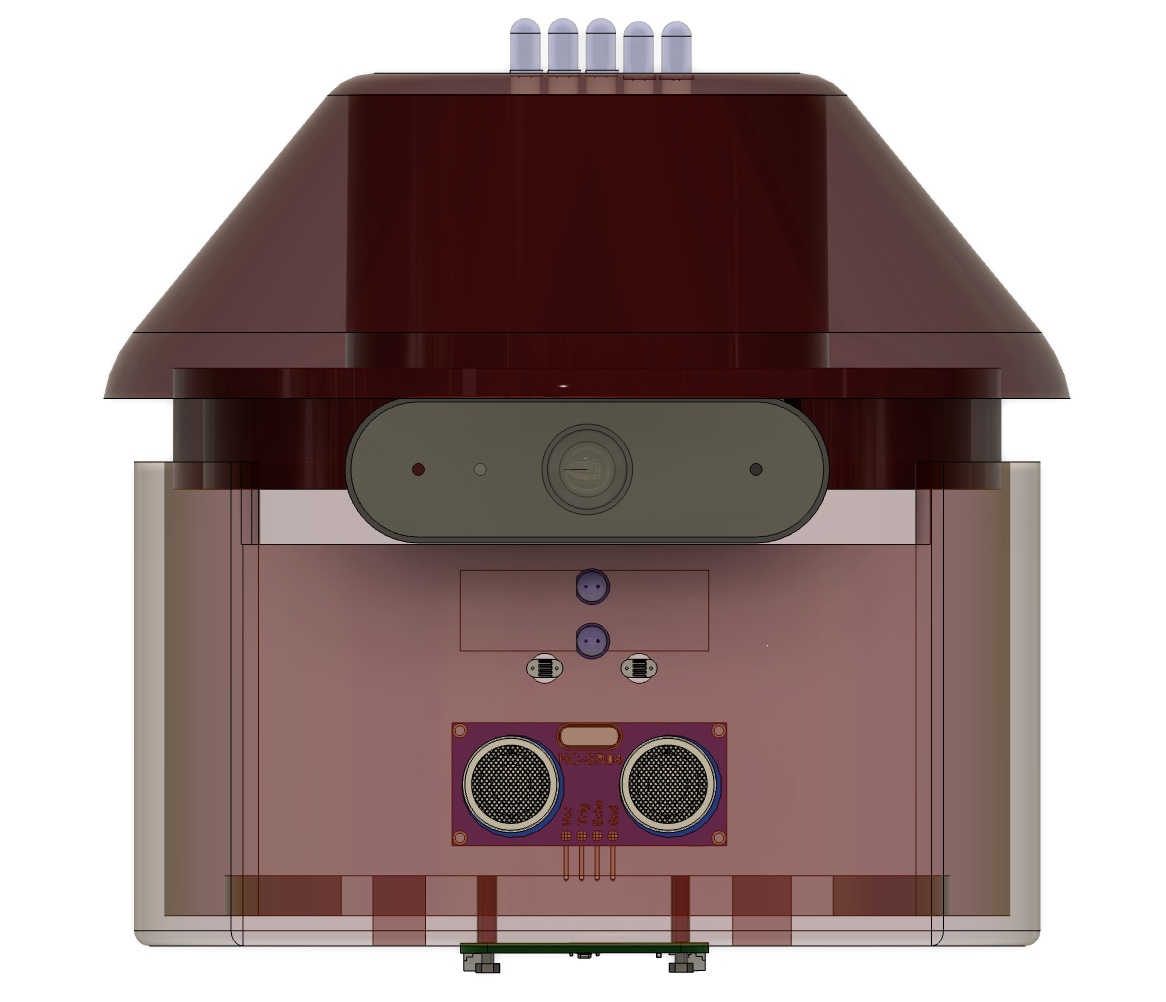
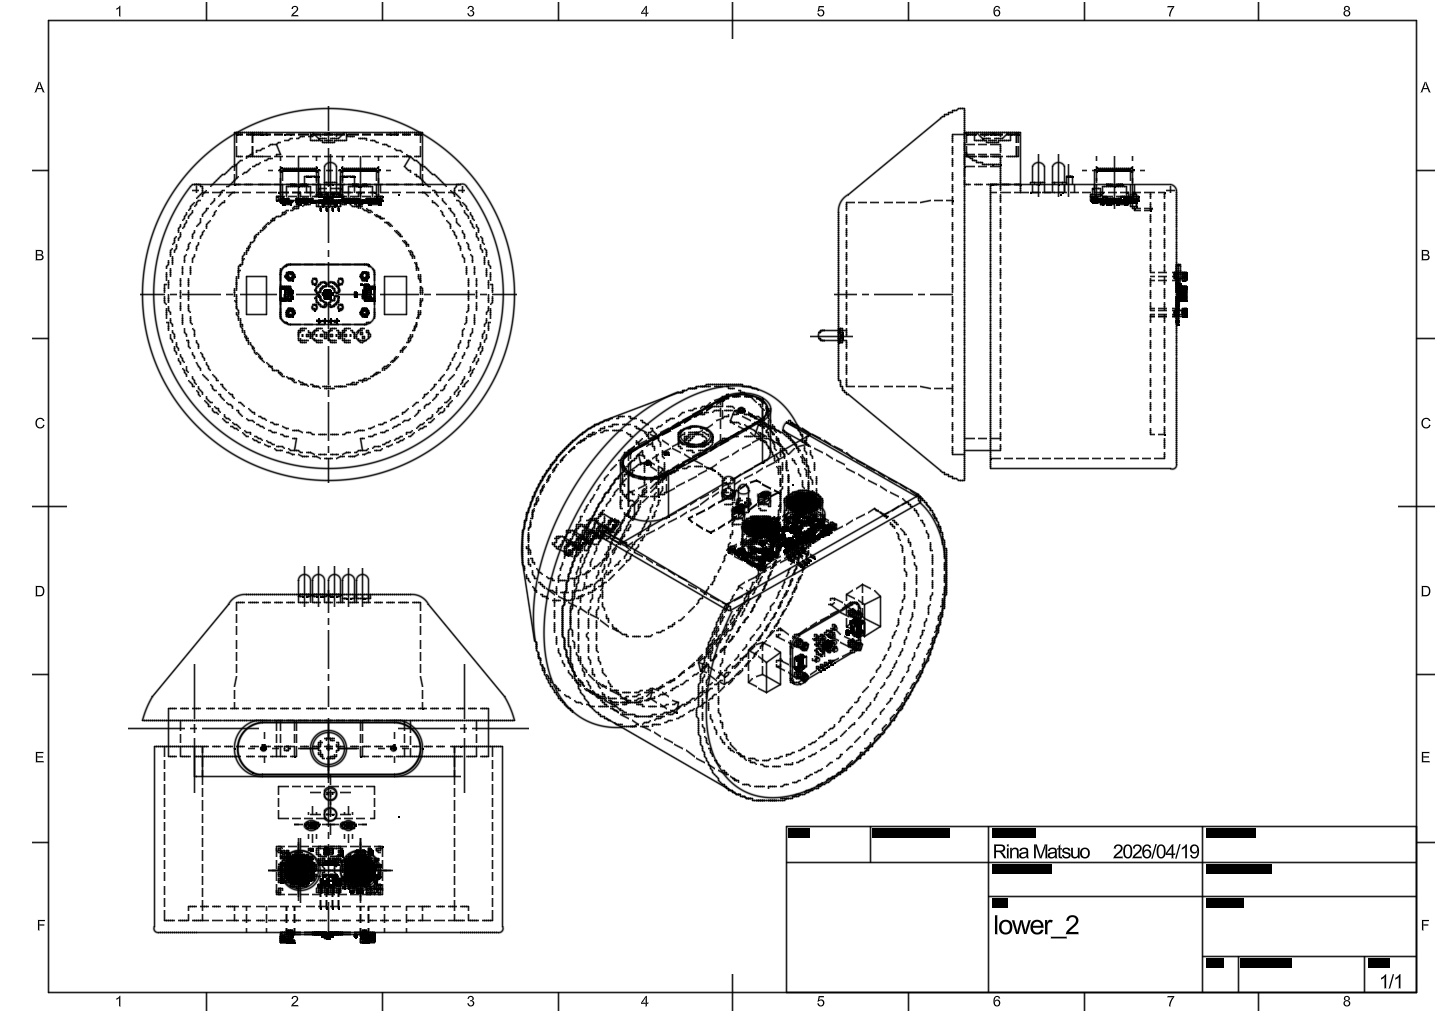
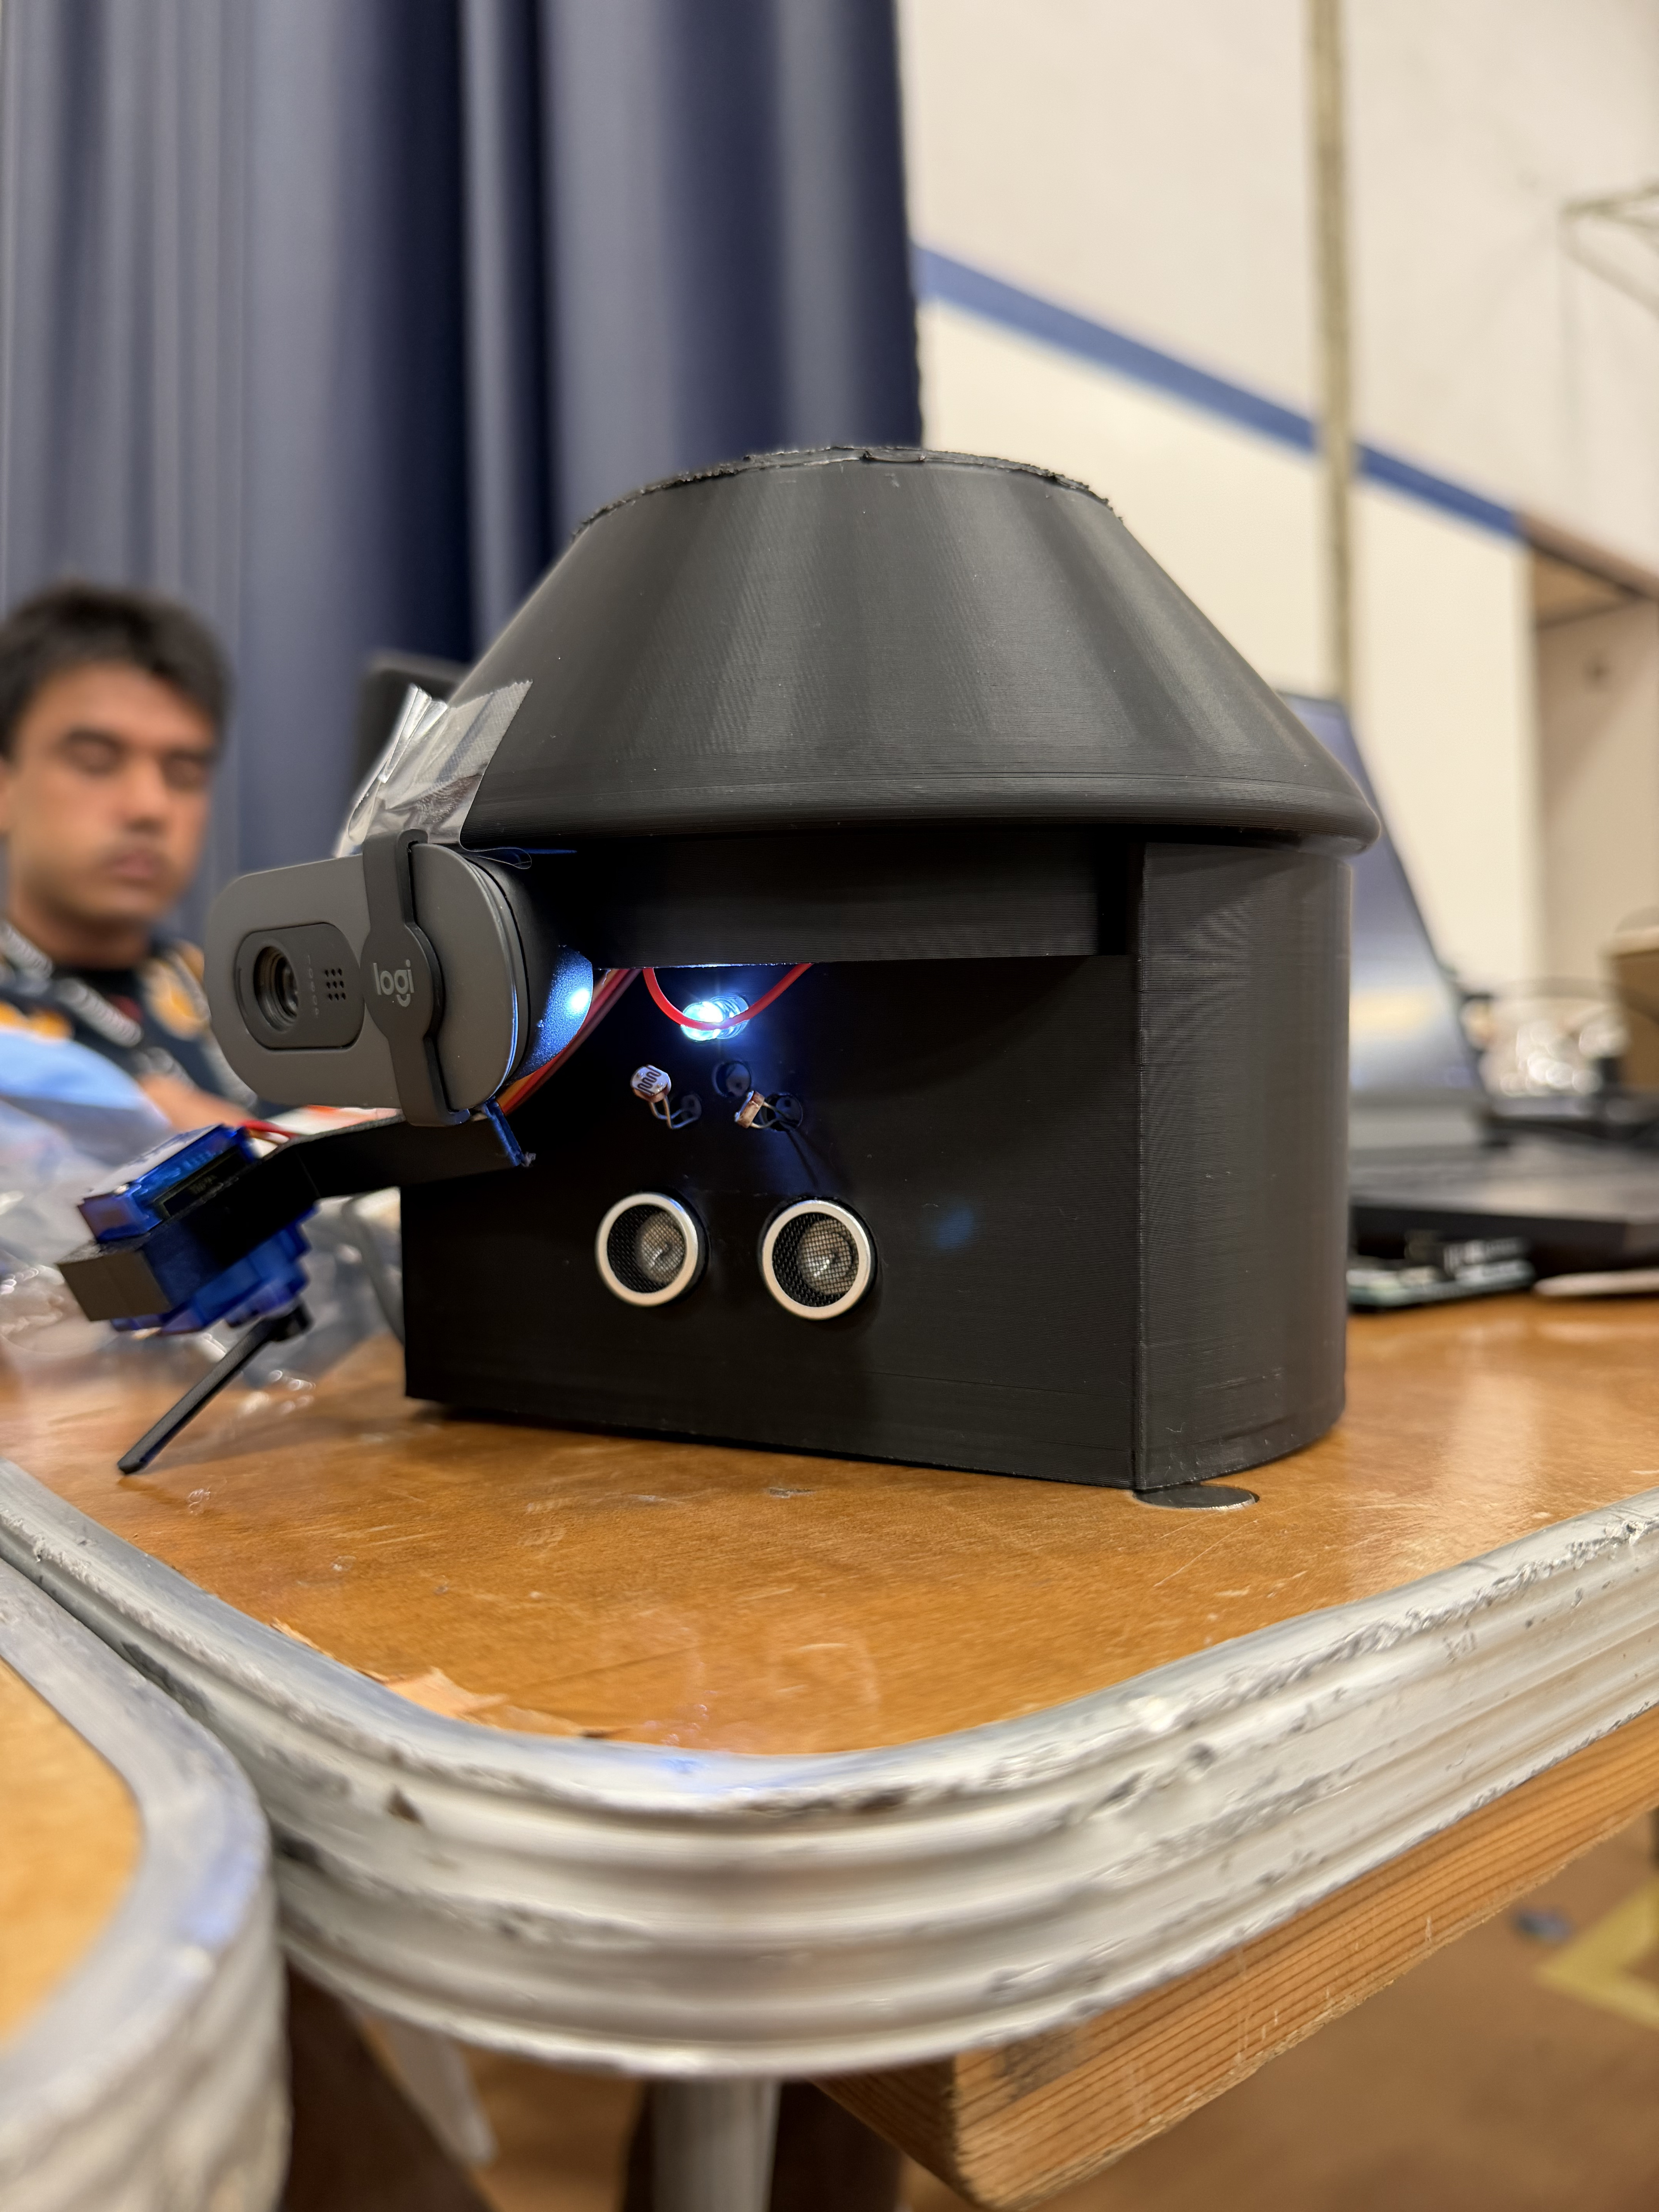
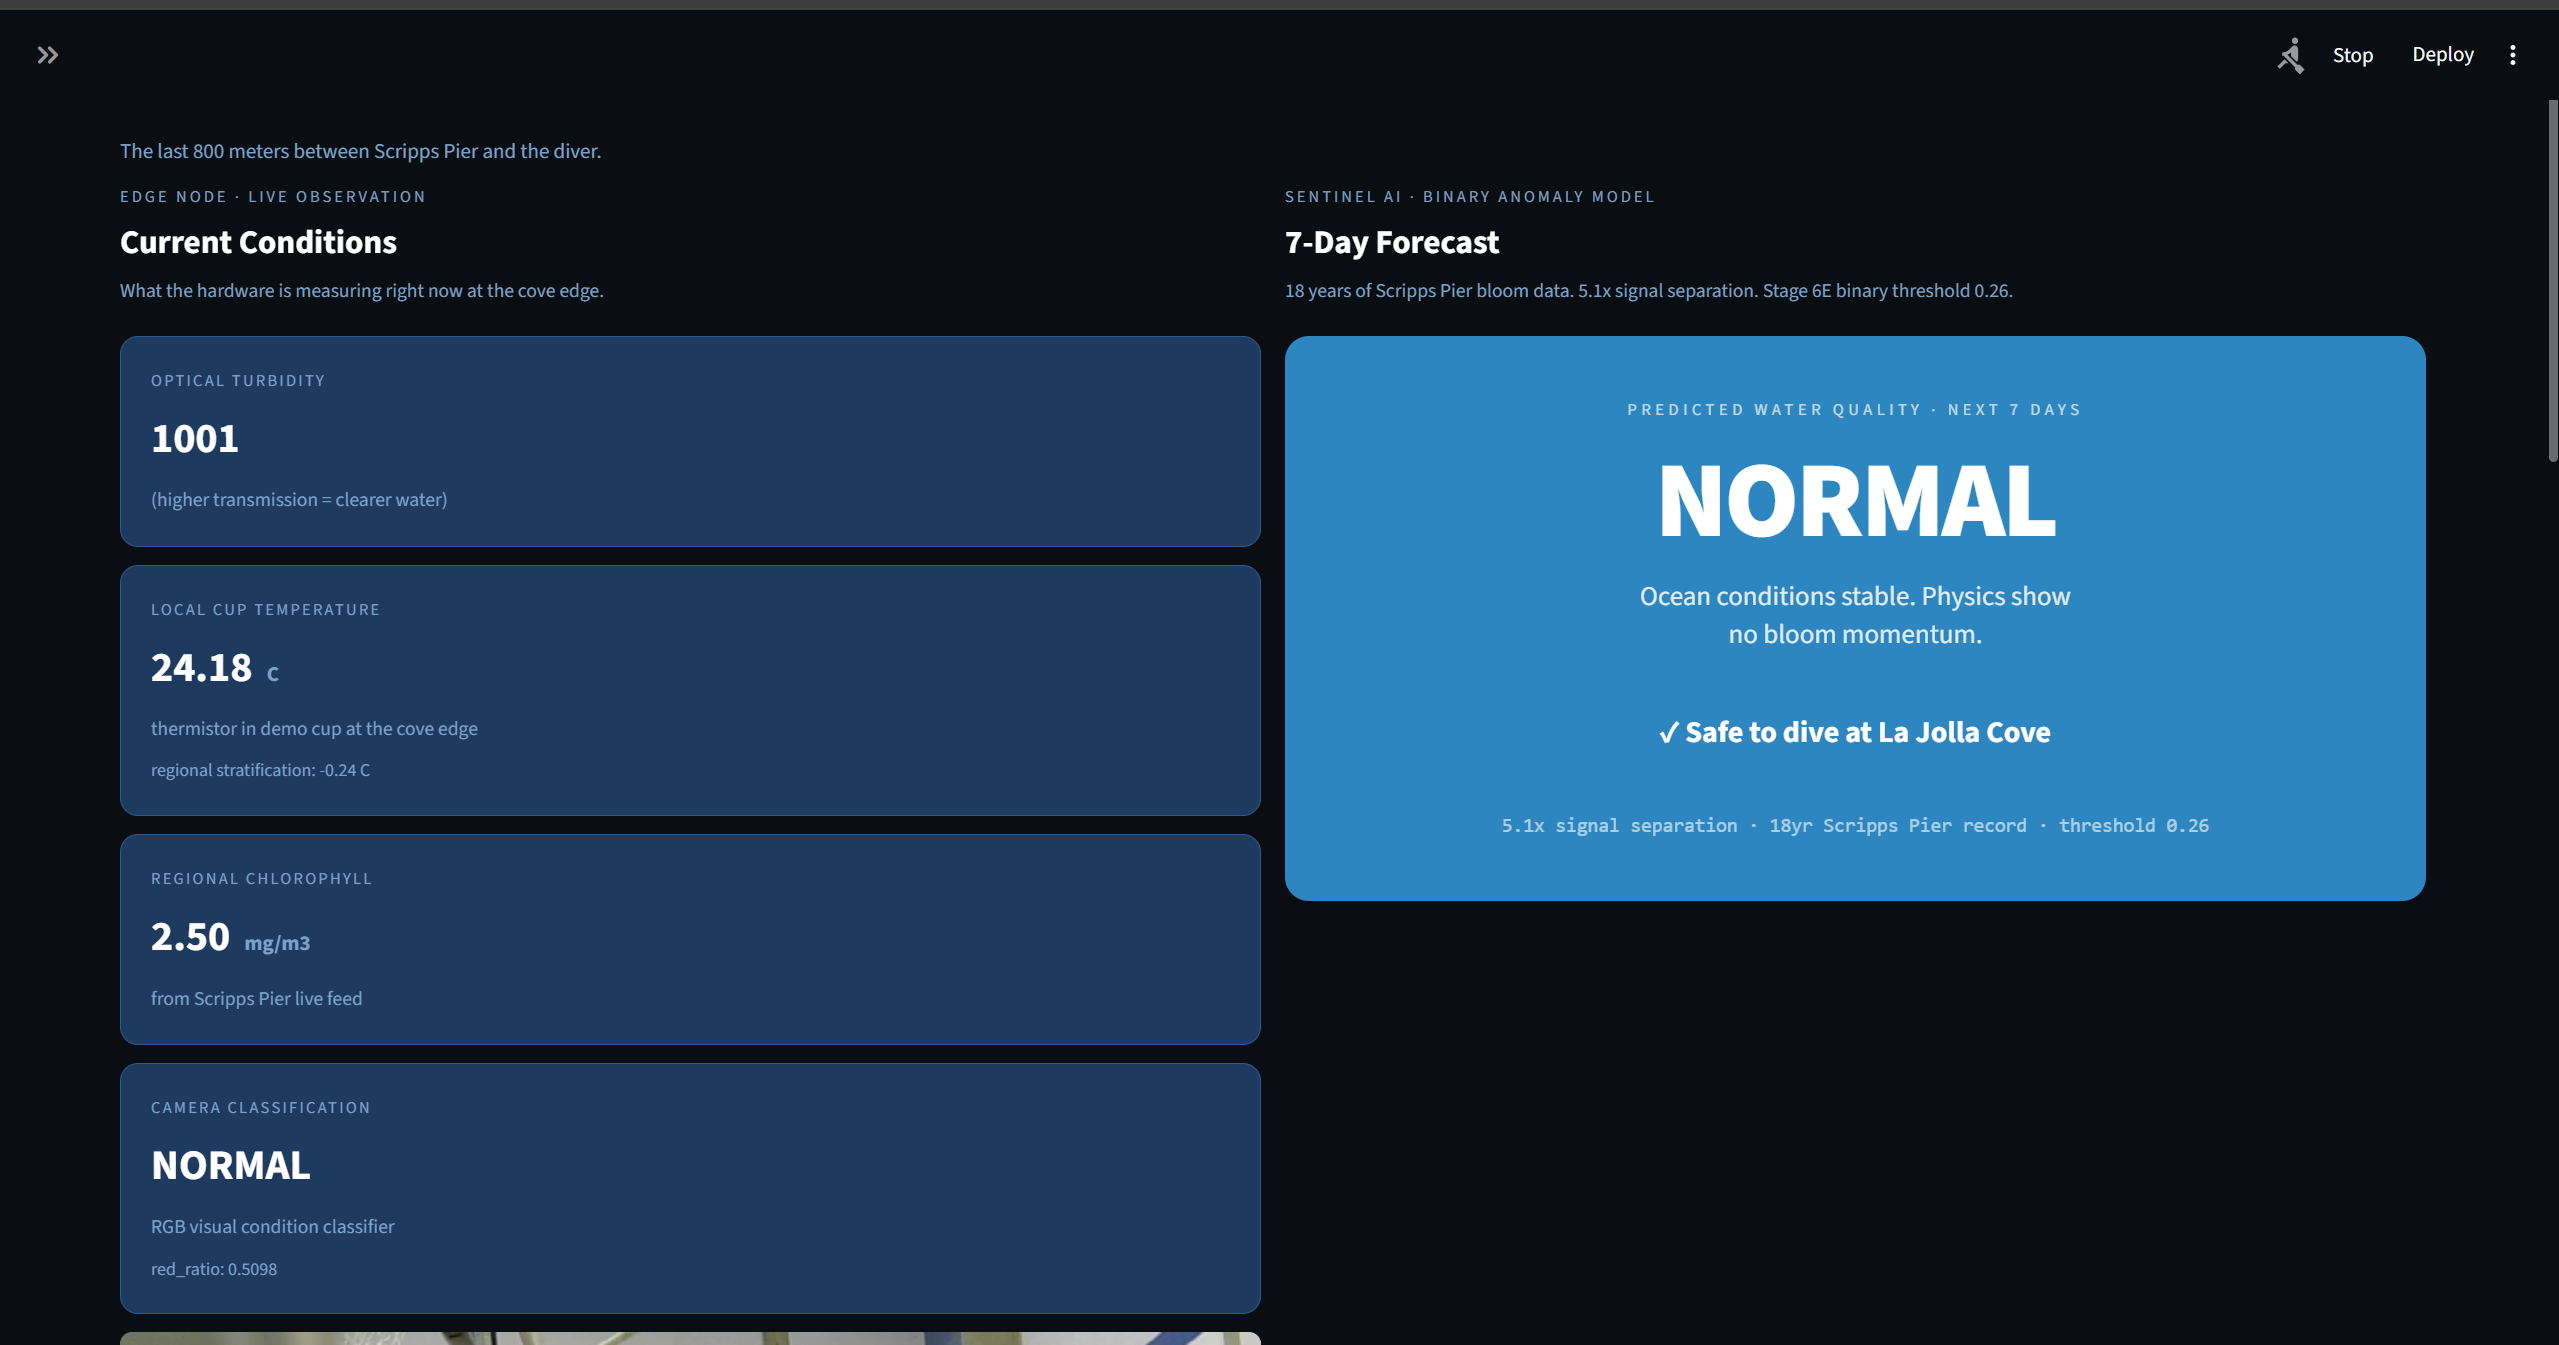
On the hardware side, we built an Arduino Uno Q edge node with a blue LED and photoresistor that measures light attenuation through a water sample using Beer-Lambert law, the same optical principle as the professional fluorometer on Scripps Pier. The sensor feeds live turbidity readings into the model's inference loop so that local conditions at the cove inform the prediction in real time. A Logitech camera performs RGB color analysis using the peridinin pigment signature unique to living L. polyedra cells to classify whether a detected anomaly is an active bloom or a decaying hypoxic event. The Arduino drives a Modulino Pixels LED strip and buzzer that display the current risk state physically.
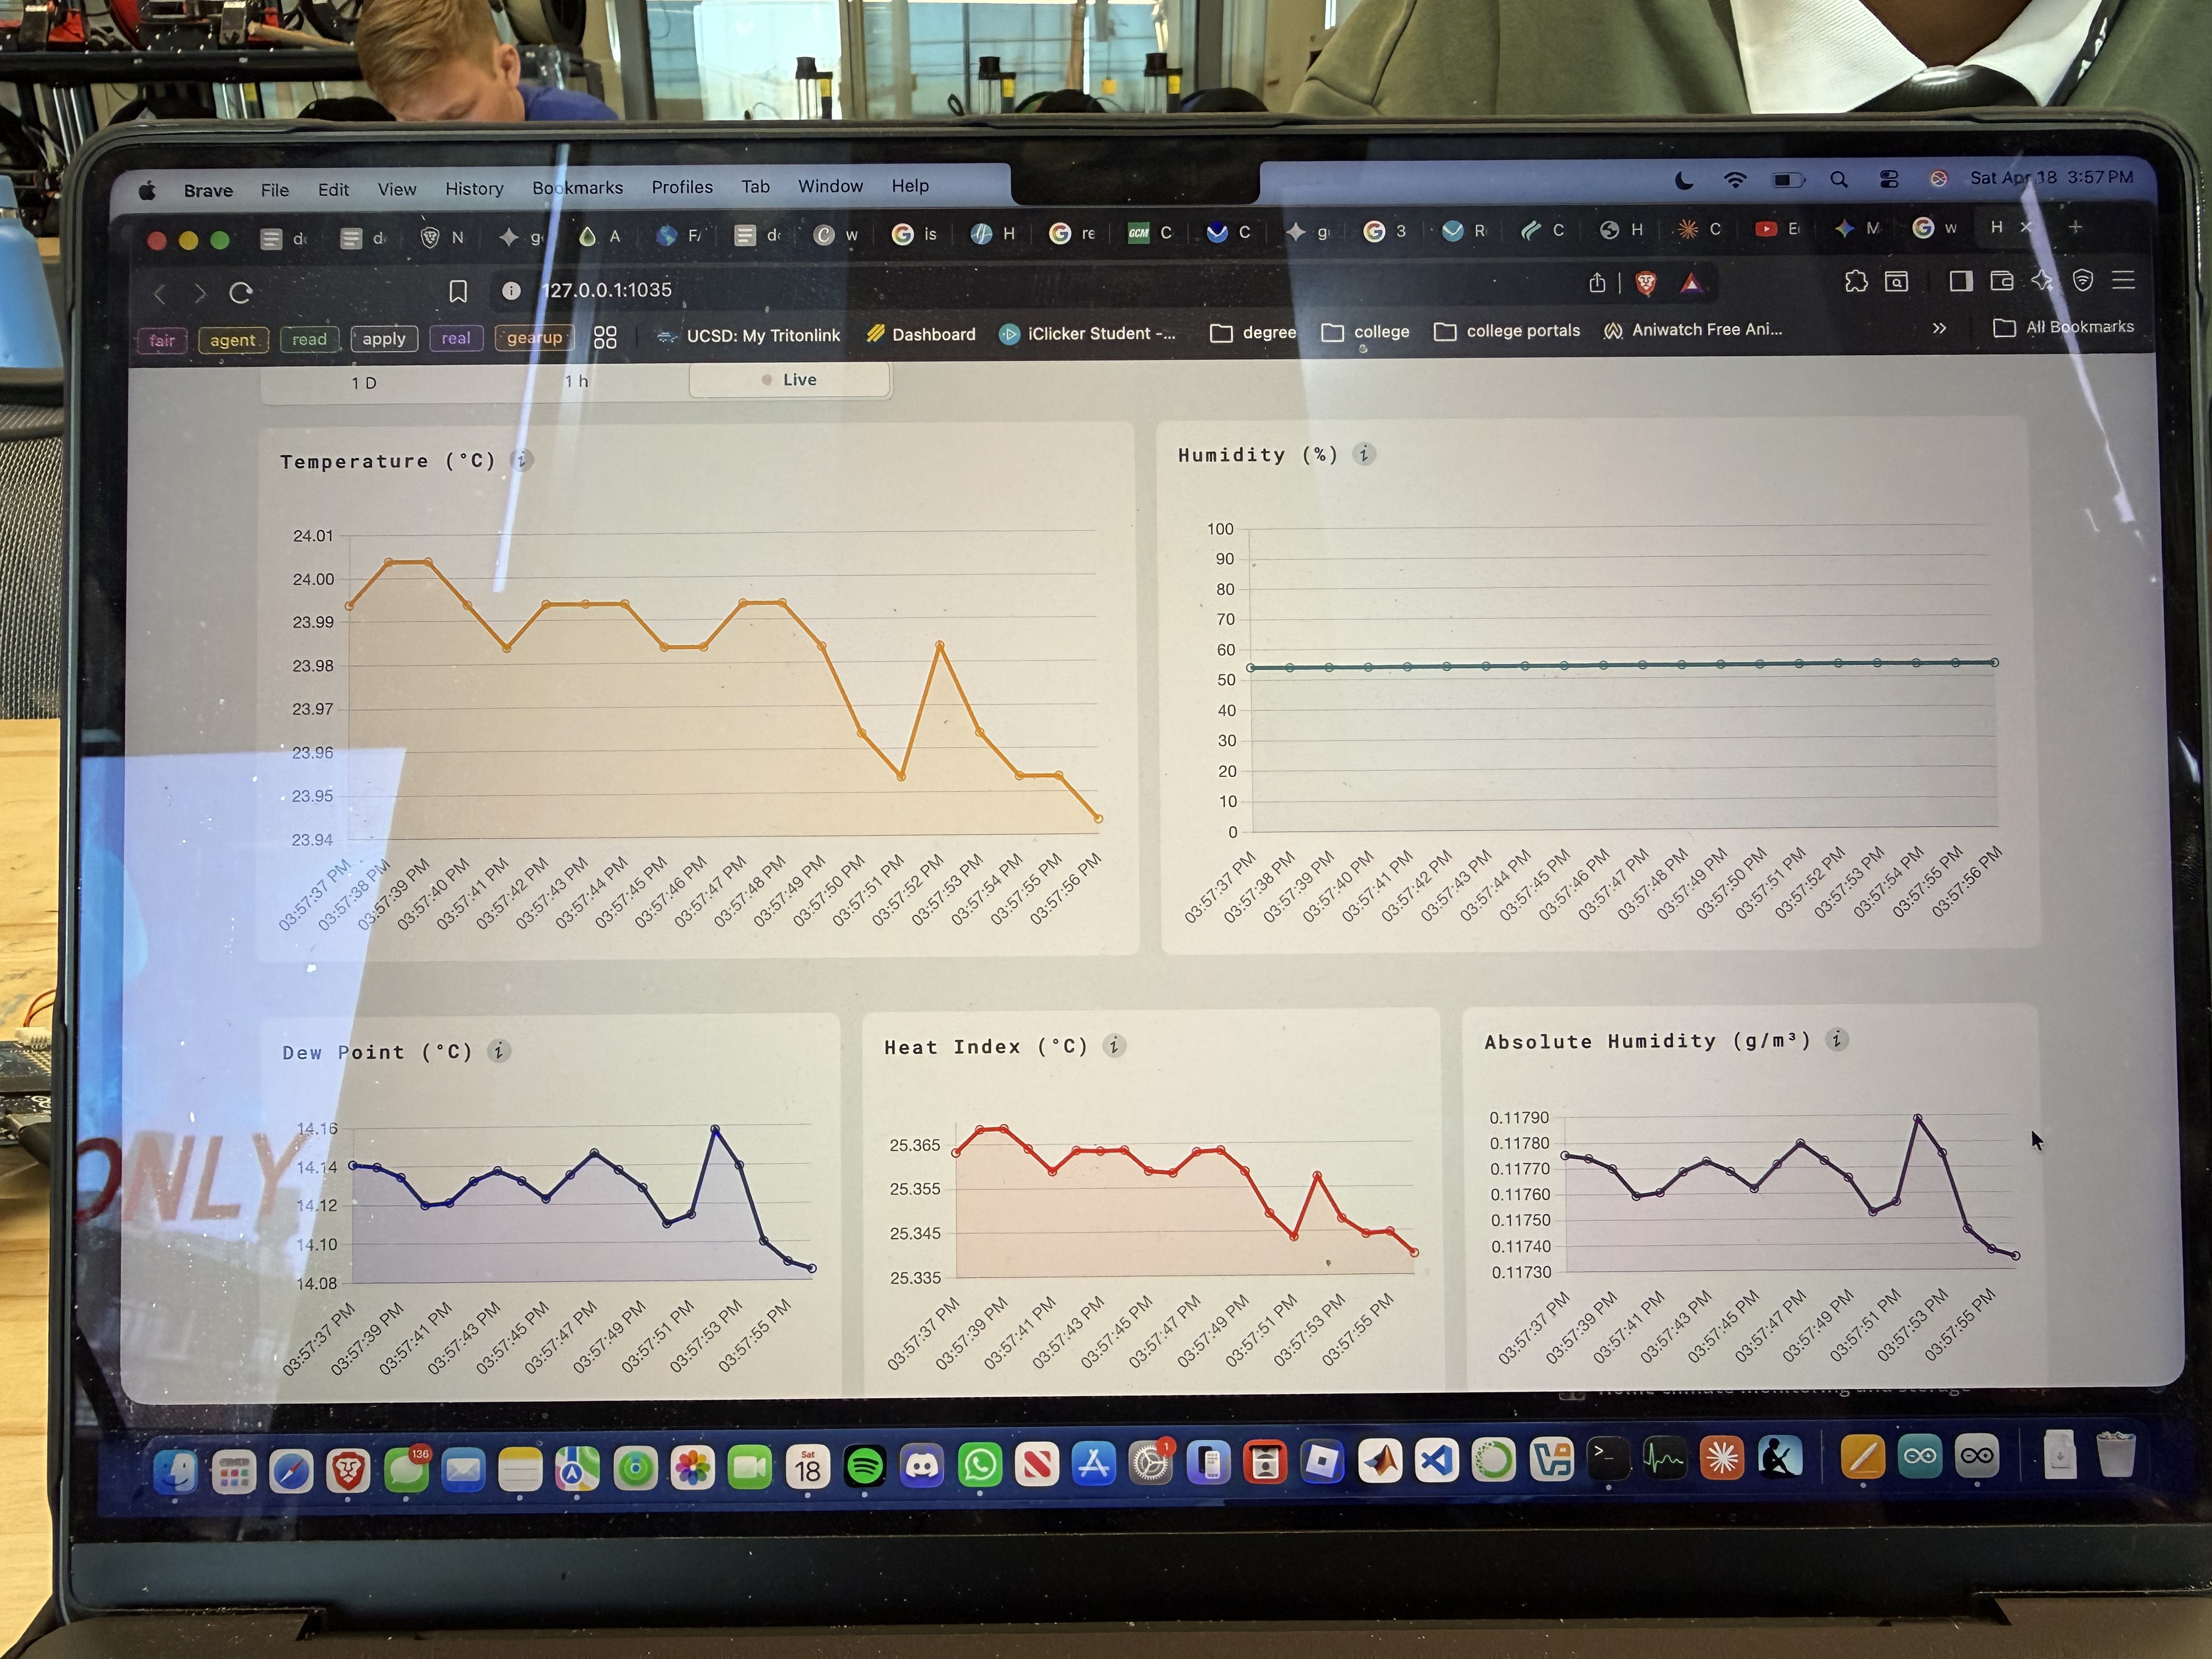
Everything is tied together in a Streamlit dashboard showing the live Scripps Pier feed, the current AI forecast, and a historical validation replay of the 2020 event with actual model probabilities.
Challenges we ran into
The biggest challenge was class imbalance. Only 27 of 927 weeks in the dataset were true bloom events. A naive model predicts normal every time and claims 97 percent accuracy while being completely useless. Getting the model to actually learn the rare event required careful feature engineering, class weighting, F2-score optimization, and a custom probability threshold derived from validation analysis rather than the default 0.5.
Calibrating the optical sensor under indoor lighting was harder than expected. The camera's red ratio reads differently under fluorescent light than sunlight, so we calibrated the bloom versus decay threshold empirically against the actual demo environment rather than relying on published values.
The live inference pipeline also required careful design. The model was trained on weekly engineered features but needs to produce real-time output from a live ERDDAP feed. We built a rolling feature computation layer that approximates the training feature space from recent data without leaking future information into the prediction.
Accomplishments that we're proud of
The 5.1x signal separation is the result we are most proud of. It means the model is genuinely learning the physics of a building bloom, not memorizing noise. The June 2024 early detection, two weeks before cell counts crossed the bloom threshold, is the closest thing we have to operational proof that the system works.
We are also proud of the scientific honesty. We documented every limitation explicitly: 32 percent recall, same-week detection for most events, and the predictability ceiling imposed by subsurface nitrate flux events that no surface sensor can see. Those limitations are visible on the dashboard. We did not hide them.
What we learned
Rare event detection is a fundamentally different problem from standard classification. Accuracy is a useless metric when 97 percent of your data belongs to one class. The right question is not how often the model is correct, but whether the signal gets louder when it matters. Separation ratio and recall at a calibrated threshold answer that question. Accuracy does not.
We also learned that feature engineering matters more than model architecture for small tabular datasets. The transition from raw chlorophyll to momentum-based derivatives, specifically growth rate, acceleration, and EWMA signals, was what pushed the model from uninformative to useful. No amount of hyperparameter tuning on raw features would have produced the same result.
What's next for Red Tide Sentinel
The immediate next step is sub-weekly sensing. The current model is constrained by the weekly HABMAP sampling cadence. If the optical sensor feeds daily or hourly readings into the model, the detection lead time improves significantly.
Every camera image captured during a confirmed bloom event is a labeled training sample. Each deployment makes the visual classifier more accurate without requiring manual annotation. That is the flywheel that improves the system over time.
The architecture is designed to scale. A $30 node, a camera, and a WiFi connection. For the annual maintenance cost of one traditional oceanographic mooring, you could deploy 2,500 Sentinel nodes along the San Diego coastline. The goal is a dense network of cheap, intelligent sensors that extends the reach of institutional science into the places it currently cannot afford to monitor.

Log in or sign up for Devpost to join the conversation.