-
-
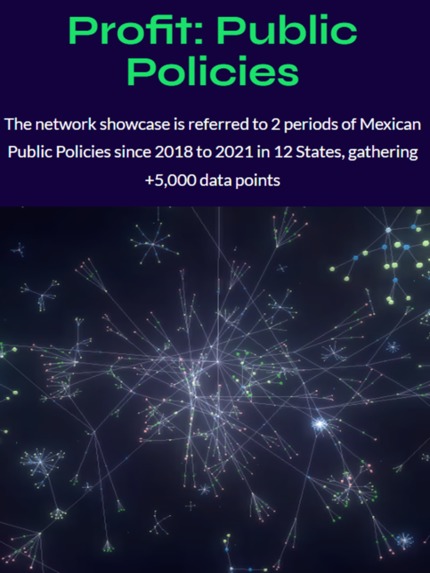
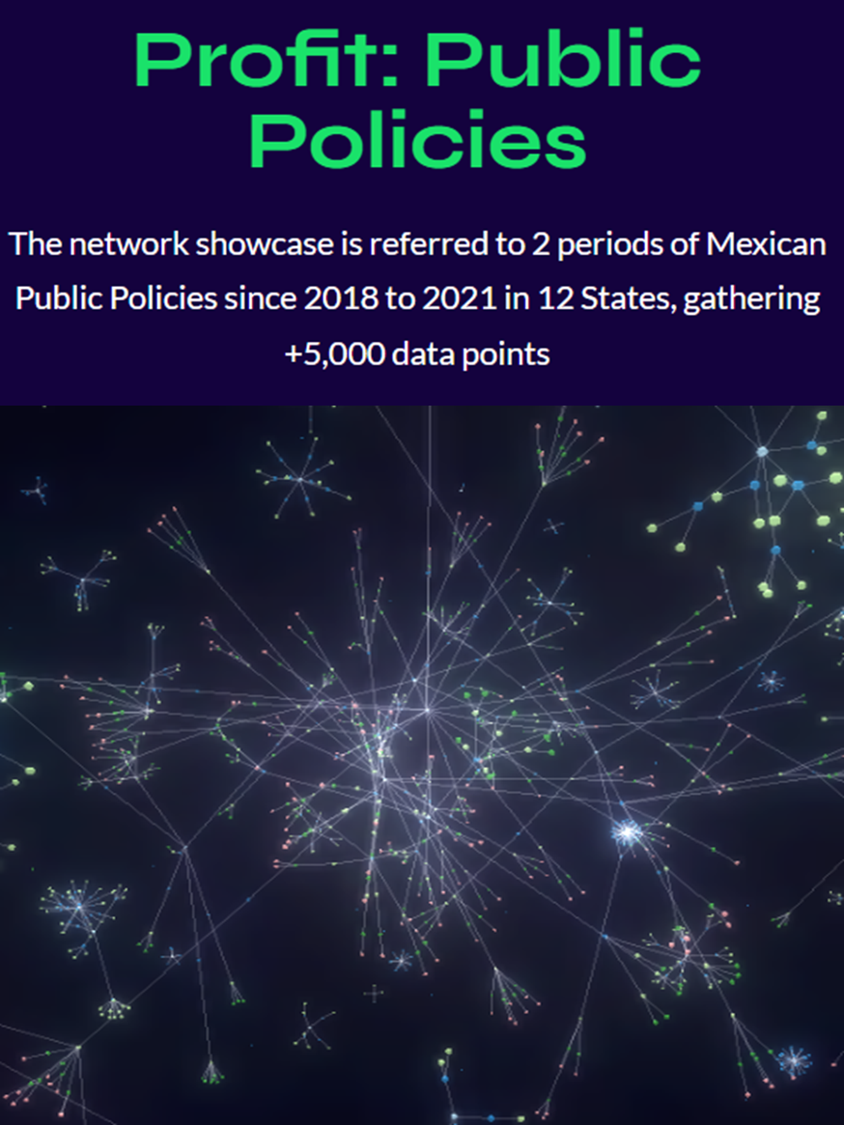
Profit: Public Policies Network
Inspiration
Talking, thinking or doing complexity sciences is my inspiration. I believe that if we saw the amazing emergence of life, we could derive it to our society.
For this Hackathon we built two dataset. One on Public Policiesand the other on Biodiversity. We extensively use AWS SageMaker Studio Lab to clean, and engineering the features presented. Then we use some cool JavaScript visualization to month them for public showcase on our startup page neuolitiks.io
The inspiration for building comes from my PhD thesis I came up with a abstract model that creates networks out of public policies.
Then I saw that this models can be glued together, giving life to combinations of different complex systems.
What it does
It is a 3D and 2D visual maps that relates public policies in México with the SDGs and Biodiversity Data.
This could be used for strategic planning, decision makers understanding, and really, really looks nice for "evangelize" around Digital Sustainability.
Visualization models can relate specific questions such as: What Public Policies address the issue of Biodiversity in Mexico and how they are related to SDG 15?
The usage of the*ASDI dataset* came from the GBIF dataset, which can be glued to the public policies networks to find more insight and relation among them. That's amazing!
How we built it
We did a lot of work by not just using public data sets, but also to build our owns. The story cannot be told without omitting various intermediate steps, but I will try to make it short and simple:
- We mine data from public policies from the states/cities master plans.
- Conversion of SDGs to a small network
- Creation of a Network Model for 13 Mexican Cities Public Policies
- Categorization of ASDI Data Sets to SDGs
- Mining of GBIF Data Set
- Creation of a Network of Biodiversity of Mexico Cites
- Join of SDGs, Public Policies and Biodiversity Networks
Several techniques (glamorous and non glamorous) where used across this main steps. Even some manual labor of cleaning data! 🤗
Challenges we ran into
As always, managing different data sets is a pain in the neck. But always remember to keep it real (and stupidly) simple. There were so many "up-grades" that didn't pass the planning. For example, we wanted to build a continuos biodiversity pipeline, but at the end, a classical static picture is what we need to make links between networks. For the most part, the model of public policies is something that is not standardized (not as the SDGs with is super standardized!). There were levels of public policies that have indicator measurements on each hierarchical level. There should be a review of the SDGs indicators. In the PhD thesis, I noticed that some of them are not even related to the goals. Also there is not a viable explanation on what is the impact. This is something that is always on my mind: Lot's of solutions are not accoutable.
This Hackathon made us build an operational model to use with biodiversity data set. But other ASDI dataset can be used ("glued") to public policies networks. Let's do it for the next hack!
Accomplishments that we're proud
In the end, we can relate that indicator difference between building KRIs for sustainability vs KPIs. As stated in most of the (good) references on metrics: KPIs relate to strategy. In order to perform so, we need to have a good, a really good strategy. Here is when networks enter and "dazzle", networks maps make easy to understand if a metric is going the way we want it to go. And also, something really spectacular! we can do forecasting not by numbers, but by seen the path of a decision.
Even if this hack took a lot to be planned, we executed it in just a weekend! (Applause). It may appear so professionally built, but that's the power of experience craft, extensive planning and funky lovely hacking spirit!
What we learned
Event thought data is essential to understand sustainability, its transformation to information and measurement is of ulterior importance. Having goals without data to support improvement is fooling around. Having data without a guide to what objective should be accomplish, is as well a sad endeavour.
Data is power, information is king, but visualization and interpretation are the way to unite power with royalty.
What's next for Recommendation Systems for Sustainable Public Policies
We will continue building our mining from public policies around the world. Definitely there should be a second project to mine those policies in a more ordered way. Sustainable metrics around KPIs and KRIs is also a desire for an upcoming model that broaden the indicators of any Sustainable Objective.

Log in or sign up for Devpost to join the conversation.