ReCircle — Rebuilding Goodwill DC's Donation Pipeline for a Circular Economy
🌱 Inspiration
Washington DC is home to one of Goodwill's most active donation networks, yet a significant portion of donated goods arrive in unusable condition, surge unpredictably around local events, and pile up unevenly across store locations. Walking past a Goodwill drop-off point and seeing bins overflowing with items that would never reach a shelf made us ask a simple question: what if the system could make smarter decisions before the item ever arrived?
The hackathon theme — Reboot the Earth — pushed us to think beyond operational efficiency. We wanted a solution where doing good for the environment was also the path of least resistance for the donor. That tension became the backbone of ReCircle.
🔨 How We Built It
ReCircle is an end-to-end donation intelligence pipeline with four interconnected layers:
1. Smart Intake (Computer Vision + Decision Model)
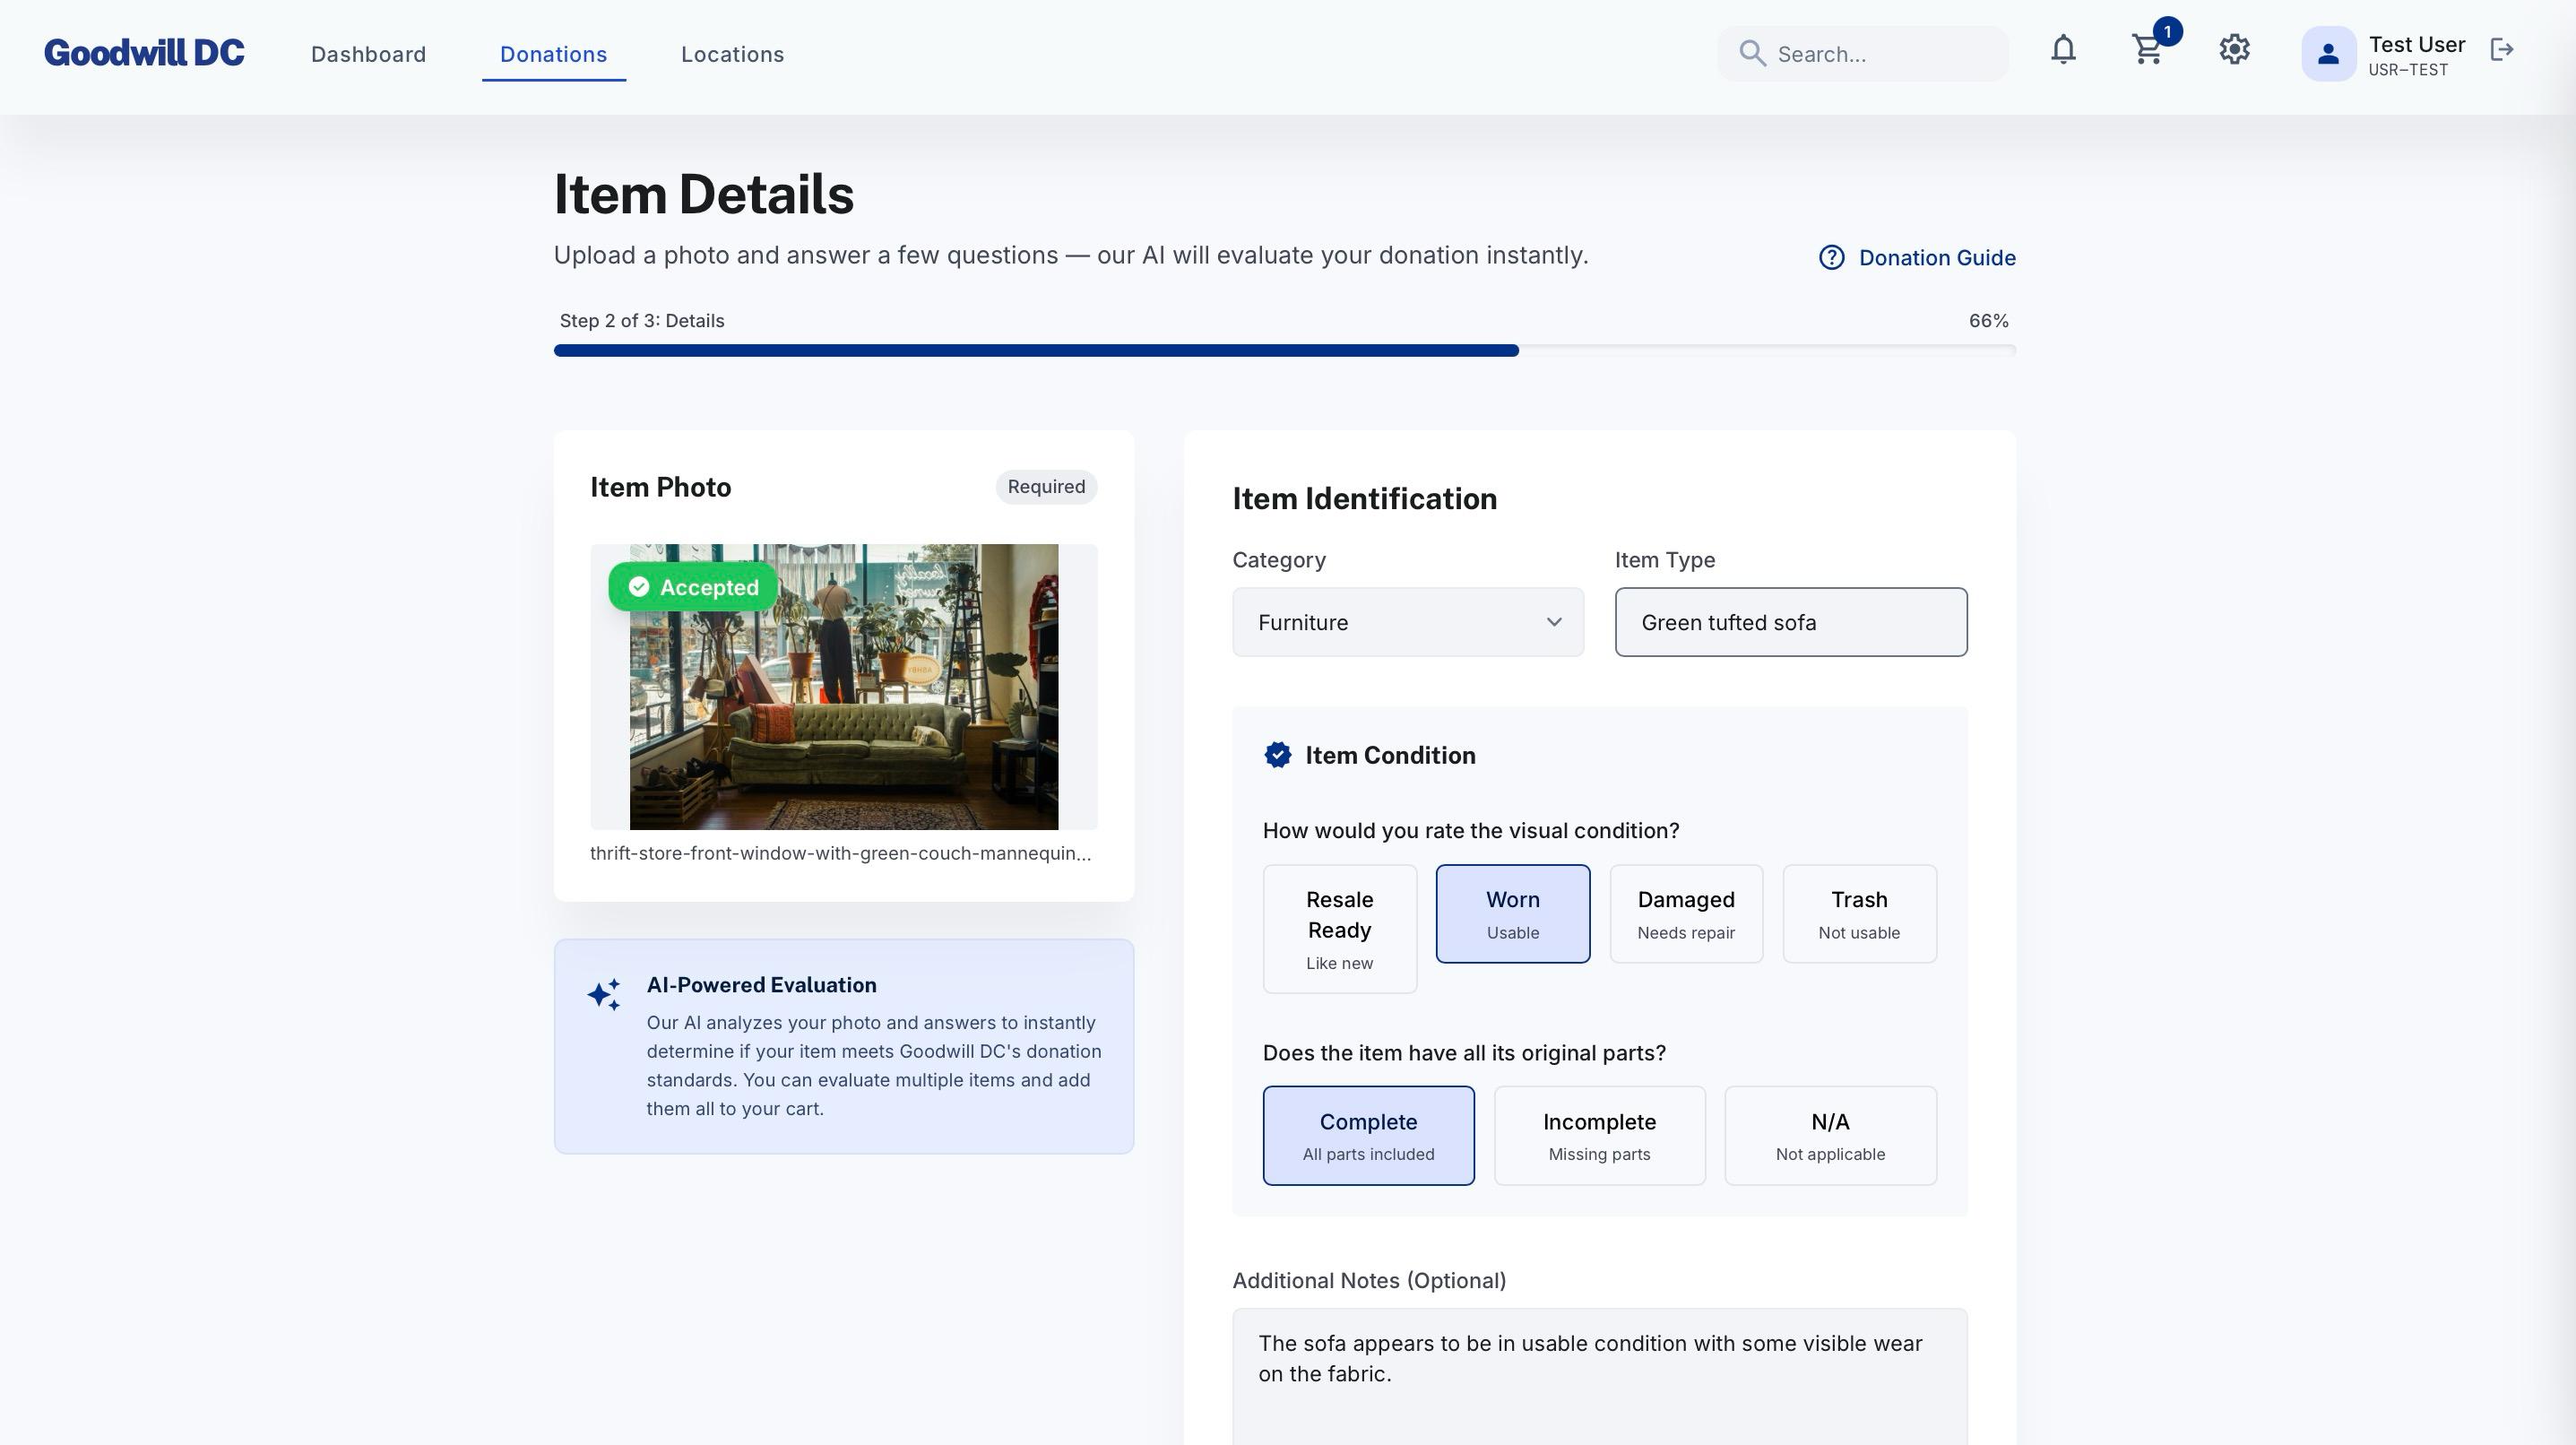
Donors open the ReCircle app, upload photos of their item, and answer a short set of questions. A computer vision model automatically fills in item details — category, estimated condition, and visible wear-and-tear — from the uploaded images. A downstream classification model then decides whether the item meets Goodwill DC's acceptance threshold before the donor makes a trip.
2. Verified Tagging System
Once an accepted item arrives at a store, an employee verifies it against the pre-submitted record. On confirmation, the item receives a digital tag with structured metadata — category, condition, origin store, and routing priority. This structured tagging dramatically reduces the time spent on manual re-categorization and makes downstream transfer decisions faster and more accurate.
3. Demand Forecasting Model
A forecasting model was trained on historical donation patterns combined with local calendar signals. The model produces monthly incoming-volume predictions per store and category. The core formulation is:
$$\hat{D}_{s,t} = f\bigl(\text{month}_t,\ \text{location}_s,\ \text{event}_t,\ \text{lag features}\bigr)$$
where $$\hat{D}_{s,t}$$ is the predicted donation volume for store $$s$$ at time $$t$$. Key signals include post-holiday donation surges, post-Christmas category spikes, and the university move-out window around May 20 — a uniquely DC pattern given the density of colleges in the area.
4. Network Rebalancing Algorithm
A supply-demand rebalancing algorithm treats all Goodwill DC locations as a single shared inventory pool. If Store A receives 500 shirts per day but sells only 100, while Store B receives 100 but has demand for 500, the system flags a surplus-deficit mismatch and generates a transfer recommendation. The priority score for each transfer is computed as:
$$\text{Priority}{A \to B} = \frac{\text{Surplus}_A \times \text{Demand Deficit}_B}{\text{Transfer Cost}{A,B}}$$
Higher scores surface the most impactful inter-store moves first.
🎁 Donor Incentive System
A key design question was: why would a donor go through the extra steps? The answer is a three-part credit model, awarded once a verified item is received at the store:
| Incentive | How It Works |
|---|---|
| 🌱 Tree planting | Credits can be contributed to verified tree-planting initiatives, directly tying each donation to the Reboot the Earth mission |
| 🧾 Tax deduction receipt | Donors receive a verified digital receipt per accepted item, enabling them to claim charitable donation tax benefits |
| 🛍️ Thrift shopping coupons | Credits convert into discount coupons redeemable at any Goodwill DC store, closing the circular loop |
🎓 What We Learned
- Donor behavior is a design problem. Asking donors to do more work only works if the reward feels real. Connecting credits to tree-planting made the sustainability angle tangible rather than decorative.
- Data quality compounds. A cleaner intake record makes every downstream step — tagging, routing, forecasting — more reliable. Garbage in, garbage out applies to physical supply chains just as much as ML pipelines.
- Forecasting is only useful if it is actionable. A prediction without a staffing or routing recommendation attached to it is just a number. The lesson was to think in terms of decisions, not metrics.
- Computer vision on real-world consumer photos is messy. Lighting, angles, and photo quality vary enormously. Building robustness into the intake model required more data augmentation than initially expected.
🚧 Challenges We Faced
- Bridging the donor motivation gap. The biggest challenge was not technical — it was behavioral. Why would a donor spend 3 extra minutes submitting photos? The incentive structure was iterated on multiple times before landing on the three-credit model: tree planting, tax receipts, and thrift coupons.
- Data availability. Goodwill does not publish granular donation volume data by store or category, so synthetic datasets were constructed using public reports and seasonal proxies. Real deployment would require a formal data-sharing agreement.
- Defining "acceptable." The accept/reject threshold for donated items is not a clean binary — it depends on category, current inventory levels, and store capacity. This was modeled as a soft score rather than a hard rule, with configurable thresholds per store manager.
- Scope management. The full pipeline — intake, tagging, forecasting, rebalancing, and incentive engine — is genuinely end-to-end, which made it tempting to keep adding features. Staying focused on a coherent demo within hackathon hours required constant prioritization.
Built for the Goodwill Industries Track — Problem Statement 4: Rethinking Donation Systems for a Circular Economy.

Log in or sign up for Devpost to join the conversation.