-
-
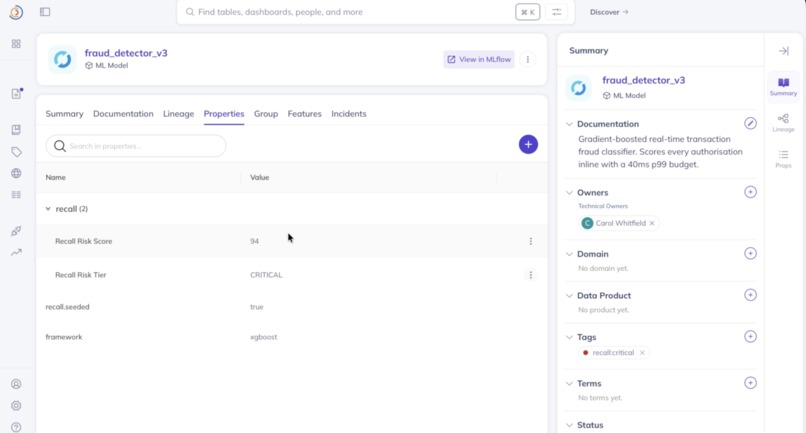
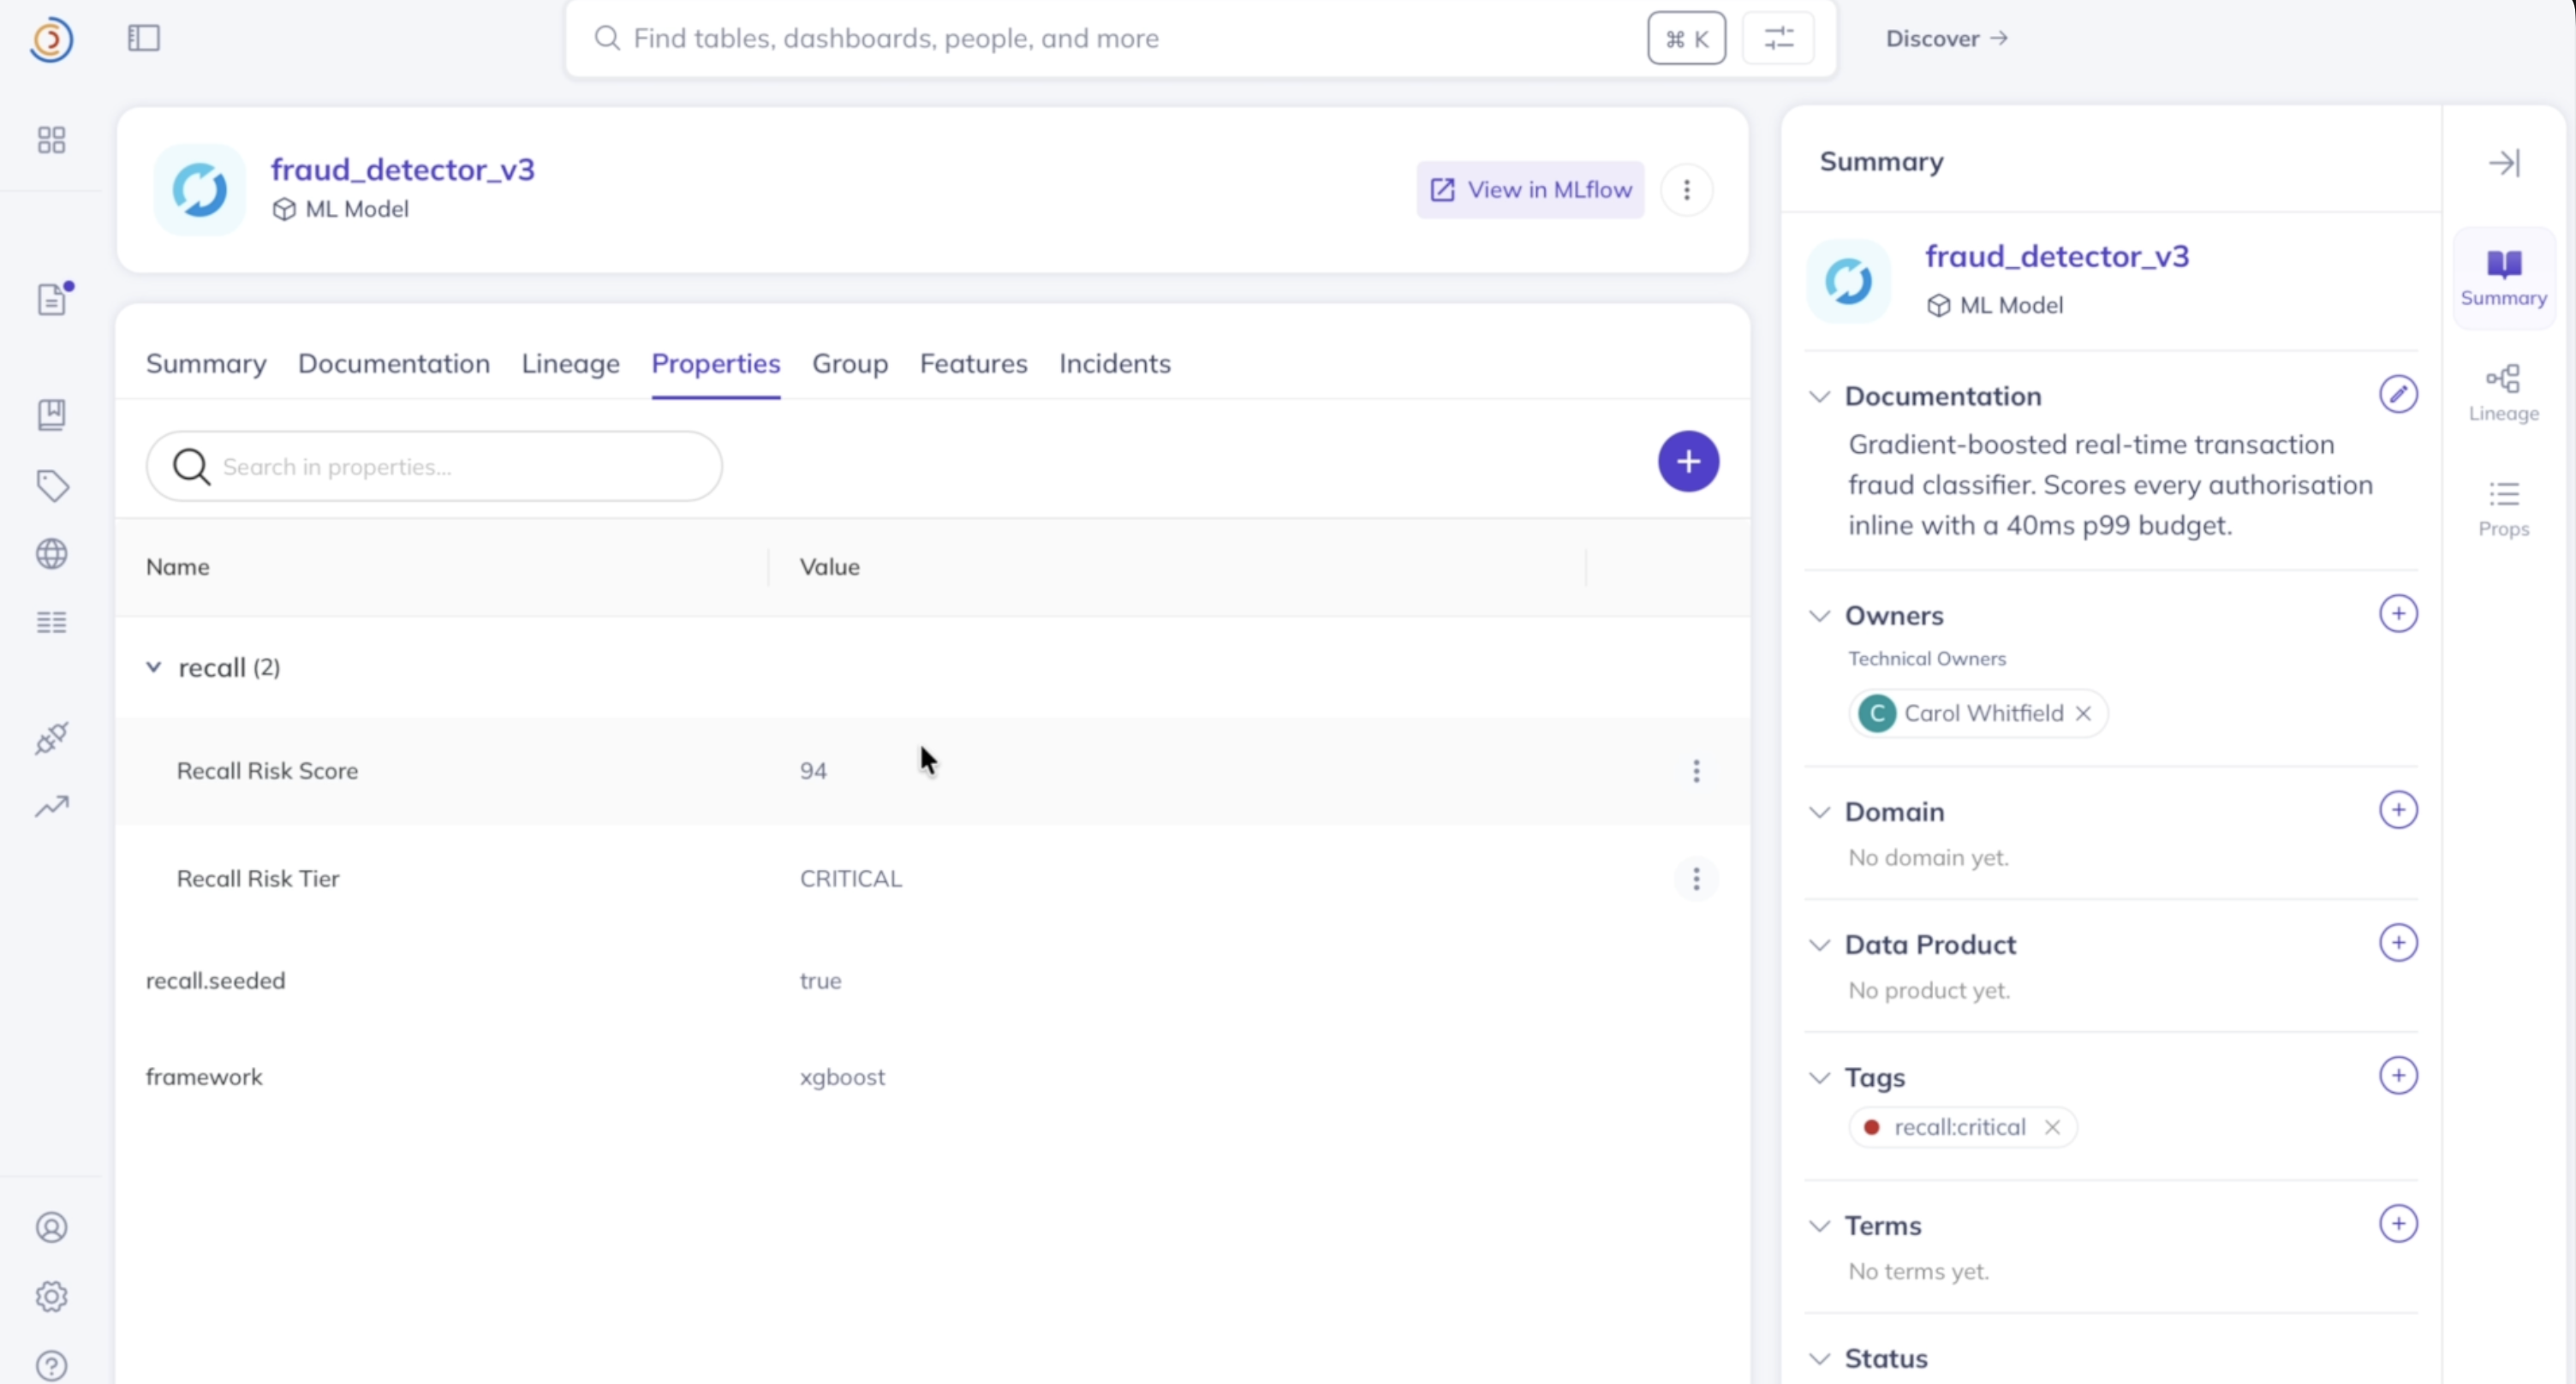
Recall Score Properties
-
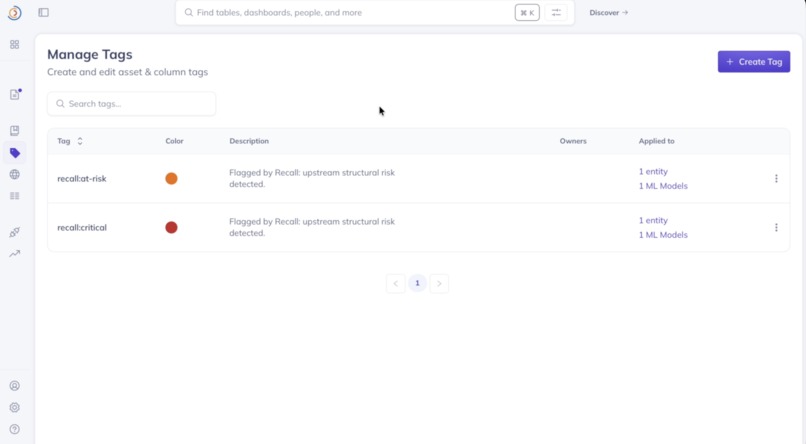
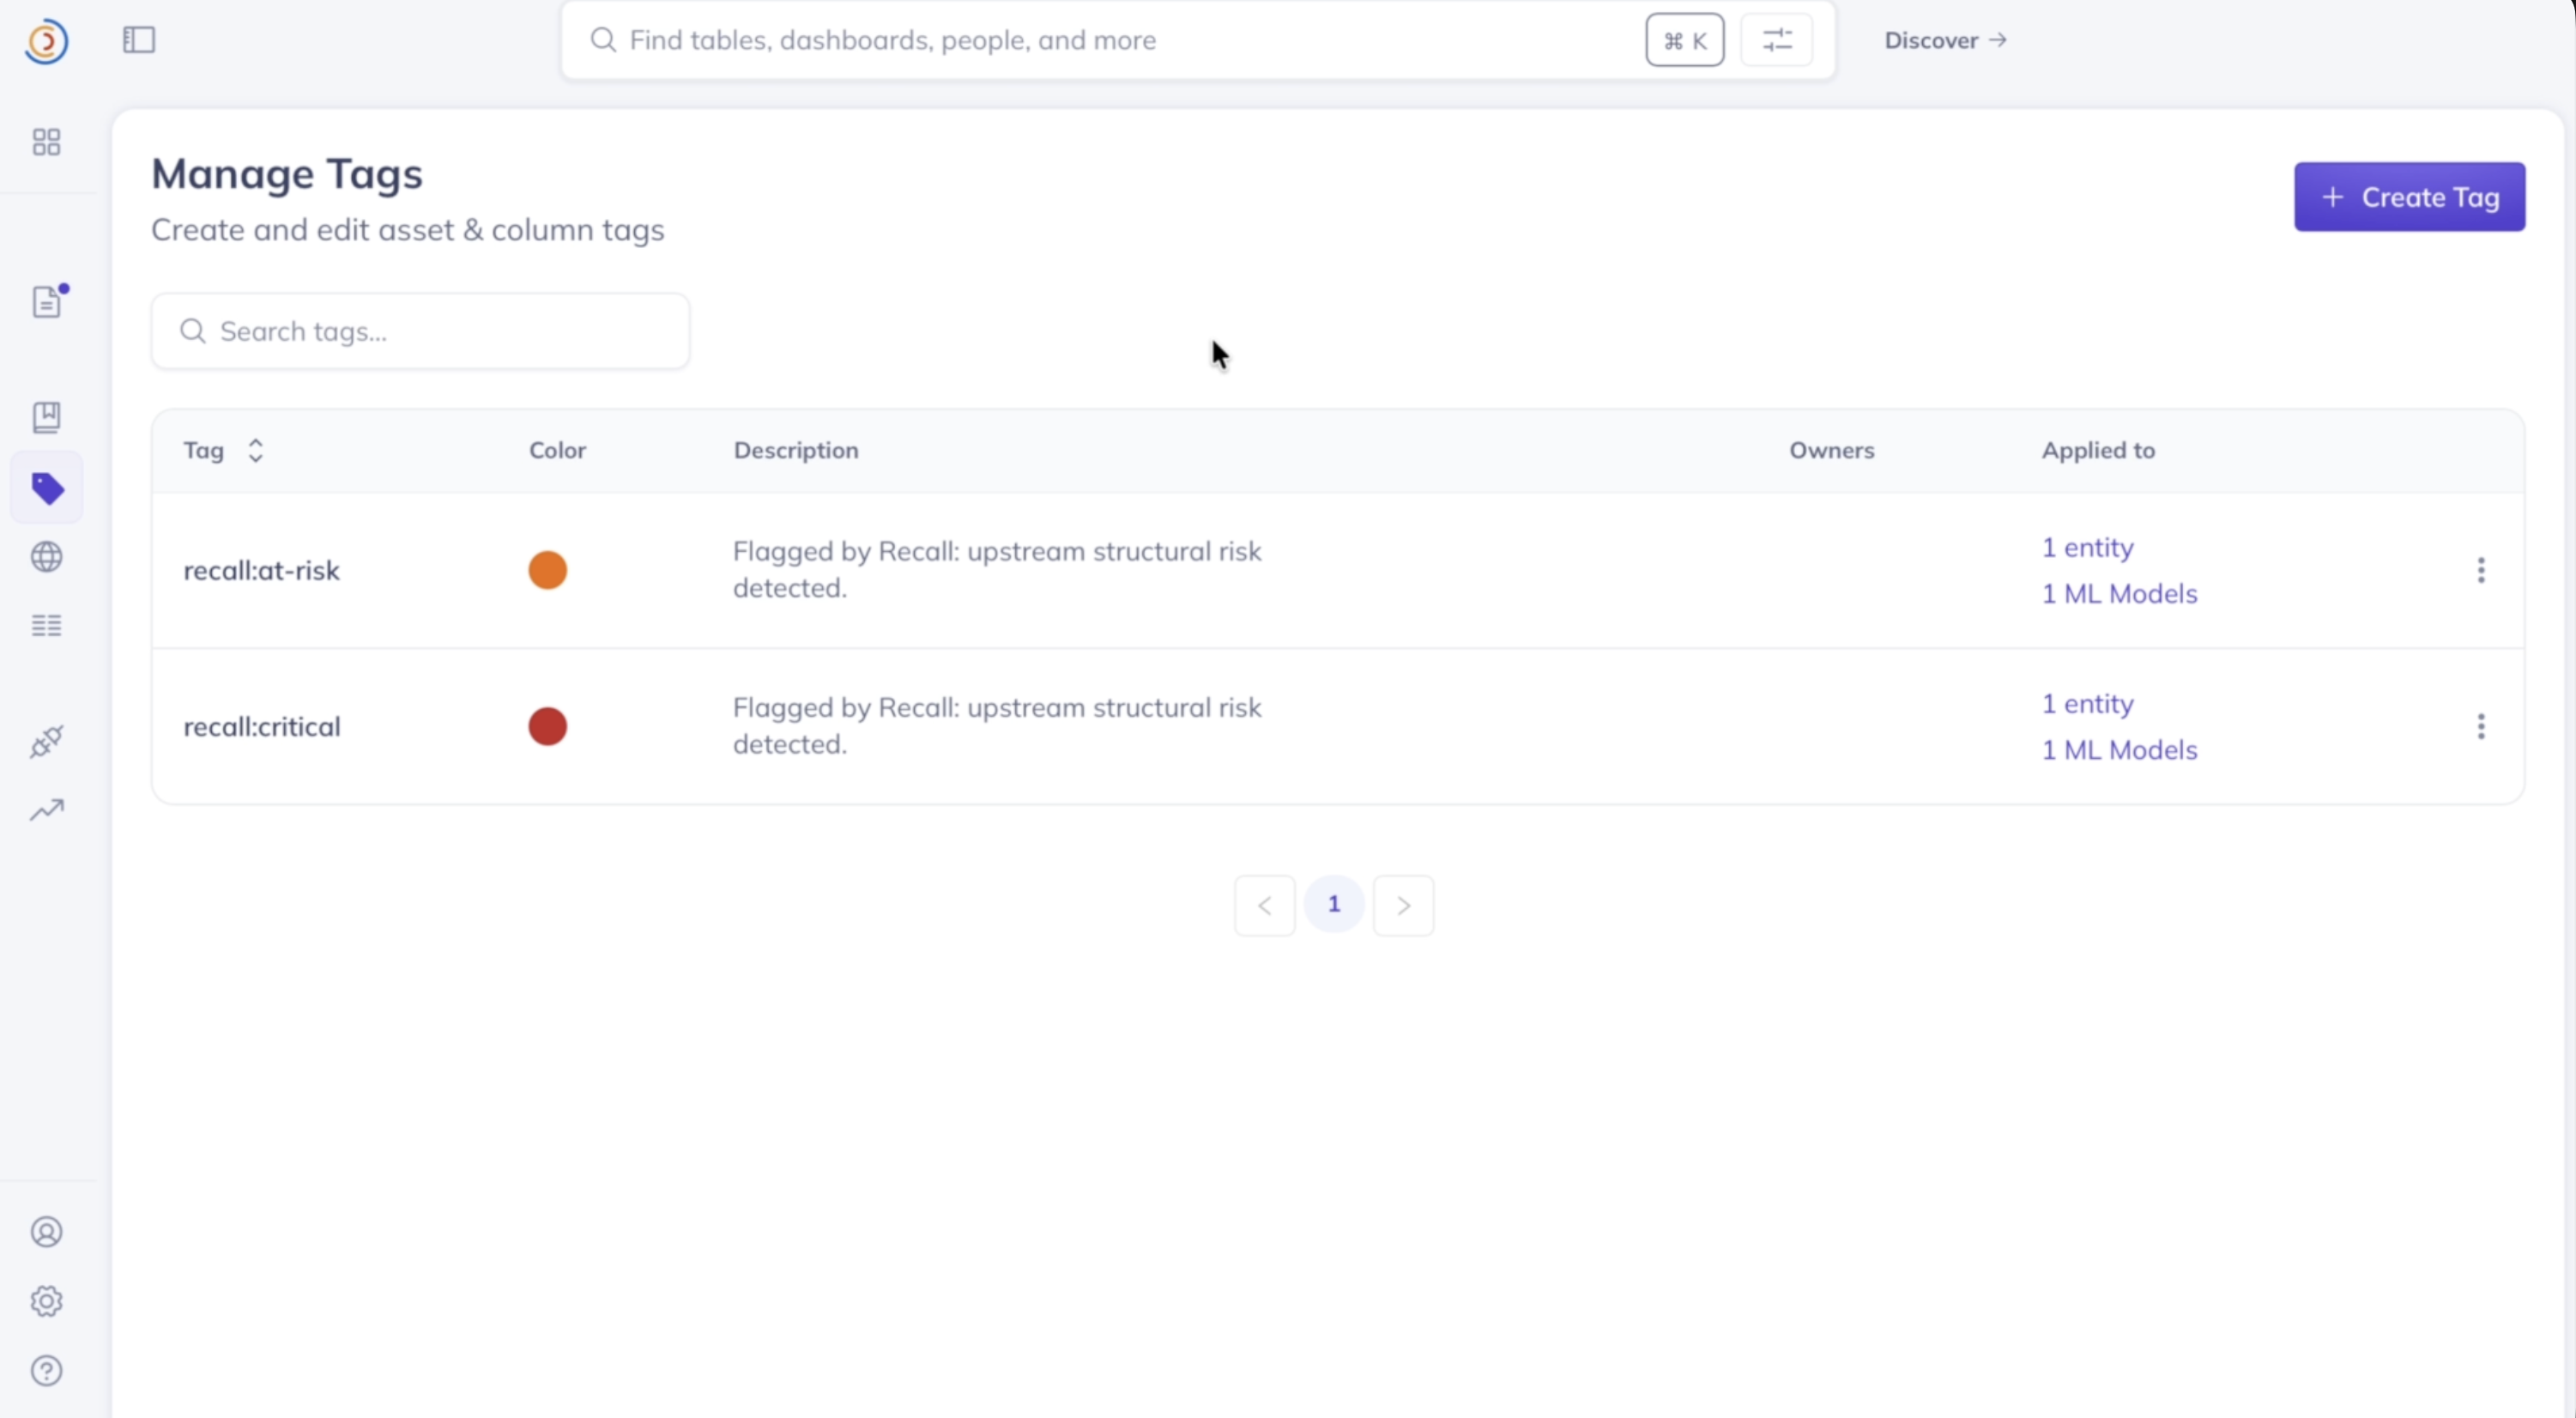
ML Risk Model Tags
-
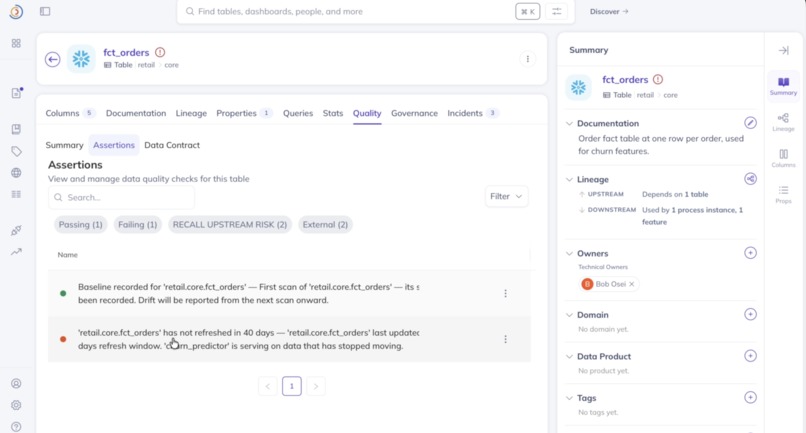
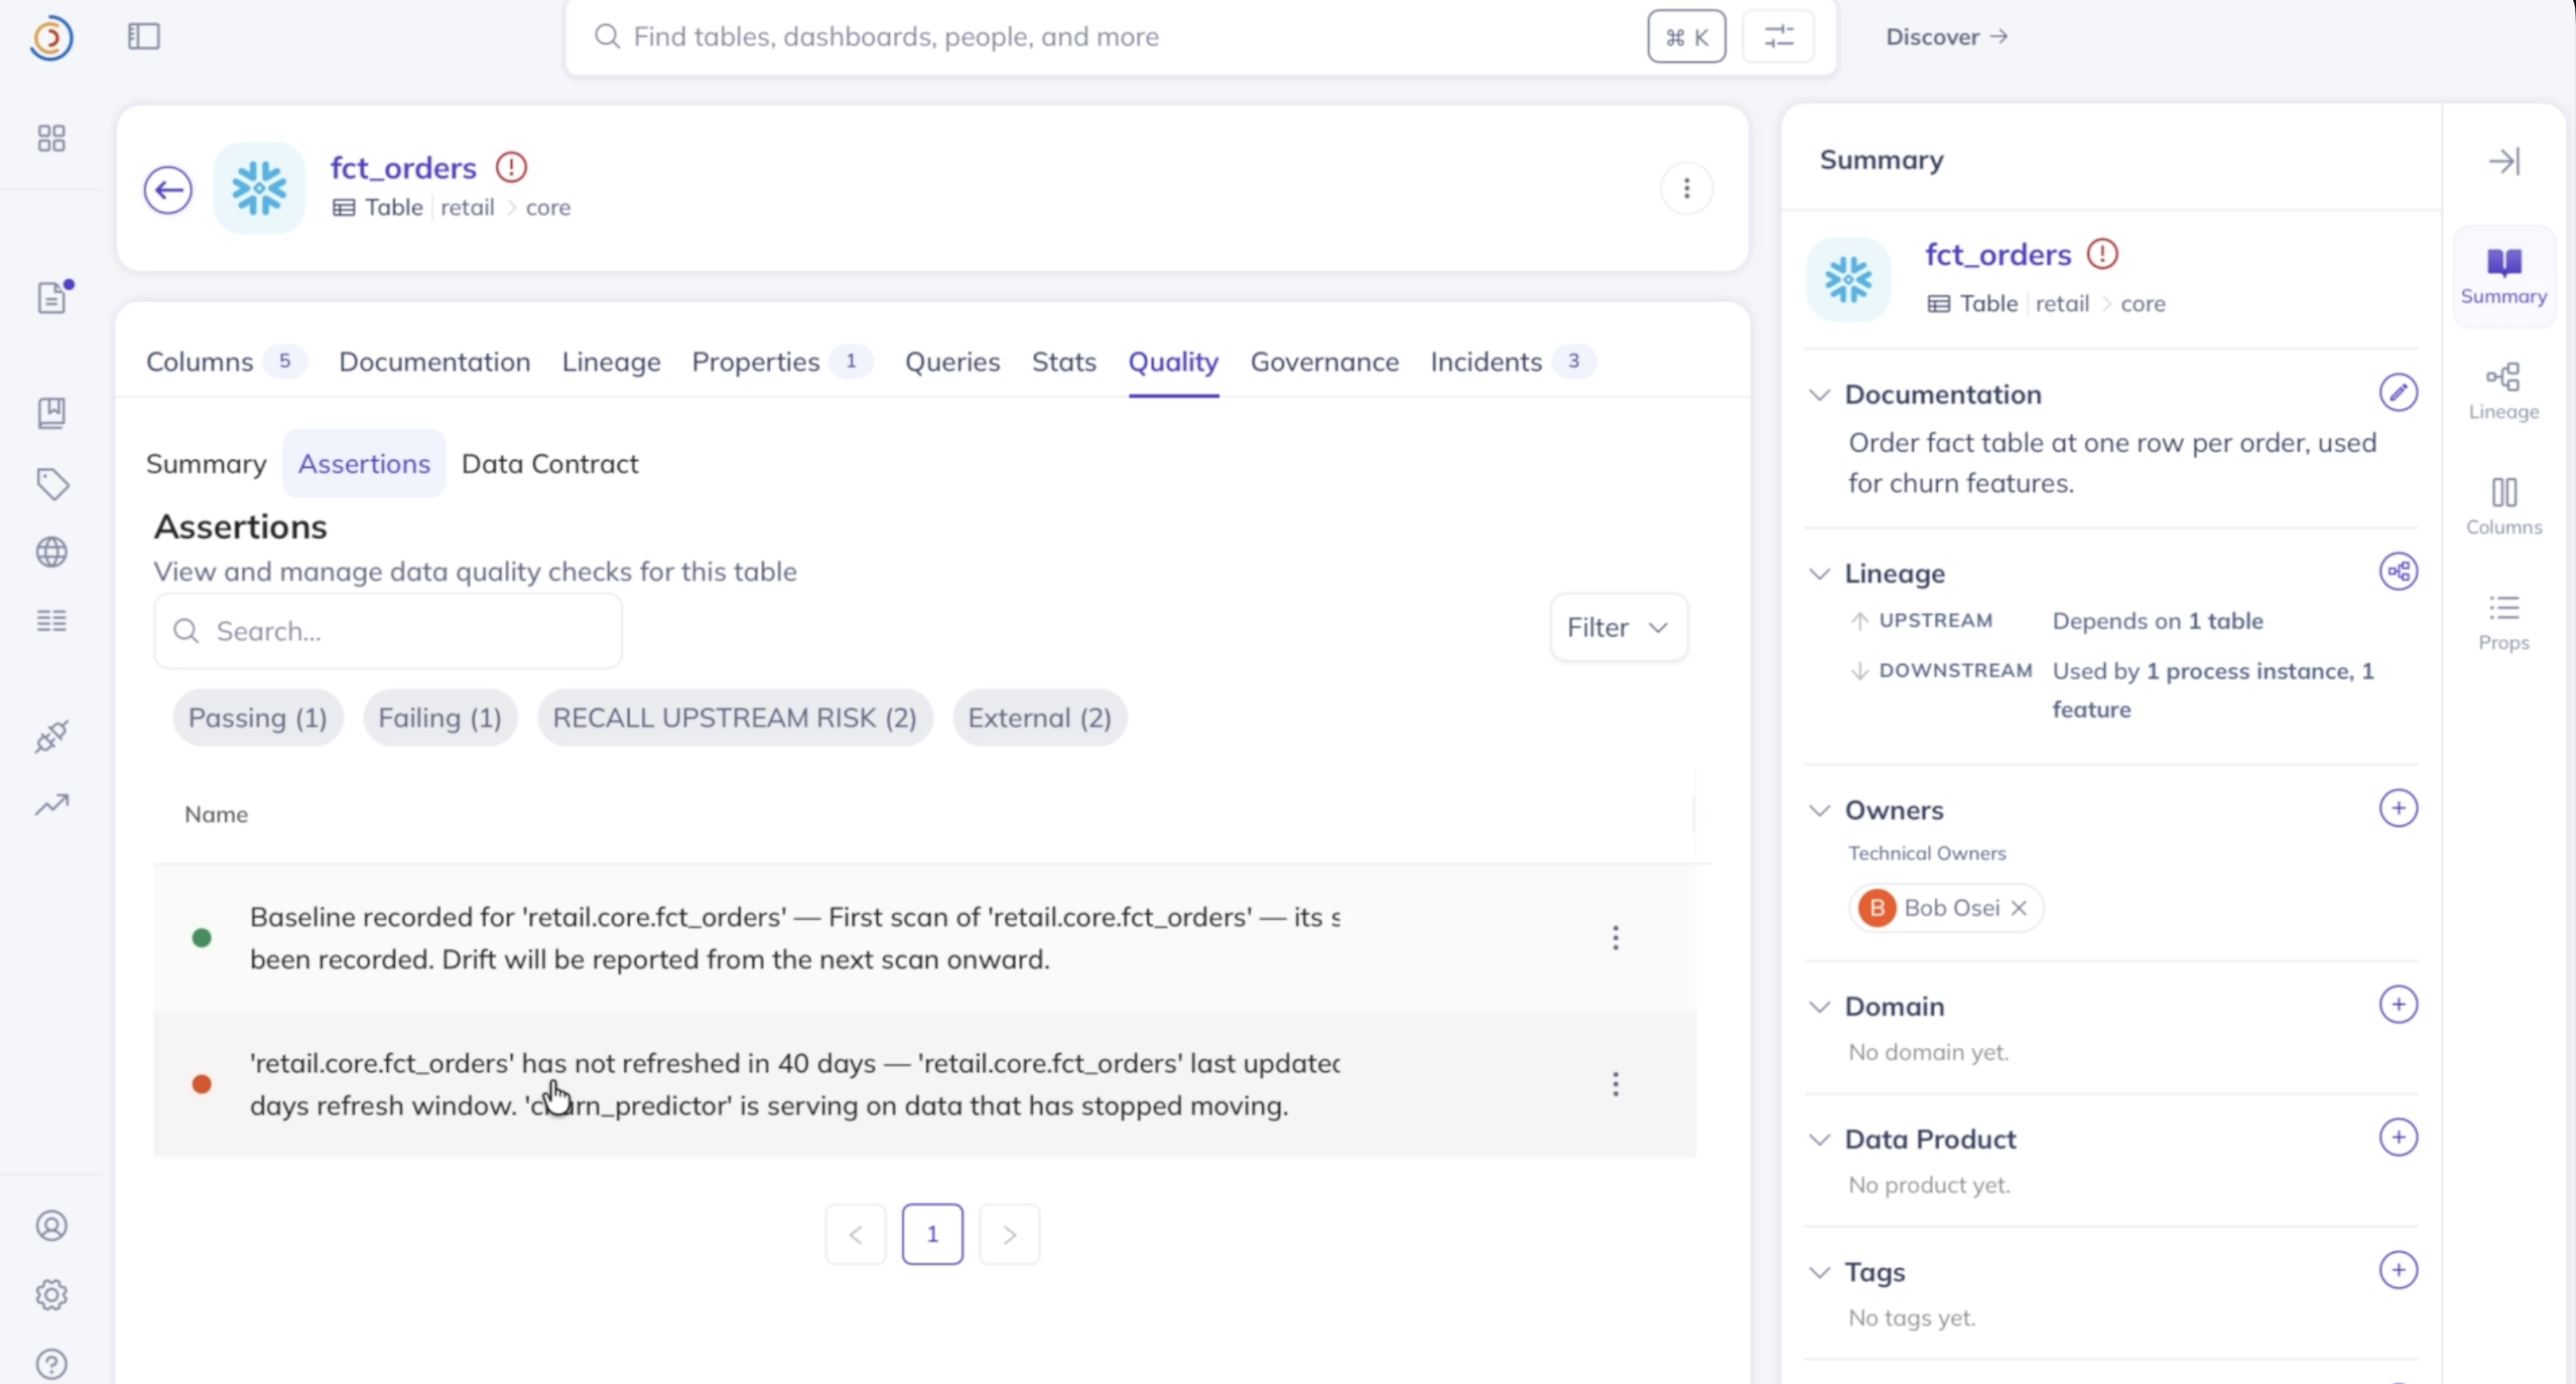
Assertions
-
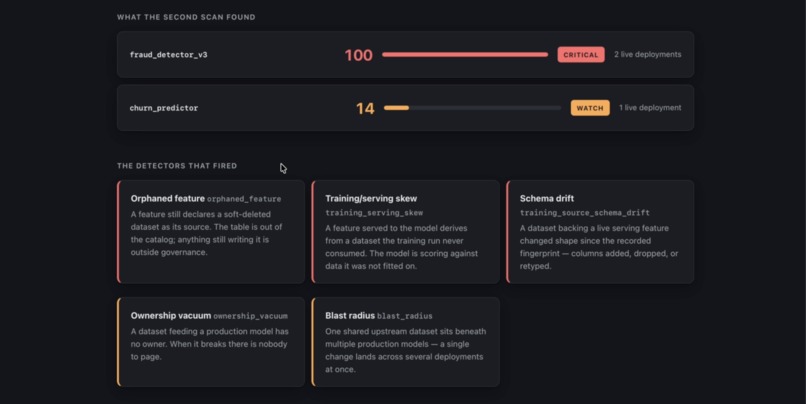
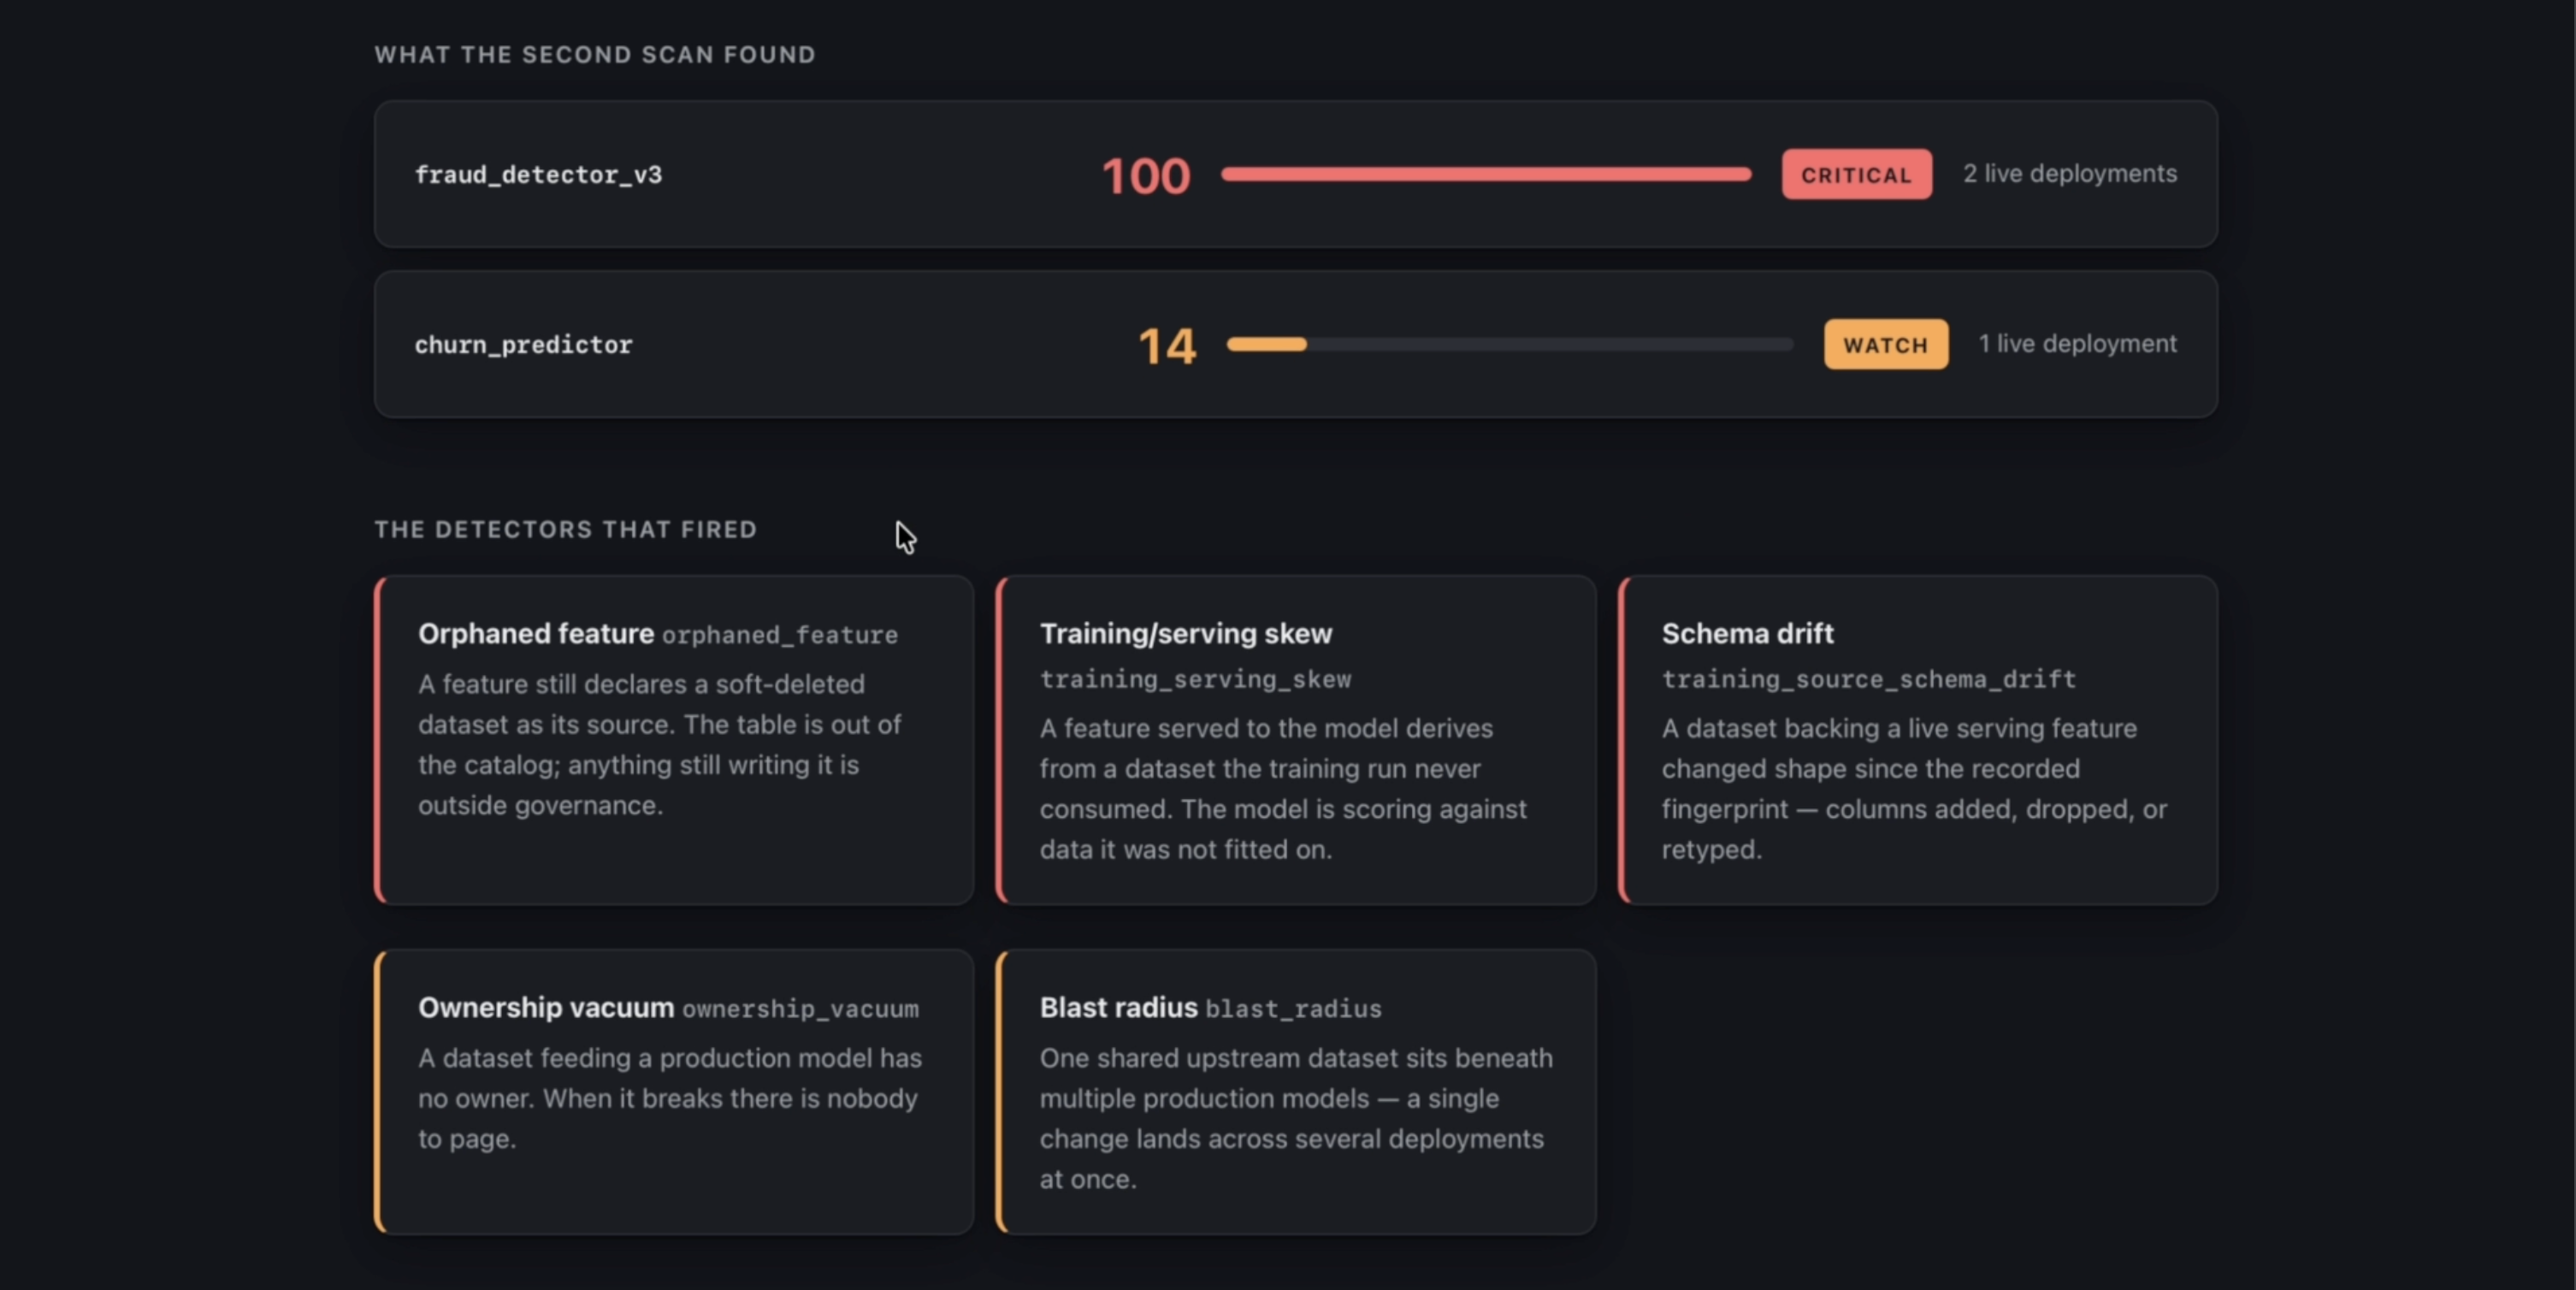
Pre Mortem
Inspiration
ML models in production don't fail loudly. They fail silently.
When a model breaks it almost never throws an exception — it keeps returning predictions with perfect confidence, and they're just wrong. And the cause is almost never in the model code. It's upstream: a training source added a column or changed a type, a feature's source table got deprecated, an upstream table stopped refreshing three weeks ago, the engineer who owned the pipeline left, or the feature table used at serving time quietly started reading a different source than the one the model trained on.
The entire ML observability market — Arize, WhyLabs, Evidently, SageMaker Model Monitor — watches model outputs. That is a lagging indicator by construction. By the time prediction drift crosses a threshold, you have served bad predictions for days or weeks, and you still have to run a manual investigation to find out why.
Then we looked at what DataHub already stores:
dataset --DerivedFrom--> mlFeature --Consumes--> mlModel --DeployedTo--> mlModelDeployment
   ^                                                 ^
   └──── dataProcessInstance (MLFLOW_TRAINING_RUN) ───┘
         inputEdges = what training ACTUALLY consumed
The complete causal chain is already in the graph. Nothing walks it backwards to flag models at risk before they degrade. That gap is the whole project. Lineage monitoring is a leading indicator; output monitoring is a lagging one.
What it does
Recall walks every production model's full upstream metadata closure in DataHub, evaluates seven detectors over it, scores each model 0–100, and then writes the findings back into DataHub so the next engineer or agent inherits the diagnosis instead of repeating the investigation.
  MODEL                SCORE                 TIER       DEPLOYED
  fraud_detector_v3      100   ██████████    CRITICAL          2
  churn_predictor         48   █████░░░░░    AT_RISK           1

  CRITICAL  Feature 'device_risk_score' reads from a soft-deleted dataset
  CRITICAL  Serving reads 'device_signals_v2', which training never consumed
  CRITICAL  Schema of 'retail.raw.transactions' changed since the last scan
  CRITICAL  'retail.core.fct_orders' has not refreshed in 40 days
  WARN      'retail.core.dim_customers' puts 2 production model(s) at risk

  ───── BLAST RADIUS ─────
  retail.core.dim_customers → 2 production model(s) · 3 live deployment(s)
The seven detectors
| # | Detector | What it catches |
|---|---|---|
| 1 | training_source_schema_drift |
A dataset the model trained on changed shape — column added, dropped, or retyped |
| 2 | orphaned_feature |
An mlFeature whose source dataset is missing, soft-deleted, or deprecated |
| 3 | upstream_staleness |
A source dataset stopped refreshing past its window |
| 4 | ownership_vacuum |
The model or a critical upstream has no owner — nobody to page |
| 5 | training_serving_skew |
The serving feature table resolves to a different dataset set than the training run consumed |
| 6 | undocumented_critical_path |
A high-fan-in dataset feeding a PROD model with no description and no glossary term |
| 7 | blast_radius |
Inverts the graph: how many PROD models one at-risk dataset endangers, ranked by live deployments |
Detectors 5 and 7 don't exist in DataHub or in any output-drift tool we could find.
Detector 5 is detectable precisely because of a gap in DataHub's own graph.
MLFeatureTableProperties.mlFeatures is a Contains edge with isLineage: false, so
the serving path never appears in a lineage query — you cannot see it by traversing
lineage. Recall reconstructs the serving path from raw aspects and diffs it against
DataProcessInstanceInput.inputEdges, the ground truth of what training actually
read. The set difference is structural training/serving skew: the model is scoring
on a data source it was never fitted against. No output-drift monitor sees this,
because the predictions look completely normal.
Detector 7 inverts the graph and answers the question an on-call engineer actually has: "this one schema change puts three production models at risk — here they are, ranked by live deployments." One fix clears all of them.
Risk scoring
score = Σ severity_weight(findings) × (1 + 0.15 × active_deployments)   capped at 100

CRITICAL ≥ 60    AT_RISK ≥ 30    WATCH > 0    HEALTHY = 0
Every weight, threshold, and severity lives in recall/recall.yaml — retuning the
whole engine never requires a code change.
What it writes back into DataHub
The judging criteria reward going beyond reading metadata. Recall writes back five ways, all idempotent:
| Write | Target | Mechanism |
|---|---|---|
| Custom assertion + run event | dataset | upsert_custom_assertion + AssertionRunEvent aspect |
recall.riskScore / recall.riskTier |
mlModel | structured properties |
recall:critical / recall:at-risk tag |
mlModel | add_tags |
| Incident | dataset (+ affected models named) | raiseIncident GraphQL |
| Pre-mortem document | knowledge base | save_document / datahub.sdk.Document |
Structured properties are the sleeper. Once Recall writes recall.riskScore, it is
queryable through DataHub's own search index, and the tags Recall writes appear as
facets on the ML Models browse page. DataHub becomes the risk dashboard. Any tool
that can reach DataHub's GraphQL API can ask "which models are at risk" without
knowing Recall exists. We deliberately did not build a React dashboard — composing
DataHub's shipped surfaces is the more interesting answer, and the more useful one.
Assertion URNs are derived deterministically from (detector, subject), so a re-scan
updates the existing assertion rather than piling up a new one every run.
How we built it
The architectural thesis: deterministic Python does the detection; the LLM only explains and remediates.
Graph traversal and rule evaluation are pure functions over metadata — fast,
unit-testable, reproducible. A language model traversing lineage would be slow,
non-reproducible, and would invent edges that don't exist. So detection is ordinary
Python, and every detector is a pure function (closure, config, state) -> [Finding].
Time enters only as closure.scanned_at_ms; history only through an injected state
store. An AST walk over recall/detectors/ asserts mechanically that no detector
reads the clock, touches the filesystem, or opens a socket — the purity rule is
enforced by a test, not by discipline.
The agent's job starts after detection, where the task is genuinely linguistic.
recall scan --narrate runs a tool-using Claude agent over the DataHub MCP
server. Given the skew finding, it made 4 MCP calls and came back having read the
deprecation note naming the replacement table, diffed the two schemas (device_risk
→ risk_score, plus a new model_version column), noticed the column hadn't merely
been renamed but rescaled — "vendor-supplied risk score in [0,1]" versus "rescaled
vendor risk score" — identified the single owner who has to make the call, and read
the open incidents on the replacement table before recommending a cutover to it. Then
it wrote remediation grounded in all of it.
The agent is granted read-only MCP tools. Write-back is deterministic and belongs
to writeback/, not to something a model decides mid-sentence.
Three narration tiers, tried in order: the agent (Claude Code credentials, no API
key), then a plain LLM call with ANTHROPIC_API_KEY, then deterministic
templates. A judge with no Claude credentials at all still gets a complete, accurate
pre-mortem. The deliverable is never hostage to an optional dependency.
┌──────────────────────────────────────────────────────────────┐
│  DataHub OSS (localhost)                                     │
│  models · features · feature tables · datasets · runs        │
└───────────┬──────────────────────────────────┬───────────────┘
            │ READ (aspects)                   │ WRITE BACK
            ▼                                  ▲
  ┌───────────────────┐             ┌──────────────────────┐
  │  Graph Resolver   │             │   Writeback Layer    │
  │  (deterministic)  │             │  · custom assertions │
  │  upstream closure │             │  · risk properties   │
  │  per model        │             │  · tags              │
  └─────────┬─────────┘             │  · incidents         │
            │                       │  · pre-mortem docs   │
            ▼                       └──────────▲───────────┘
  ┌───────────────────┐  findings              │
  │  Detector Engine  │───────────┐            │
  │  7 pure functions │           ▼            │
  └───────────────────┘  ┌──────────────────┐  │
                         │ Narrator Agent   │──┘
                         │ (Claude via MCP) │
                         └──────────────────┘
Everything runs against DataHub OSS, locally. seed/ builds a realistic ML estate
(3 models, 2 feature tables, 8 datasets, training runs, deployments, owners, glossary
terms), break_it.py injects five failures, and reset.py restores it so the demo is
re-runnable on camera.
Challenges we ran into
Almost every hard problem here came from the same source: the difference between what the metadata model says and what a running server does. Every one of these was found by measuring, not by reading.
1. Never depend on Elasticsearch during a scan. scrollAcrossLineage, entity
search, and timeseries aspects — including Operation, which is the natural
freshness signal — are all ES-backed and lag writes. A judge running
make seed && make scan back-to-back would get an empty closure, an empty model list,
or phantom staleness: failures that look exactly like bugs in Recall.
There turned out to be a second, sharper reason. Against the seeded estate, a raw
searchAcrossLineage from fraud_detector_v3 returns the full chain — 3 mlFeature
at degree 1, datasets at degree 2–3. But DataHubClient.lineage.get_lineage() returns
only the datasets: its hardcoded GraphQL carries inline fragments for Dataset and
DataJob only, so ML entities are silently dropped. A closure built on that helper
would have been missing the entire serving path — exactly what the flagship skew
detector depends on.
So the closure is built from graph.get_aspect() reads, which hit GMS and are
immediately consistent; model enumeration comes from a manifest the seed emits; and
freshness resolves through a fallback chain (Operation → DatasetProperties.lastModified
→ custom property). Lineage search is still exercised for the pre-mortem's "prove the
path" section, but the scan reports it rather than depends on it.
2. The quickstart server trails the CLI, and it matters. acryl-datahub==1.6.0.15
brings up server v1.5.0.6. Two things break:
report_assertion_result()sends anAssertionResultSeverityfield the older server's GraphQL schema doesn't define → 500. Recall emits theAssertionRunEventaspect directly instead; raw aspect emission talks to GMS and isn't coupled to the GraphQL schema at all.raiseIncidentrejectsmlModelURNs on this version.IncidentInfo.pdlon master does listmlModelin theIncidentOnrelationship — but that hasn't reached a release. Recall probes the capability once and degrades to raising the incident on the offending dataset with the affected models named in the description.
The lesson we kept relearning: master-branch source is not evidence of shipped behaviour. We were confidently wrong about this exact thing until the live server corrected us.
3. A JSON patch to structuredProperties writes but never indexes. Patching the
risk score is the cleaner write, and it works — the value lands in GMS and reads back
correctly through get_aspect. It is simply never indexed for search. The whole
point of writing the score is that DataHub's search becomes the query surface, so a
patch silently trades away the entire feature and the failure is invisible until you
try to query it. Recall writes the full aspect and make verify-search proves the
filter returns exactly the at-risk models.
4. The flagship detector's real enemy is false positives. Every supervised training run consumes a labels table that serving has no reason to read. Unfiltered, detector 5 fires on a perfectly healthy estate and instantly loses all credibility. Label-shaped inputs are excluded, the two directions carry different severities (serving-only is CRITICAL, training-only is WARN), and a model with no recorded training run reports an INFO gap rather than a phantom CRITICAL.
5. Escalation has to key off dataset role, not column identity.
MLFeatureProperties.sources points at a dataset, never a column. "This column backs
this feature" is therefore not computable from the graph, and claiming otherwise would
mean inventing a lineage edge DataHub does not have. Recall escalates on whether the
changed dataset sits on the serving path or the training path, and attaches
name-matching columns as supporting evidence only.
6. Structured properties are not free-text searchable. Typing
recall.riskScore > 45 into DataHub's search bar returns nothing — that's a structured
filter, not a text query. We verified the mechanism through GraphQL and then wrote it
up as UI search-bar syntax, which was simply wrong. The UI shot that actually works is
the recall:critical tag facet on the ML Models browse page. Verify claims on the
surface you're describing, not on an adjacent one.
Accomplishments that we're proud of
- Detector 5 exists at all. Finding a real failure mode that is invisible to
DataHub's own lineage queries because of a documented
isLineage: falseedge, and then reconstructing it from aspects, is the piece of this we'd defend hardest. - 444 tests, no DataHub required. Three carry outsized weight: all 7 detectors × a healthy estate → zero findings (the false-positive net — every misfire caught here is one that would otherwise happen live, on camera); all 7 detectors × an empty closure → no exception (demo survival); and the AST purity walk.
- The write-back is real, and it's five paths. Assertions, structured properties, tags, incidents, and knowledge-base documents. The metadata graph is strictly richer after a scan than before it.
- An upstream contribution we actually needed. See below.
- It degrades gracefully at every seam. No Claude credentials, no MCP server, an older GMS that rejects mlModel incidents, a first run with no schema baseline — each produces a correct, clearly labelled result instead of a stack trace.
What we learned
DataHub's ML entity model is considerably richer than its ML tooling — the
mlModel / mlFeature / mlFeatureTable / mlPrimaryKey / mlModelDeployment /
dataProcessInstance graph can express training-versus-serving provenance completely,
and almost nothing reads it that way. Most of the interesting work in this project was
figuring out which edges carry isLineage: true and what that implies about what you
can and cannot see through a lineage query.
The other lesson is methodological, and we relearned it three times: verify on the
surface you intend to describe. We verified the risk-score filter via GraphQL and
documented it as search-bar syntax; verified incident targeting from the PDL on master
and documented it as shipped behaviour; verified a patch write via get_aspect and
assumed it was indexed. All three were wrong in the same shape. Every claim in the
README and in the demo script is now something that was actually run on the surface
being described.
Open-source contribution
docs/advanced/patch.md in datahub-project/datahub states that patch-builder support
is wanted for "Containers, Data Flows (Pipelines), Tags, Glossary Terms, Domains, and
**ML Models." There is no MLModelPatchBuilder today, which means writing
MLModelProperties clobbers the whole aspect — the exact hazard Recall hits when it
annotates a model.
We needed it, so we built it — and found the gap is deeper than the docs imply. A
JSON patch is applied server-side by a registered Java Template, so a Python builder
alone produces well-formed MCPs that GMS then rejects with "template" is null.
Measured against v1.5.0.6, patching an mlModel:
| Aspect | Patchable |
|---|---|
globalTags, ownership, glossaryTerms, structuredProperties |
✅ entity-agnostic templates are registered |
mlModelProperties |
❌ no template — 500 |
So the contribution is two halves, both staged in scripts/upstream_pr/: the Python
MLModelPatchBuilder (with tests) and the server-side MLModelPropertiesTemplate that
makes it work. Verified live: a patch adding a tag to a model left its description,
version, 3 features, 3 metrics, and 2 deployments untouched.
What's next for Recall
- Ship the two-half patch PR upstream and close the gap
patch.mdnames. - Column-level closure.
fineGrainedLineagesonUpstreamLineagewould let detector 1 escalate on the column that actually backs the feature rather than on dataset role — turning today's supporting evidence into the primary signal. - Continuous mode. The scan is idempotent and fast (3 models, 0.13s, 8 batched aspect calls), so it wants to be a scheduled job that raises an incident the moment a model crosses into CRITICAL, rather than something you run by hand.
- Recall as an MCP server. The scan results are already structured; exposing them as tools would let any agent ask "which of my models are at risk and why" and get the causal chain back.
- More detectors from the same graph: feature-table freshness versus model SLA, glossary-term/PII propagation into feature sets, and deployment-versus-registered- version mismatch.
Try it
Requires Python 3.10+, Docker with ~8 GB available, and uv.
make install     # virtualenv + dependencies
make up          # DataHub OSS locally — http://localhost:9002 (datahub / datahub)
make seed        # a healthy ML estate: 3 models, 2 feature tables, 8 datasets
make scan        # baseline — everything HEALTHY
make break       # five realistic failures
make scan        # every one of them caught
make demo runs the whole sequence unattended; make reset restores the estate.
make verify proves every write-back path against your instance and prints which
capabilities it has. make test runs all 444 tests with no DataHub required.
The five injuries are all things that happen on a normal Tuesday. Two of them are
halves of one story: somebody began migrating device_signals to a v2 table, pointed
the serving feature at the new one, retired the old one — and never retrained the
model. That single half-finished migration leaves the feature reading a dead table
and a table the model was never fitted against.


Log in or sign up for Devpost to join the conversation.