-
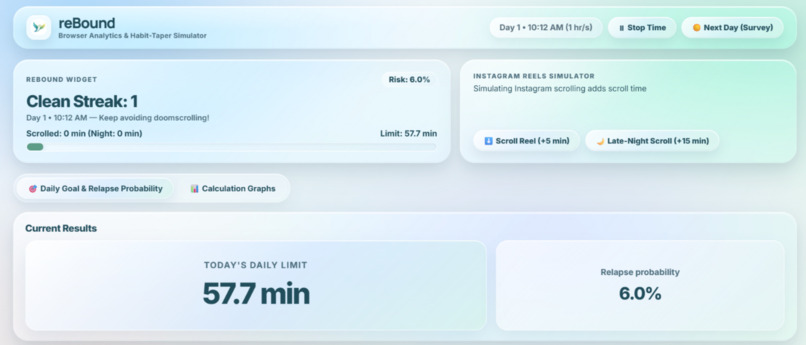
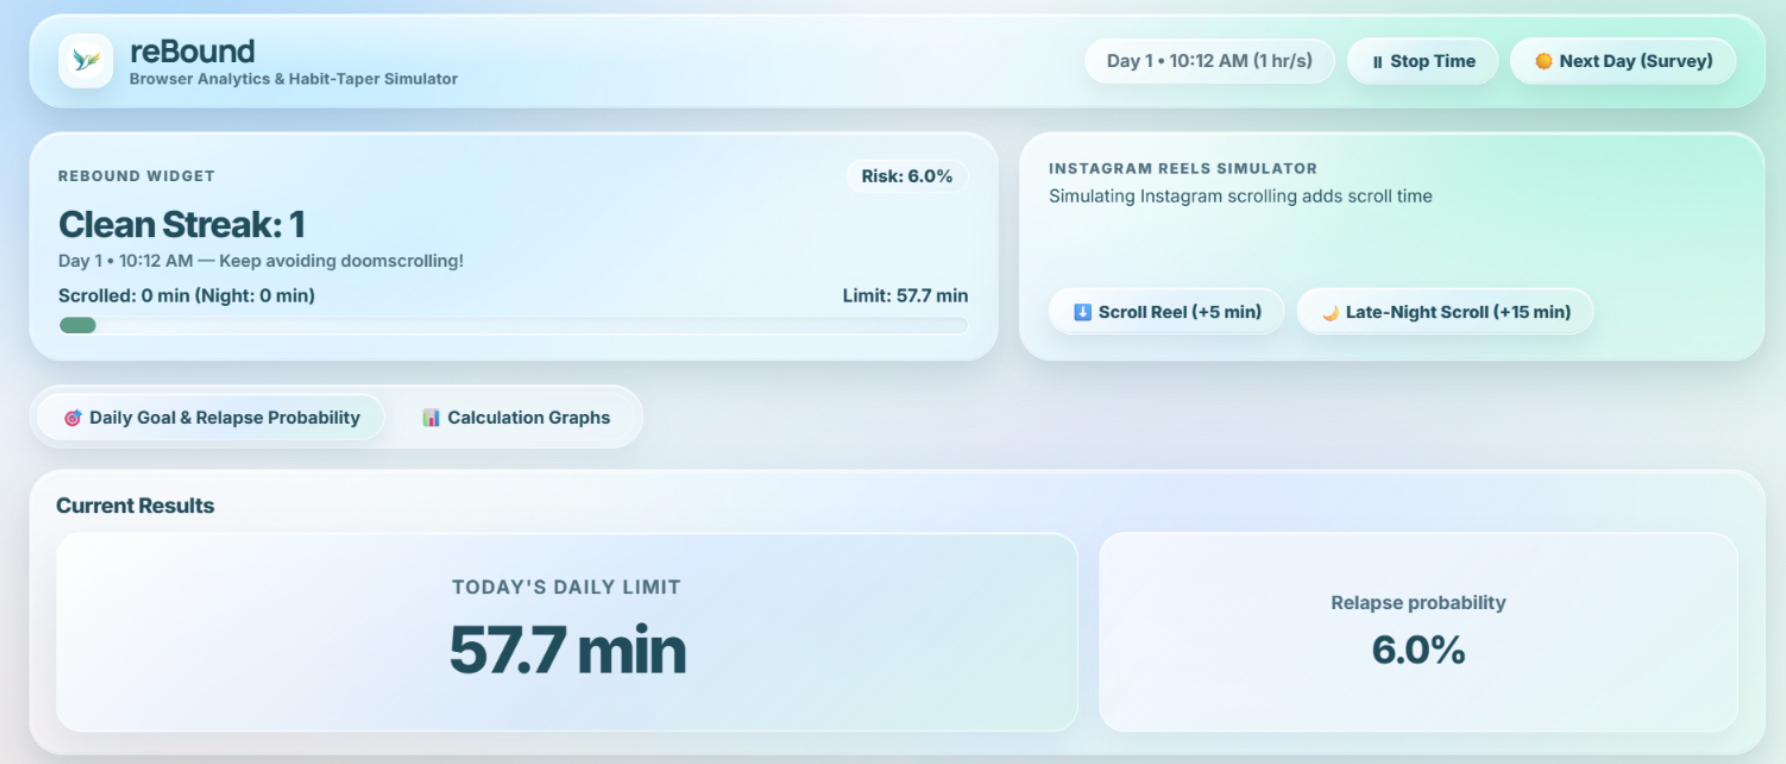
reBound dashboard demo
Inspiration
It is a well known fact that social media scrolling is catastrophically affecting the generation of teens. On average, they spend 7 hours/day looking at screens, 3 hours of which are on social media apps such as Instagram and Tik Tok. The current solution many use is apps that trigger a time limit, but it falls apart there. These apps often trigger the Abstinence Violation Effect (AVE) — leading to total goal abandonment when a user overshoots their limit by even a few minutes.
ReBound addresses the challenge of social media addiction using a mathematical model and considering scientifically proven neurological factors to create a dynamic plan that is personalized to the user. It is close to impossible to simply quit a bad addiction ‘cold turkey’, so ReBound gives users a realistic and achievable timeline for a realistic ease off of an addiction. Our app recognizes healing addiction as a project that will take time, and assists users along the way to gradually decrease their destructive tendencies.
What it does
An AI coach that evaluates daily dopamine scores, survey check-ins, and scroll time and gives you suggestions Dynamically calculated daily limits for screen time Blocking Instagram and TikTok once the maximum screen time is reached Mathematical Plotting: Live rendering of a Logistic Regression (Sigmoid) risk curve showing the user's current relapse odds alongside an exponential goal decay curve. Tkinter Mobile Simulator: A complete smartphone UI simulator built in Python to test and demo the mobile user experience. WebSocket Server: Broadcasts live screen-time metrics and daily limit updates to connected browser extensions with zero latency. Matplotlib & HTML5 Canvas: Powers visual mathematical modeling across both our Python desktop prototype and interactive web dashboard.
How we built it
Our project uses various user metrics to calculate an array of desired conclusions. We organized this by listing all of the data we wanted to eventually be able to display to the user, and selecting variables that would dictate these results. We have formulated several mathematical formulas that our model consists of, and they all work together to determine the user’s optimal journey to ease addiction. For example, we calculate the probability of a relapse using a Logistic Regression (Sigmoid) function driven by a risk log-odds score (Zd); the user addiction severity (Ad) by considering time spent in a 15-day exponentially weighted rolling window; and daily goal targets (Trec) using an exponential decay model (Tb) paired with an adaptive safety buffer (S) that incorporates real-time behavioral telemetry, such as login frequency (t) and daily lifestyle habits ('d).
Challenges we ran into
- Full-Stack State Synchronization (Extension to Backend)
Because Chrome Extensions run inside an isolated security boundary, synchronizing real-time interaction variables directly with external processes was a major challenge. To solve this, we engineered a shared JSON data bridge to share live browser telemetry into our mathematical model and frontend. Our backend continuously ingests this data, evaluates the behavioral risk formulas, and dynamically updates the visualization layer in real time.
- Concurrent Development & Merge Conflicts
Collaborating simultaneously across multiple components (Chrome extension, Python backend, mobile app, and web dashboard) inevitably led to complex Git merge conflicts. This forced us to quickly adapt our team workflow. We eventually learned to work together by announcing what part of the project we were working on consistently, and by giving the rest of our teammates a cohesive context of our progress.
- Demonstrating Multi-Month Habit Tapering in a Live Demo
Our behavioral taper model is designed to be recorded over weeks or months, creating a unique challenge for a short 3-minute hackathon demo. To solve this, we built a simulation with an increased time multiplier (1 hour/sec) that allows judges to experience multi-day goal progression in seconds. At the same time, we maintained live WebSocket syncing between the Chrome extension and dashboard to demonstrate how seamlessly real-time tracking works in practice.
What we learned
Through this event, we researched neuroscience and mathematic related concepts, learning about concepts such as grey matter, the Sigmoid function, Logistic Regression functions, Exponential decay with other factors, the value of weighting variables, and summation notation. We also learned how to use GitHub seamlessly as a team, managing merging, pushing, and pulling while simultaneously working on the same project.
On top of this, throughout the event we learned how social media platforms platforms abuse human nature and psychologically destroy our minds to make us addicted and increase the time we spend on apps like instagram & tiktok, and how they trap us in endless cycles like a , desire-seek-reward cycle, using our bias towards negative content to fuel a continuous cycle of promises and lies, our response to specially curated and edited images to bring us into a cycle of validation fueled by self doubt, creating an endless stream of content that gives no cue of when to stop and weakening our ability/control to stop.
What's next for ReBound-MathHacks-2.0
Our team sees many potential opportunities to improve reBound, and we are hoping to implement:
- Mobile app
- Models and modes for other addictions such as vaping, alcohol, nicotine (zyns)
- Changing to automated data collection instead of user surveys
- Notifications for reminders
- Improved, and more scientifically backed models
Built With
- css
- html
- javascript
- matplotlib
- numpy
- python
- restapi
- websockets


Log in or sign up for Devpost to join the conversation.