-
Result
Inspiration
This is a open source project for the company LifeFoundry.
What it does
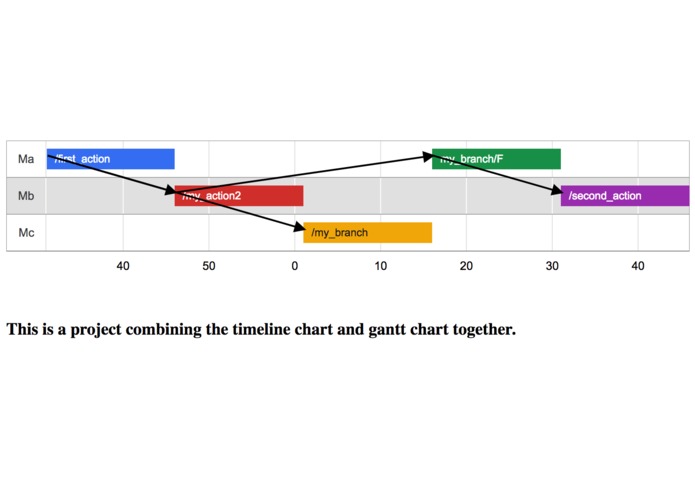
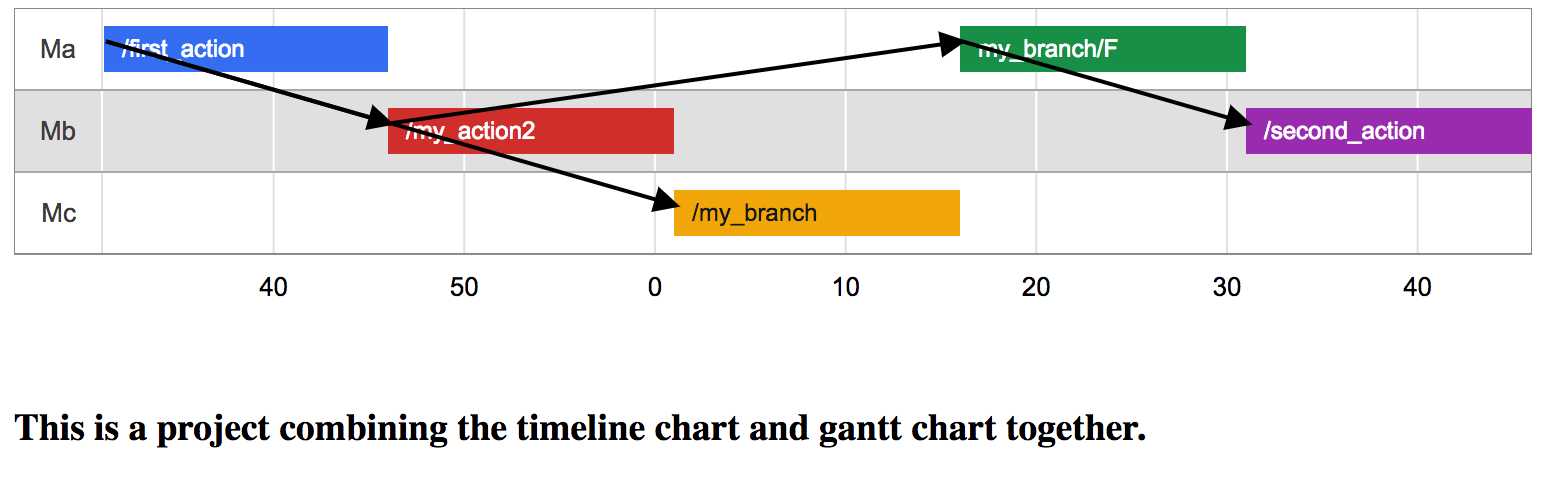
This project combines the timeline chart and gantt chart together in order to track the dependencies of the tasks and match the tasks with the machine they are running on.
How we built it
We use google chart as the basic setup. And we use Konva to draw arrows on canvas.
Challenges we ran into
Since timeline chart in google-chart doesn't have any property with dependencies, it's hard to draw arrows between each task. We spend a lot of time to get the rendered task bars printed on the console. Finally, we comes up the solution that after the DOM finish the rendering, we loop through the possible tag for the task bars and get the positions. Then we are able to use the position to draw arrows between the task bars.
Accomplishments that we're proud of
We finally figure out the position of the task bars and render the arrows. And the task bars are colorful and easy to distinguish.
What's next for realtime-chart
Setup backend so that we can update JSON file dynamically.


Log in or sign up for Devpost to join the conversation.