-
-
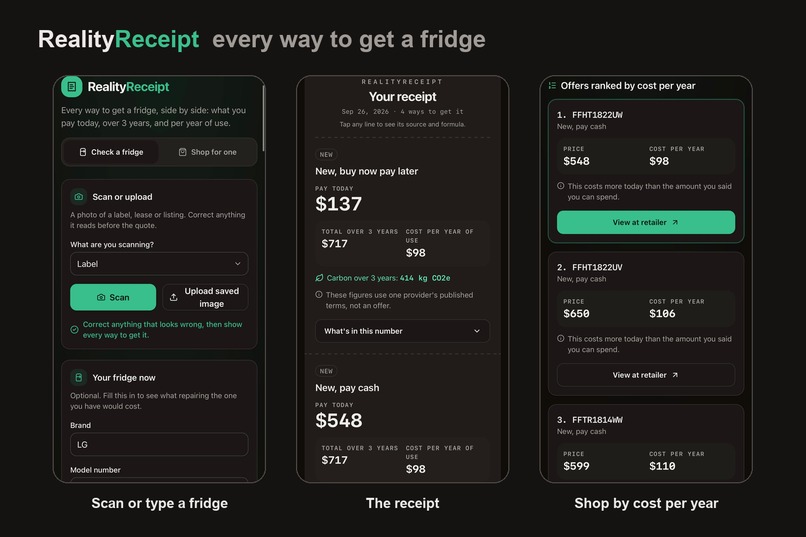
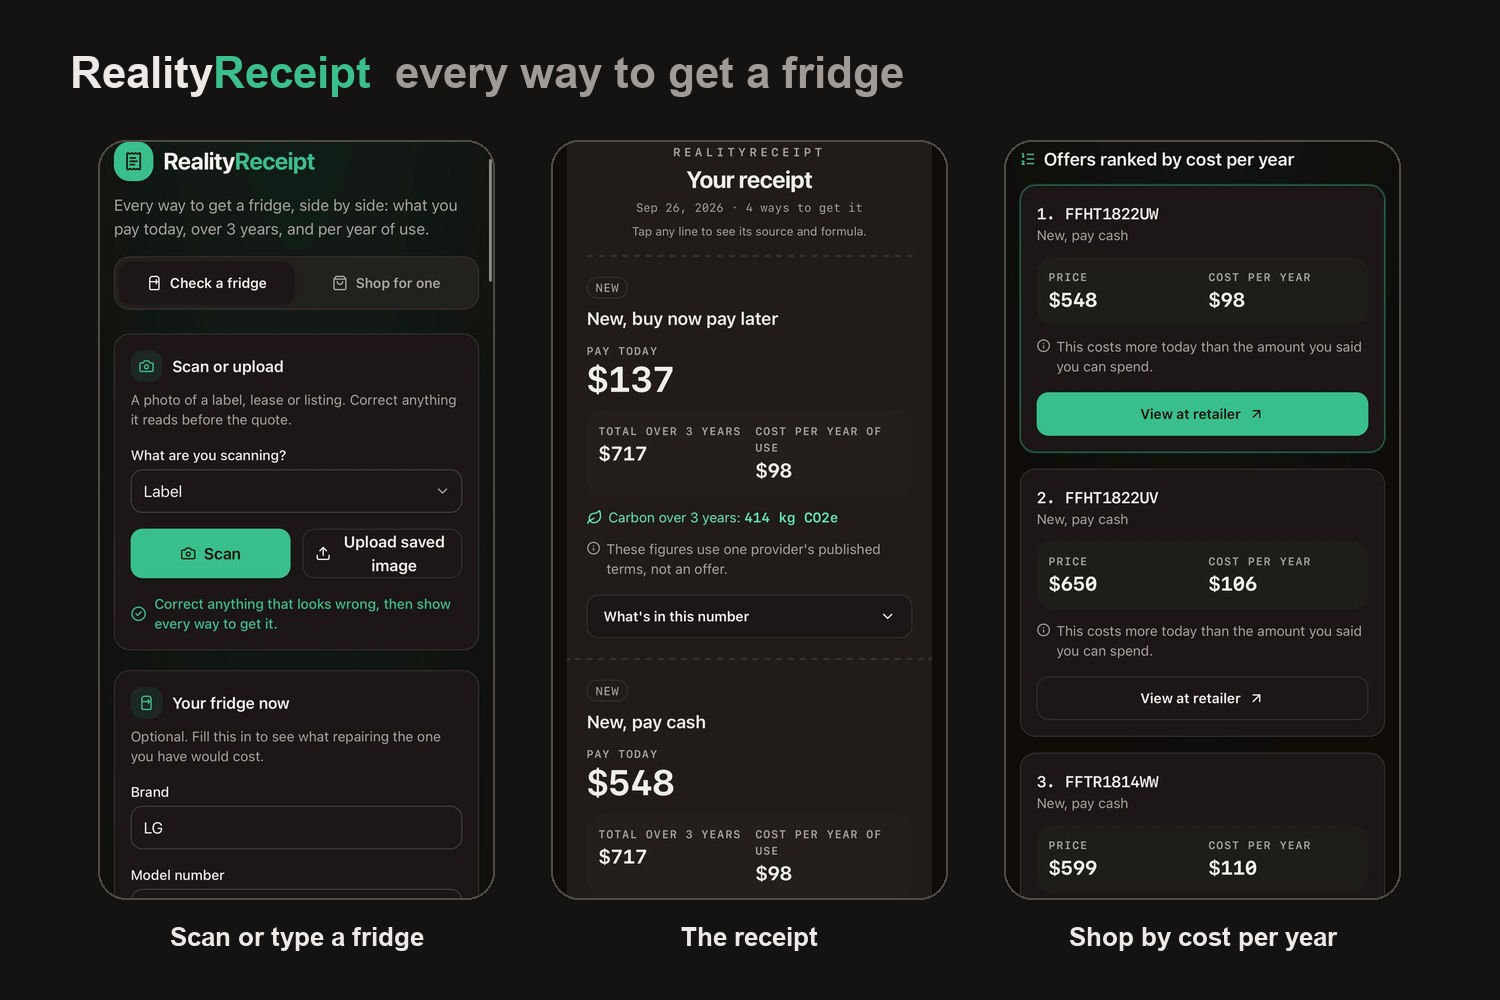
Scan or type a fridge, compare every way to get it on one receipt, and shop by cost per year.
-
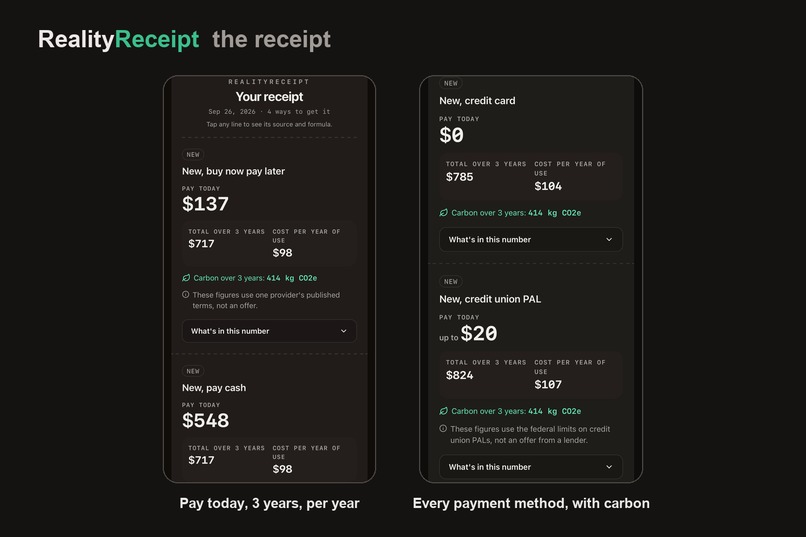
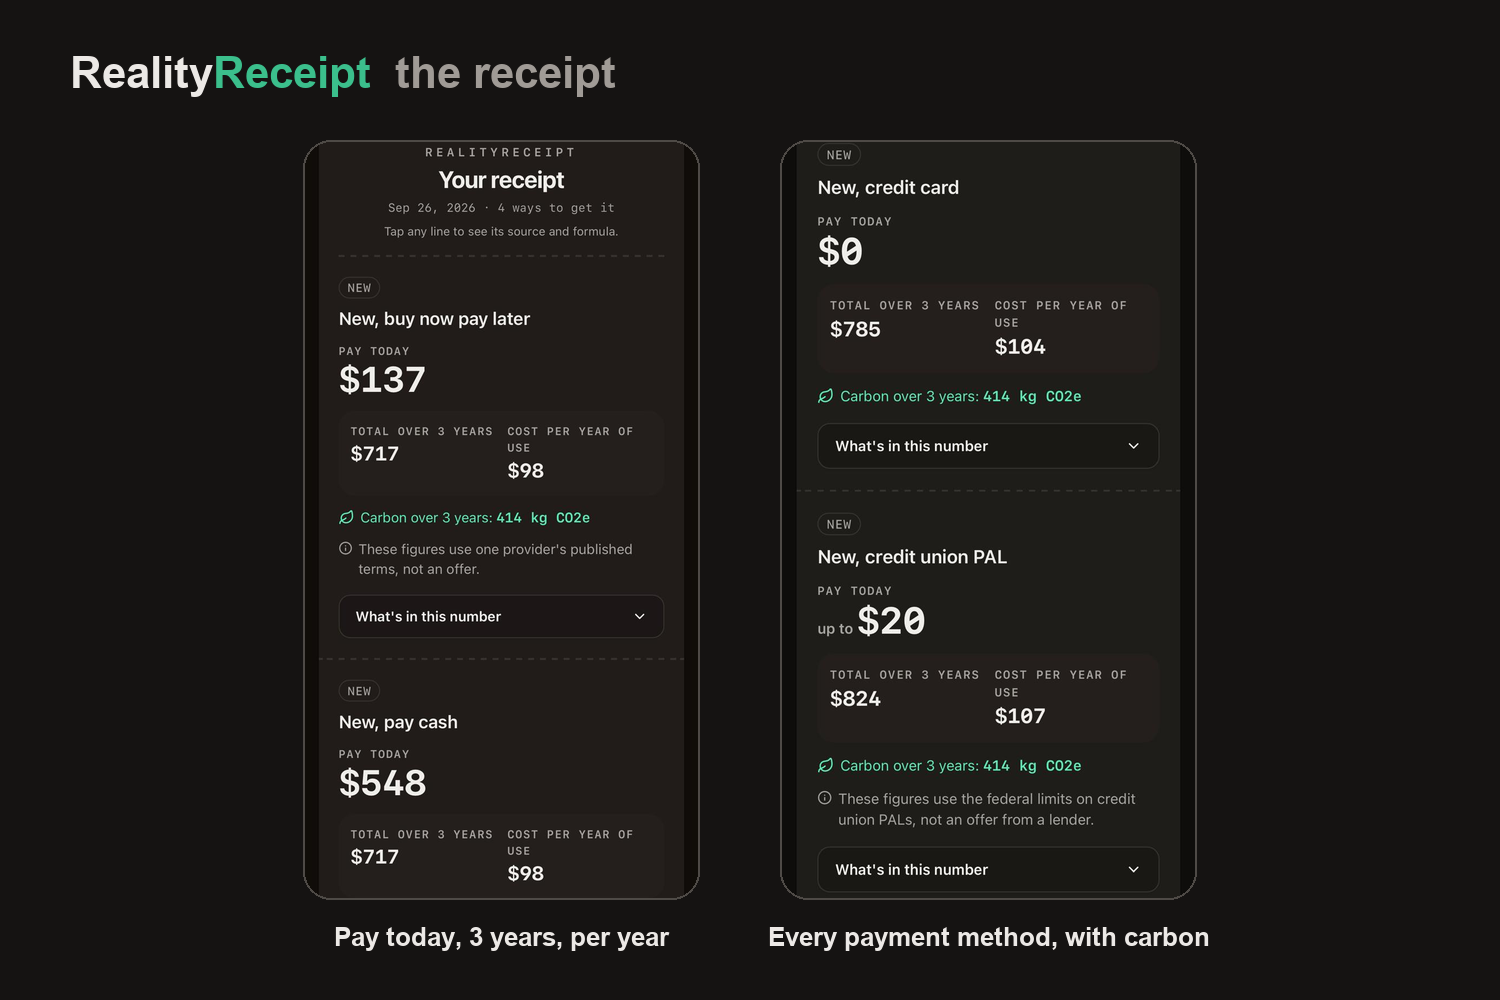
Each option shows pay today, the 3-year total and cost per year, plus carbon. PAL figures are federal limits, not an offer.
-
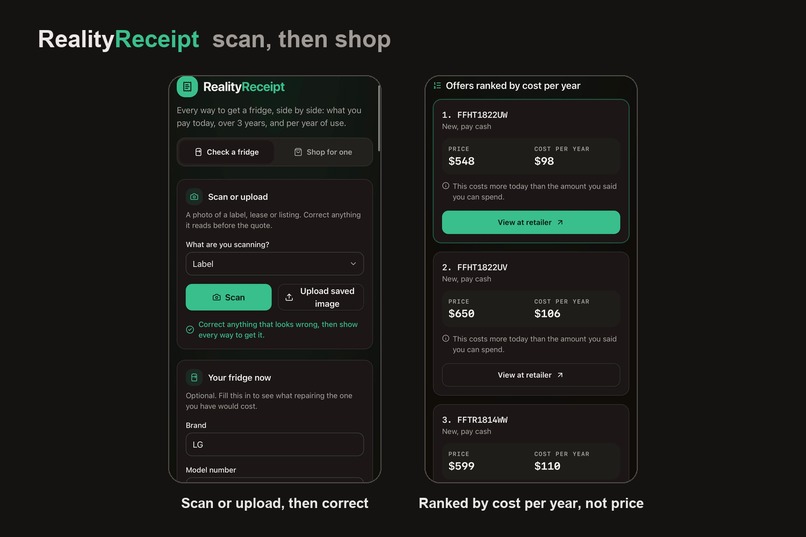
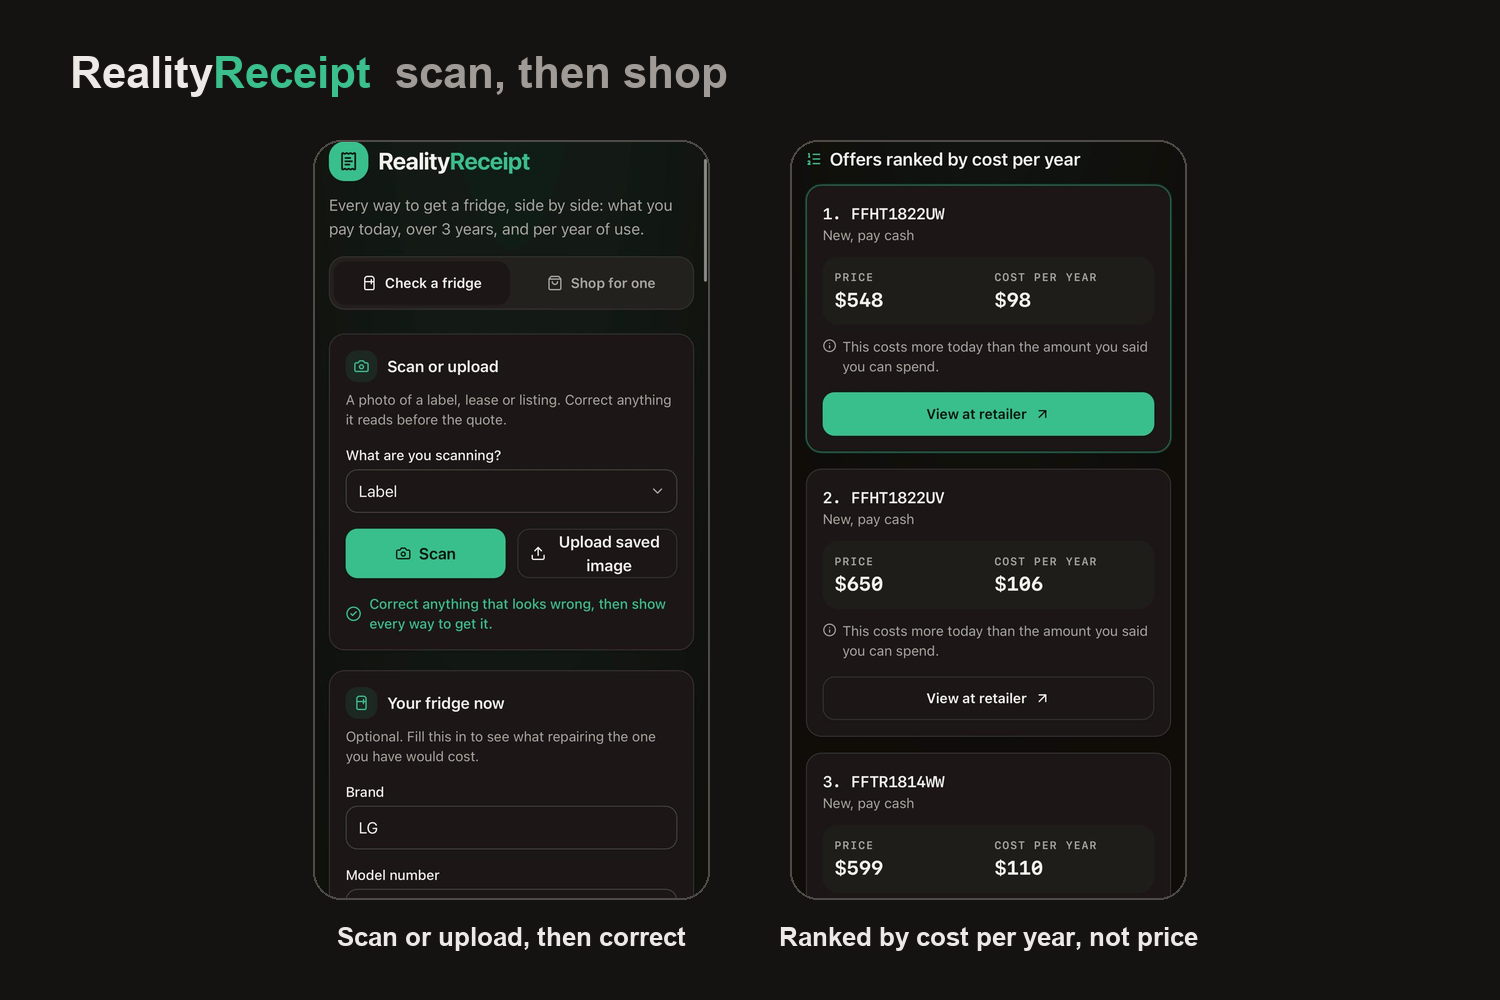
Grok reads a label, lease or listing photo; you correct it before the quote. Shop ranks listings by cost per year, not price.
-
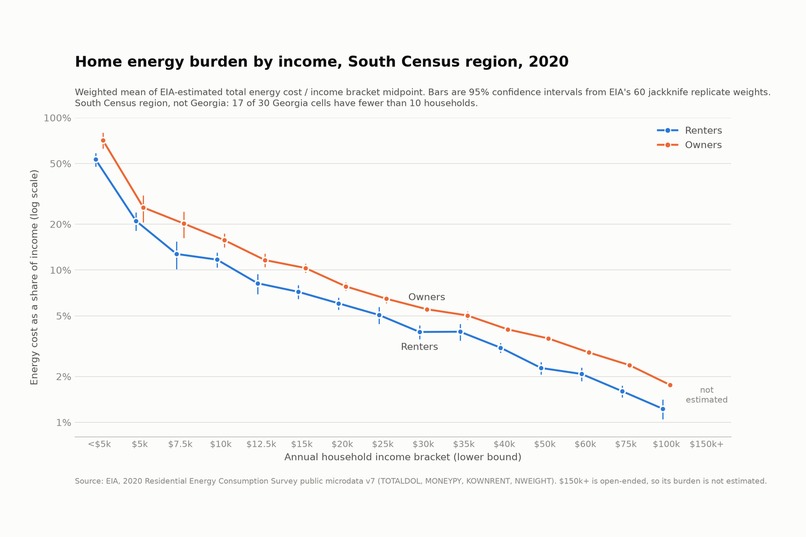
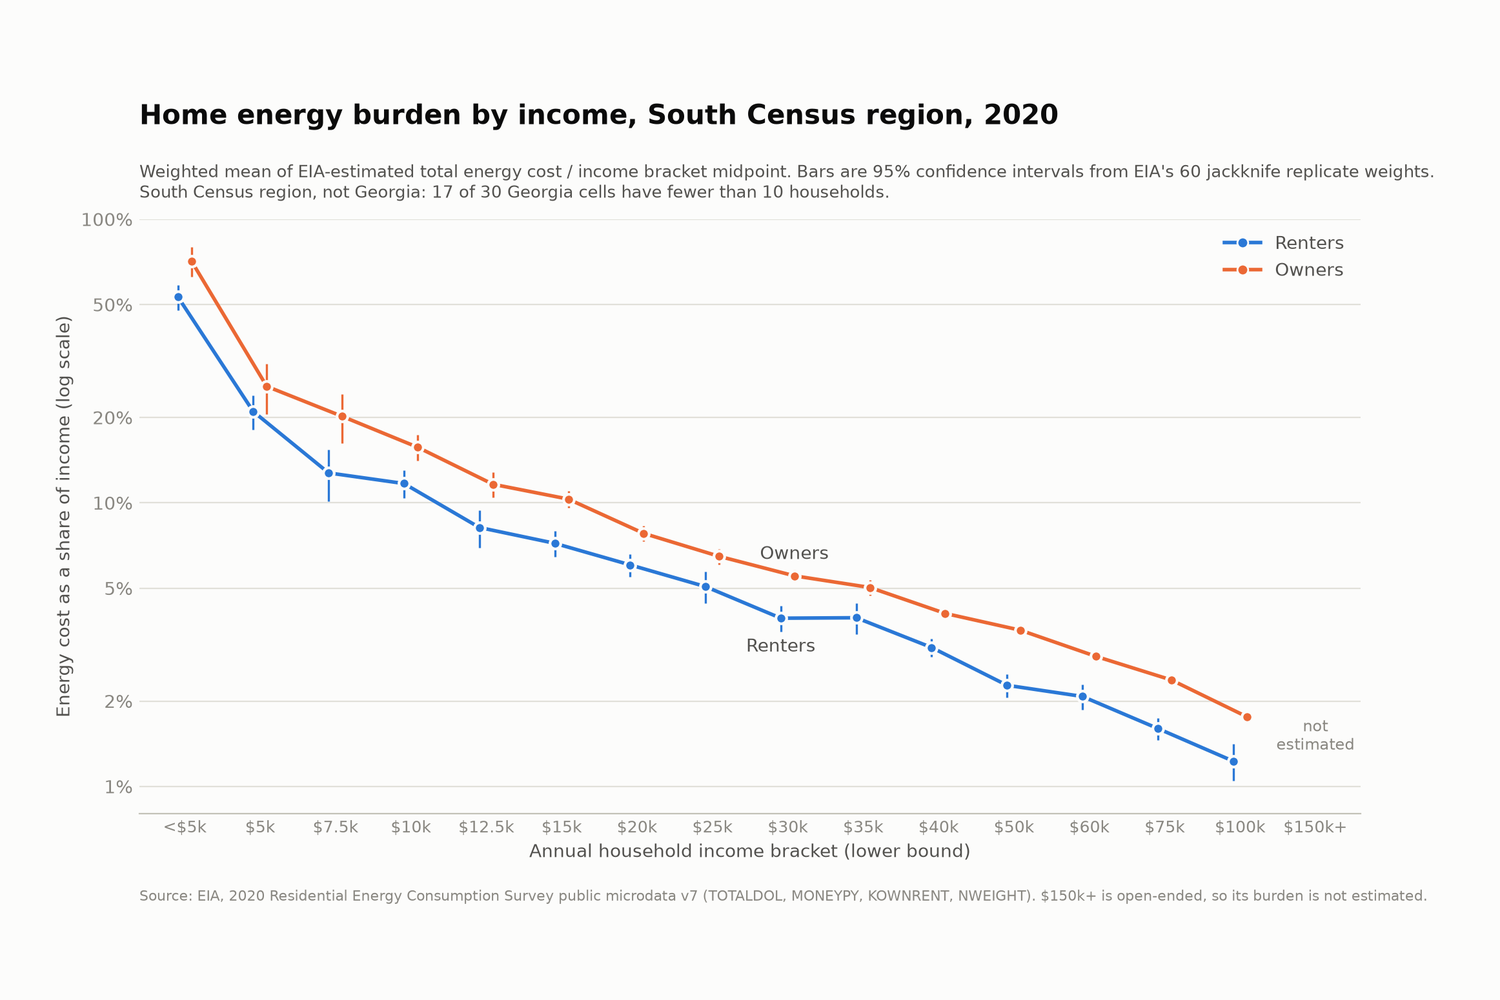
Our EIA 2020 analysis, South: households earning $20,000–24,999 spent 6.0–7.8% of income on home energy; $100,000–149,999: 1.2–1.8%.
Inspiration
Every August, Craigslist and Facebook Marketplace fill up with dorm appliances. Mini-fridges, microwaves, and window AC units get handed off in parking lots, usually to whoever offers the lowest price. Buyers may not know how old they are, how much power they draw, or whether they will make it to spring.
Off campus, the stakes are higher. When a family's refrigerator dies, they usually need a replacement within days, and the choice comes down to the numbers in front of them: $175 used, $548 new, or $33.48 a week.
Those prices don't measure the same thing. An older appliance can cost more to run, a weekly rent-to-own payment can add up to far more than the cash price, and a new model can be cheaper over the years you own it.
We wanted to answer one question: what will this actually cost to own?
What it does
RealityReceipt is a mobile web app that shows the estimated cost of owning an appliance before you buy it. The current version supports full-size refrigerators only.
Scan an energy label, a used listing, or a rent-to-own offer, or type the details yourself. Fix anything the scan got wrong, then get a receipt showing what you pay today, the total over three years, the cost per year of use, and estimated carbon emissions.
The receipt compares keeping or repairing what you have, buying used, refurbished, or new (with cash, a credit card, buy now pay later, or a credit union loan), and rent-to-own. Shop mode turns a plain-words request into editable filters and ranks offers by cost per year instead of sticker price.
How we built it
We used AI only where the input is messy. Grok from xAI, which we worked with in Cursor, reads photos of labels, listings, and leases into structured fields and turns shopping requests into filters. It copies what's printed and never calculates a cost.
A Python FastAPI backend computes everything else with fixed formulas and cited data: ENERGY STAR and DOE ratings, Georgia Power rates, EPA emissions data, and Federal Reserve and NCUA lending figures. Every line on the receipt can be tapped to show its formula and source. The frontend uses React and Vite. Our tests replay recorded Grok responses and check that a scanned entry and a typed entry produce the same receipt.
Challenges we ran into
Getting clean data out of real documents was harder than the math. Rent-to-own offers list payments, totals, cash prices, and fees in different combinations, and most used listings don't say how old the appliance is.
Scans can misread a digit, so when one fails validation we keep the fields that passed and ask the user to fix the rest. We also caught missing values quietly becoming $0, which made incomplete options look cheaper. Now "unknown," "not estimated," and "zero" are three different states, and the receipt flags any comparison with missing costs.
Accomplishments that we're proud of
One demo lease advertises $33.48 a week. Its total of payments is $1,739.88, which is $542.89 more than its own $1,196.99 cash price. The same fridge shows up in our recorded Best Buy listings at $699.99 new, so the lease costs about two and a half times the retail price. We report an effective annual cost to make the payment comparison clear:
$$\text{Effective annual cost} = \frac{1{,}739.88 - 1{,}196.99}{1{,}196.99} \div \frac{52 \text{ weeks}}{52 \text{ weeks/year}} \approx 45\%$$
What we learned
AI was most useful for reading messy input, not for making financial decisions.
Our analysis of EIA's 2020 household energy survey microdata shows why running costs matter. In the South, households earning $20,000–$24,999 spent 6.0% (renters) and 7.8% (owners) of their income on home energy, against 1.2% (renters) and 1.8% (owners) at $100,000–$149,999. These are household-weighted estimates with 95% confidence intervals.
What's next for RealityReceipt
Next come washers, dryers, window AC units, and water heaters, then bigger purchases like cars and HVAC systems, each with its own reliable data.
The goal is simple: show people the estimated ownership costs of an appliance before they buy it.
Built With
- cloudflare
- fastapi
- framermotion
- grok
- lucide-react
- pydantic
- pytest
- python
- radix-ui
- react
- shadcn-ui
- sqlite
- tailwindcss
- typescript
- vite
- vitest
- xai

Log in or sign up for Devpost to join the conversation.