Inspiration
Every day we are flooded with headlines, trending topics, and social media narratives telling us what we should be worried about. But I kept asking myself a simple question: how often do these narratives actually match reality?
I noticed that public attention spikes around topics like inflation, housing crashes, fuel prices, and crime - yet the underlying data often tells a more nuanced or even contradictory story. This disconnect inspired me to build Reality Gap: a data-driven system that measures how far public perception diverges from real-world outcomes.
My goal was to turn abstract “media hype” into something measurable, visual, and explorable.
What it does
Reality Gap is an interactive analytics application that compares public narrative signals with ground-truth economic and social indicators.
Users can explore multiple real-world topics including:
- Inflation
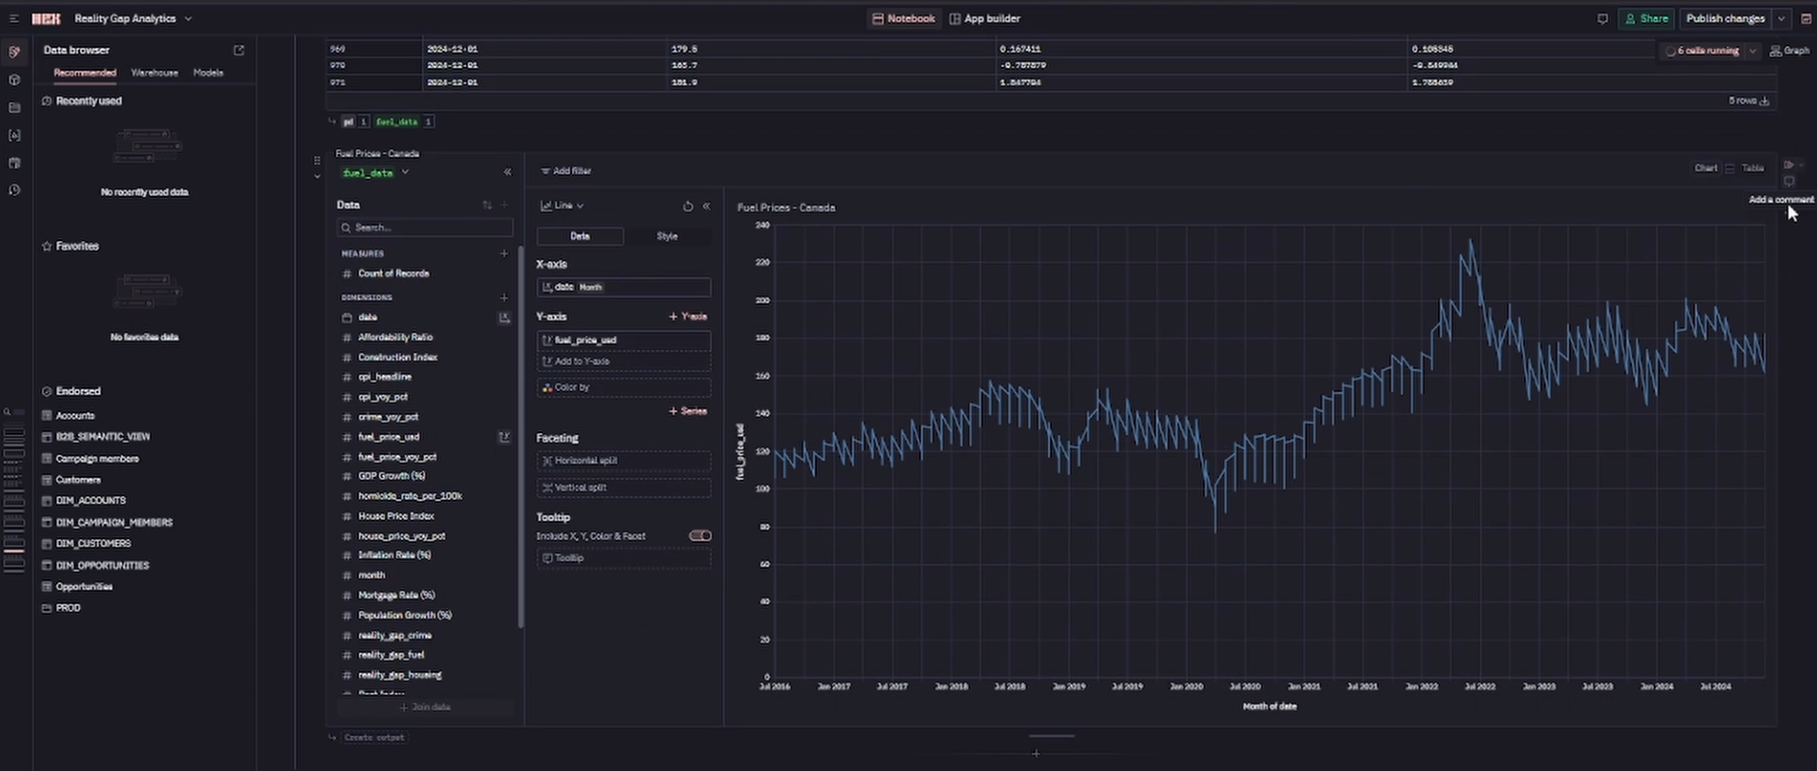
- Global fuel prices
- Housing markets
- Crime rates
For each topic, Reality Gap:
- Aligns media attention and public interest signals with official datasets over time
- Normalizes values onto comparable scales
- Calculates a Reality Gap Score that quantifies divergence between perception and reality
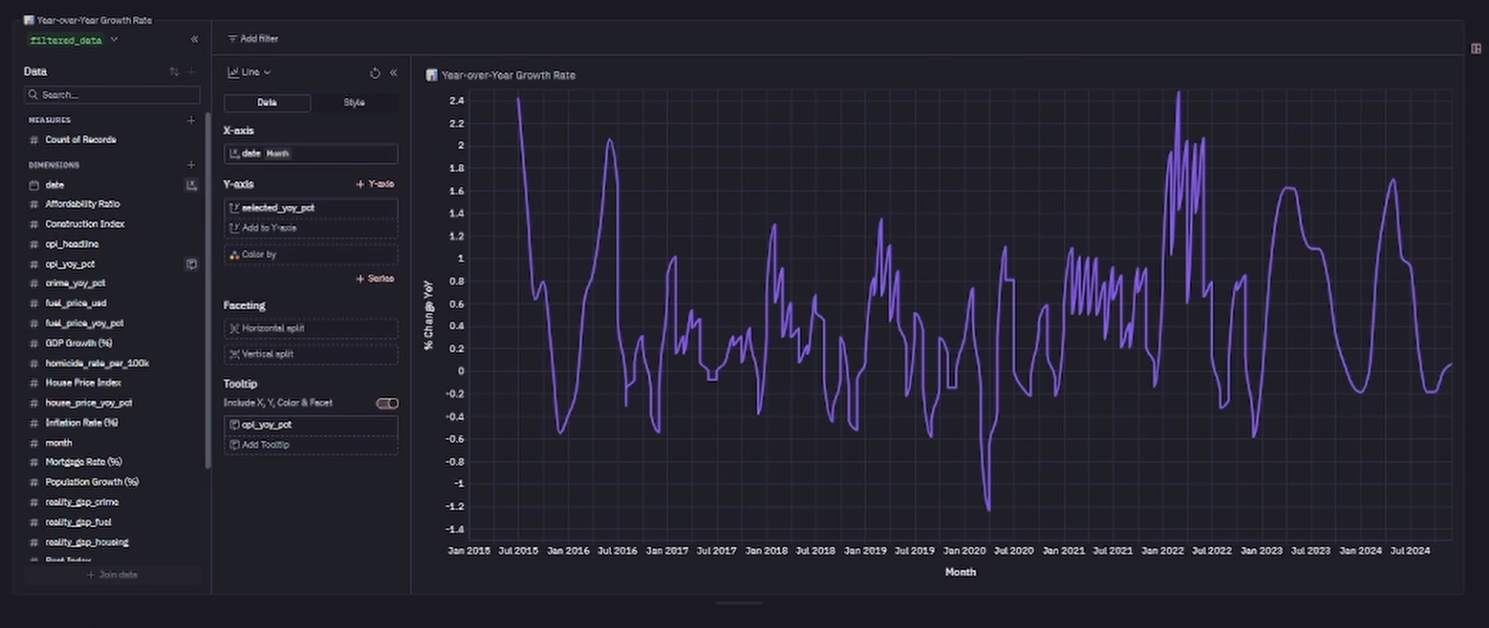
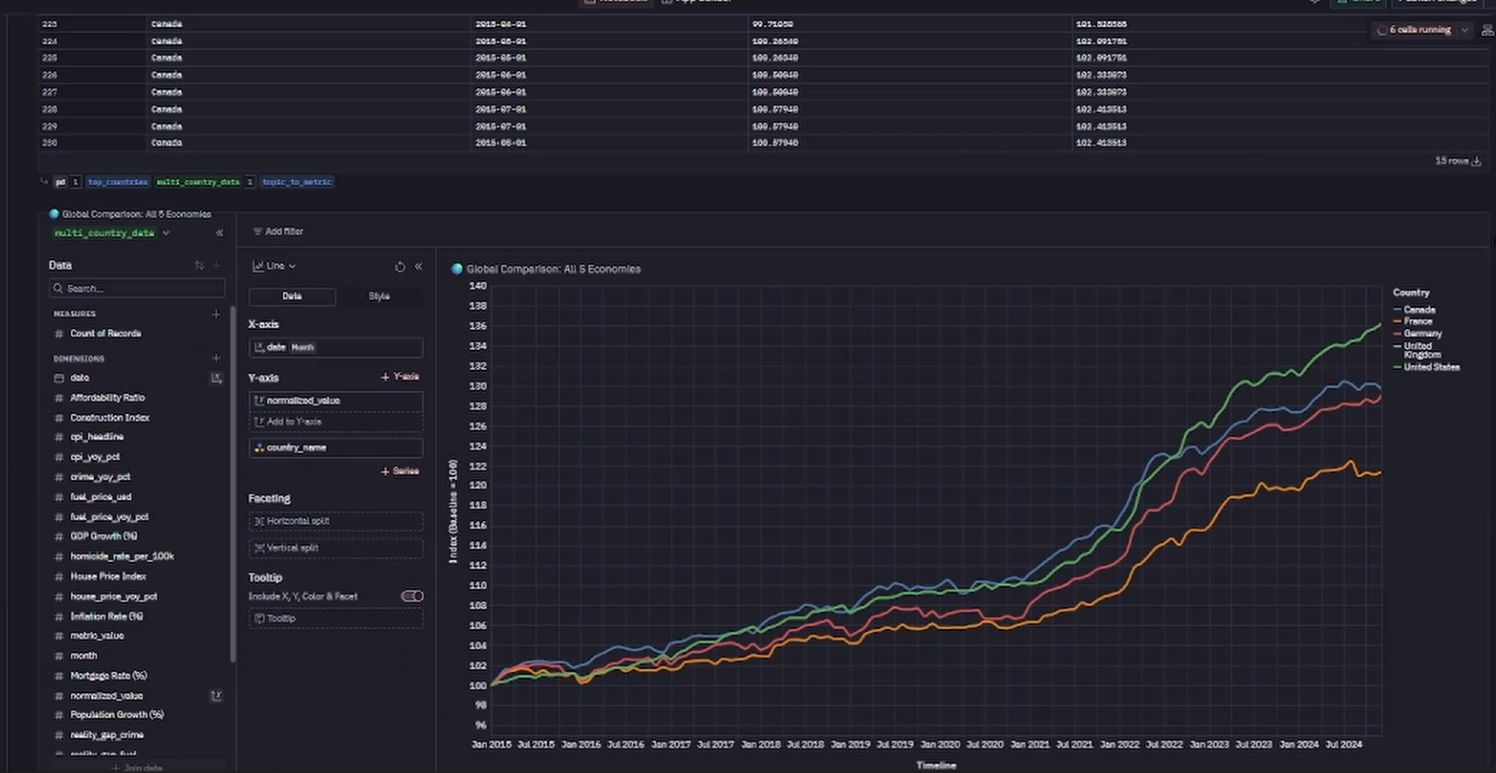
- Visualizes trends using interactive timelines, geographic maps, and comparative dashboards
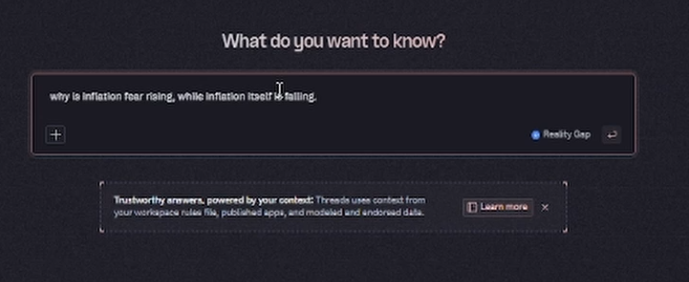
- Allows users to ask natural language questions using Hex’s AI assistant to generate explanations and insights
The result is a single workspace where users can visually and conversationally explore how narratives evolve compared to actual data.
How I built it
I built Reality Gap entirely using Hex as the unified analytics platform.
Data Layer
I integrated multiple publicly available datasets including:
- Inflation and CPI data
- Global fuel price databases
- Housing market indicators
- Crime rate datasets
- Public interest signals from Google Trends and timeline datasets
- Geographic mapping data for regional analysis
All datasets were standardized and cleaned to ensure consistent time and location dimensions.
Analytics Layer
Inside Hex notebooks I:
- Normalized narrative and reality metrics
- Created transformation pipelines to align time series
- Engineered a Reality Gap metric defined as the normalized difference between public attention indicators and real-world outcome indicators
This produced a unified analytical table optimized for downstream visualization and AI exploration.
Application Layer
Using Hex’s app builder features I created:
- Interactive topic selectors
- Dual timeline visualizations
- Reality Gap score indicators
- Geographic exploration views
- AI-powered Threads for natural language exploration and explanation
This allowed the project to move beyond static dashboards into a fully interactive data experience.
Challenges I ran into
One of the biggest challenges was aligning very different types of data.
Narrative signals such as search interest and trending topics behave very differently than structured economic indicators. Normalizing scales, aligning time resolutions, and handling missing values required careful preprocessing and experimentation.
Another challenge was designing a metric that was both meaningful and explainable. The Reality Gap score needed to be simple enough for users to understand while still being statistically grounded.
Finally, balancing storytelling with technical depth was important. I wanted the project to be visually engaging without sacrificing analytical rigor.
Accomplishments that I'm proud of
- Designing and implementing a novel Reality Gap metric that makes perception vs reality measurable
- Successfully combining multiple unrelated datasets into a single interactive experience
- Building an end-to-end analytics application as a solo developer
- Leveraging Hex’s AI tools to enable conversational exploration of complex datasets
- Creating a project that blends data science, storytelling, and product thinking
Most importantly, I’m proud that Reality Gap doesn’t just present numbers - it helps users think critically about information they consume every day.
What I learned
This project taught me the power of unified analytics platforms like Hex.
Instead of juggling separate tools for notebooks, dashboards, and AI, I was able to build everything in one environment. I also learned how important semantic modeling and clean data pipelines are when building interactive applications on top of analytics.
On a broader level, I learned how easily narratives can diverge from measurable outcomes — and how valuable it is to make that gap visible.
What's next for Reality Gap Hackathon
If I continue developing Reality Gap, I plan to:
- Add real-time API integrations for live narrative signals
- Expand topic coverage to include climate data, labor markets, and technology adoption
- Introduce user-defined custom topics
- Improve the Reality Gap metric using weighted sentiment analysis and anomaly detection
- Package the platform as a public-facing data product for journalists, researchers, and policy analysts
Long-term, I envision Reality Gap becoming a transparency tool that helps people navigate the information economy with data instead of noise.
Original Data Sources
Built With
- hex

Log in or sign up for Devpost to join the conversation.