-
-

Closing price and moving average plotted using matplotlib
-
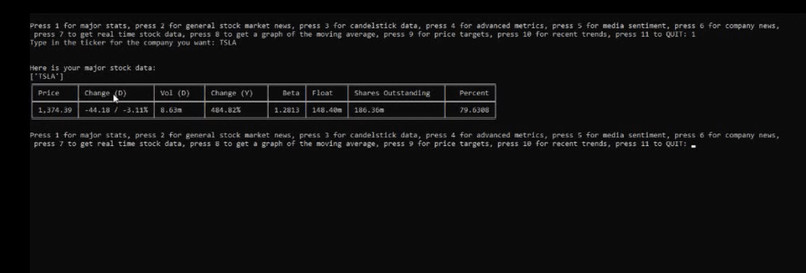
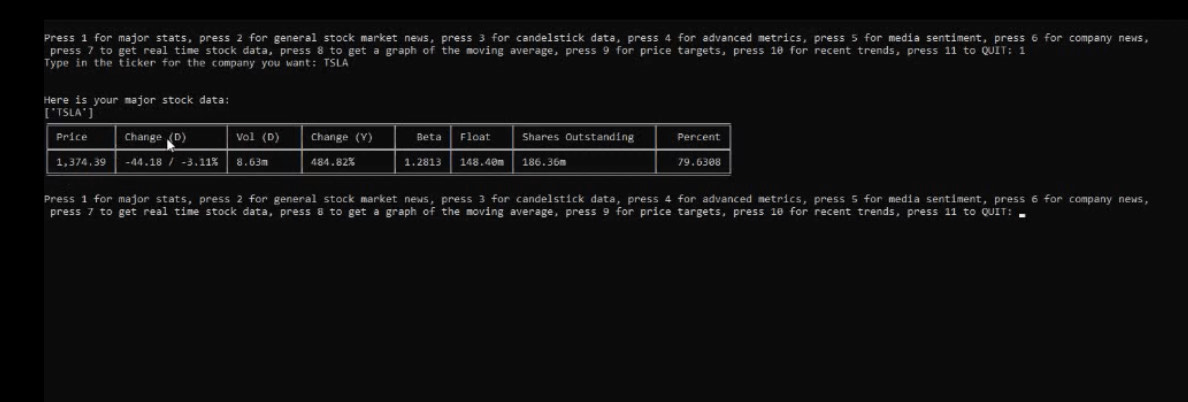
Major statistics web-scraped and put into a table using Beautiful Soup and tabulate.
-
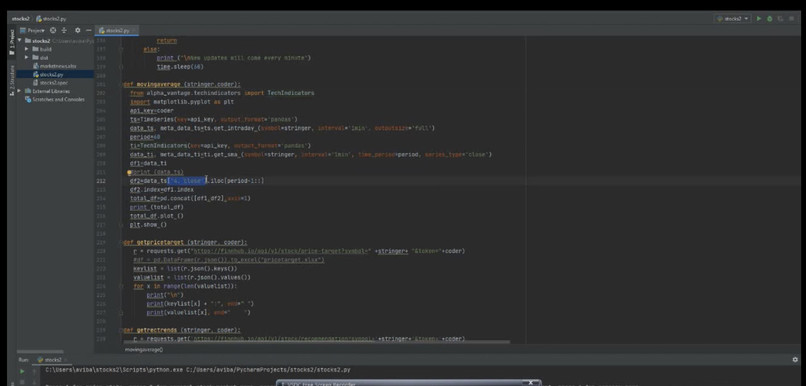
Beginning part of our Python code in PyCharm.
-
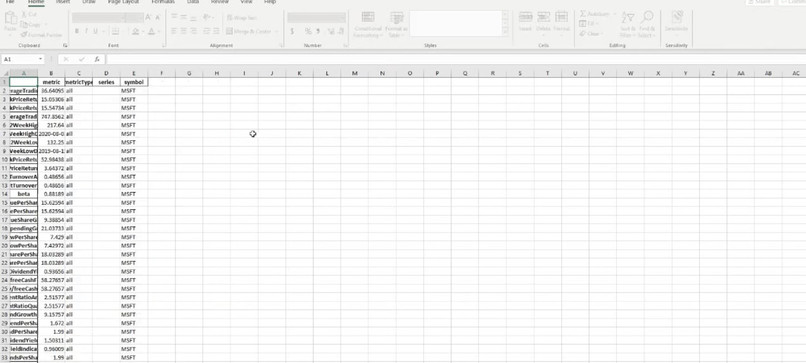
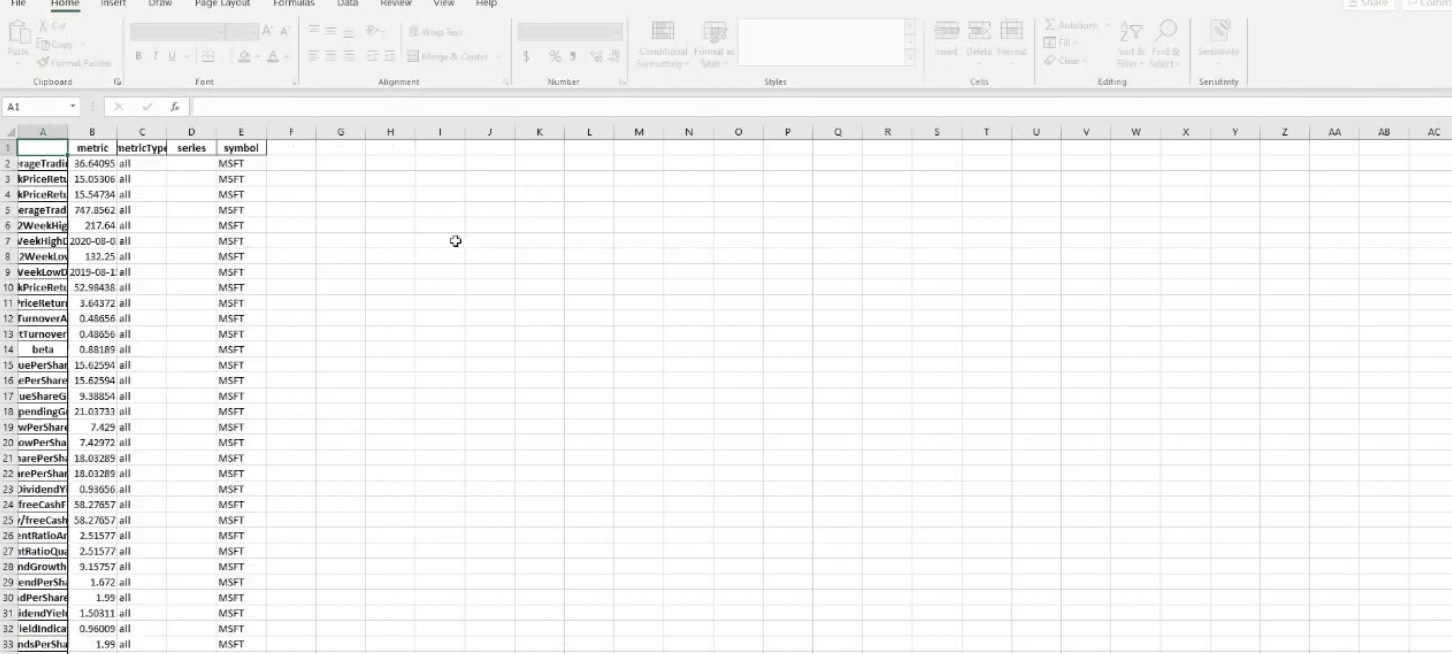
Excel spreadsheet generated in downloads folder.


Inspiration
Before AlbanyHacks 2020, I had been studying and writing a research paper on the South Sea Bubble. This event was an example of widespread market manipulation and government interference in the market. After finishing that project, I learned that stock market manipulation especially widespread right now. Since many large companies are going out of business due to the pandemic, many are manipulating the market so that the shares of these companies are being valued at a higher price than their true value. This in turn creates an economic bubble. During a time where young and inexperienced investors are active more than ever in the stock market, it is important to get important information about stocks quickly. This inspired us to make our real time stock market tracker in Python. Also, we both had been involved in making an app that compares grocery store prices. This got us interested in web-scraping.
What it does
Our program is split up into 10 sections with each section providing the user with useful information they will need to know to invest intelligently and avoid investment in dangerous or manipulated stocks.
We provide the user with major statistics: price, float, daily and yearly change, shares outstanding, volume etc. Many other services do not provide the float as a major statistic, but it is a very important metric that is used to detect if the stock is being manipulated. This data is web scraped off of Financial Times and it is formatted into a nice table.
We then provide the user with the news for the day regarding the stock market. An excel spreadsheet is downloaded for the user to make the news more readable.
The user is then provided with candlestick metrics: opening, closing, high, and low price. An excel spreadsheet is downloaded for the user to make the data more readable.
Advanced metrics are then provided. These include hundreds of different metrics and the purpose of showing all of them is so that a trader can search for the metric that is most relevant to their purposes. An excel spreadsheet is downloaded for the user to make the data more readable.
The media sentiment is then recorded. This determines whether or not the company has been in the news recently. This information is extremely important to detect economic bubbles. If there is a overwhelming craze to invest in a certain stock, the share price of that company is usually inflated to levels it cannot sustain. If a stock is abnormally popular one day, investors should proceed with caution.
News about the specific company is given which is important for the same reasons state above. An excel spreadsheet is downloaded for the user to make the data more readable.
Real time stock data is provided for the user. The price updates every 60 seconds and the user receives an email every time the change in the share price exceeds 4%.
The closing price is outputted in a table alongside the moving average. For easier viewing, the data is exported into a graph. If the closing price is far below the moving average, an investor should buy. If it significantly exceeds the moving average, an investor should sell. Providing this data in real time is very important for traders to avoid making costly decisions.
Price predictions for the stock is provided. Target high, low, mean, and median are provided.
Recent trends are provided to inform the user when to sell, buy, or hold. An excel spreadsheet is downloaded for the user to make the data more readable.
How we built it
***note: full explanations are in the video
To get major statistics we used BeautifulSoup to web scrape data off of the Financial Times website. This is done by opening the URL using urllib, reading the web page, and compiling that information into a "soup." Specific classes from the html code are extracted to get the data of interest. This data was compiled into a nice table using tabulate. Data from steps 2, 3, 4, 5, 6, 9, and 10 above were extracted from the finnhub API using requests. This data was converted from a json format to an excel spreadsheet and a readable format in the output. Steps 7 and 8 used the Alpha-Vantage API to access real time stock data. Emails were sent using smtlib. The graph was produced using matplotlib. Our program was exported into a .exe file. More details are provided in the video.
Challenges we ran into
We did not know how to work with json at first, so we struggled figuring out how to extract certain information and converting it into an excel spreadsheet. Tracking stocks in real time and producing the graph using matplotlib was also a challenge. It was also originally difficult to find websites we could web scrape.
Accomplishments that we're proud of
We are proud of the real time aspect of our project because this could actually be useful for traders. We were also able to build a fairly large project in a short period of time. Coming from java, we only had intermediate python skills. We were able to overcome figuring out what certain error messages meant and different formatting issues. Our python skills drastically improved after this project since we had little experience with most of the libraries we used in our project.
What we learned
Our web-scraping skills improved and we learned how to use APIs to extract information. We learned how to apply the knowledge we attained from computer science in school to the real world. We also learned a lot about trading and what different statistical measures meant.
What's next for Real Time Stock Tracker
We are planning to make a website that tracks stock prices that more specifically warns investors about potential stock market manipulation and economic bubbles. We want to develop a mathematical model that tracks bubbles in order to do this. We plan to continue with python.
Built With
- alpha-vantage
- beautiful-soup
- finnhub
- json
- matplotlib
- pandas
- python
- requests
- techindicators
- time


Log in or sign up for Devpost to join the conversation.