-
-

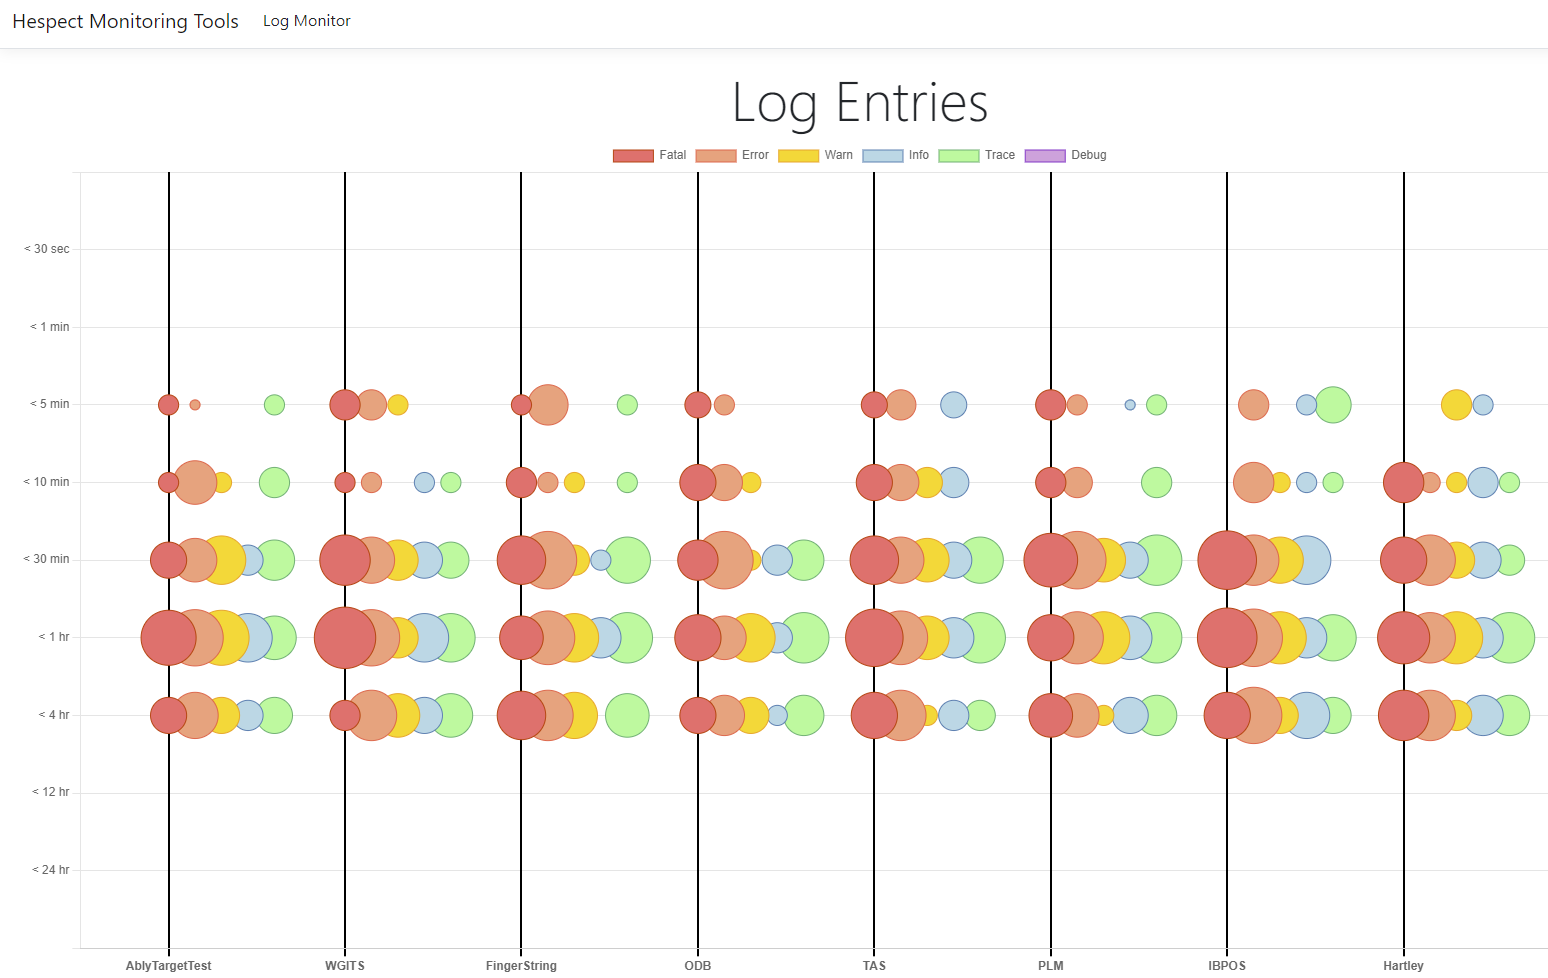
A snapshot of a very busy day's log events
Inspiration
Supporting several production systems for my clients is time consuming and tedious. Usually, I can only react to reports from the users when there is a problem, and then have to dig through large log files/tables to identify and fix the issues.
What it does
In my consulting business I have built many systems for my clients, and I use similar tools from system to system as much as possible. One of those tools is NLog ([https://nlog-project.org/]), a framework for logging system trace events and errors. I use NLog to save all log messages to a database table for each system, and then when users report an issue, I can query those tables to diagnose and fix the problem. However, I never have the time to review these enormous log files proactively. My hackathon entry consists of two parts: an extension to the popular NLog tool that streams log events to an Ably channel, and a real-time streaming visualization of those log events across all of the systems I support.
How we built it
First I had to write what is known as a "custom target" for NLog. A "target" is a destination for log events generated by a system. These events might be generated in response to system errors, or perhaps just checkpoints in an algorithm to monitor progress.
            catch (Exception ex)
            {
                NLog.LogError(ex, $"Unable to load the Create Case View. Error: {ex.Message}.");
            }
NLog already has many built-in and custom targets: SQL database, text file, and various online monitoring tools such as Azure Application Insights and Sentry.io [https://sentry.io/] . My custom target adds Ably to that portfolio of NLog extensions. A developer can simply include my Ably NLog target DLL in their project, and configure it to stream to their Ably channel(s) as needed.
<target xsi:type="Ably" name="ably" ApiKey="MqICiA...." AblyChannel="HespectMonitor"/>
Second, I wrote a live streaming javascript chart to consume the real-time Ably data from the channel. I chose to use a bubble chart design: the X axis represents the various systems I work on, the Y axis is a time-based logarithmic scale, the color of the bubble represents the severity level of the events, and the size of the bubble represents the number of incidents in each (system, time, severity) bucket. I use a chromebook to run the monitor in my office and can see problems within moments of them happening, often before my clients are even aware.
Challenges we ran into
The biggest challenge I had was how to represent the time scale in a non-linear fashion. I wanted the most recent events to be shown in granular detail, but older events could be grouped. I decided on a logarithmic scale: typically this would be a numeric scale where values from 1-10, 10-100, 100-1000, etc would each take up the same amount of space on a graph ([https://en.wikipedia.org/wiki/Logarithmic_scale]). I ended up grouping events into 9 buckets for: "within the last 30 seconds", "within the last 1 minute", 5 min, 10 min, 30 min, 1 hour, 4 hours, 12 hours and 24 hours. You will see events appear at the top of the chart, falling into lower buckets and the bubbles growing in size as time passes and events are aggregated.
Accomplishments that we're proud of
The bubble chart code required extensions and customizations to the chart.js base code - the logarithmic time axis, and real-time streaming data, buffering the Ably data to avoid re-fetching messages - it was all very challenging but in the end it has turned out almost exactly as I envisioned. The custom NLog target for Ably was also very rewarding and I am implementing it in all of my live production systems as part of regular maintenance schedules.
What we learned
I learned a lot about the inner workings of NLog, a tool that I have used for years without really diving deep into how it works. I think I will now be able to really improve how I use it in future systems. I also learned a lot about chart.js, a tool that I have used on a few systems, and now I know I'll be able to build standard, basic charts for my clients in much less time; and more interesting charts as well.
What's next for Real Time Log Monitor
After the hackathon, I'll be making my Ably target for NLog available on Github and in the NuGet ([https://www.nuget.org/] system where .Net developers can use it for free. I think I will also implement Ably push notifications for iOS so that my tool can notify me immediately for the most severe issues.


Log in or sign up for Devpost to join the conversation.