-
-
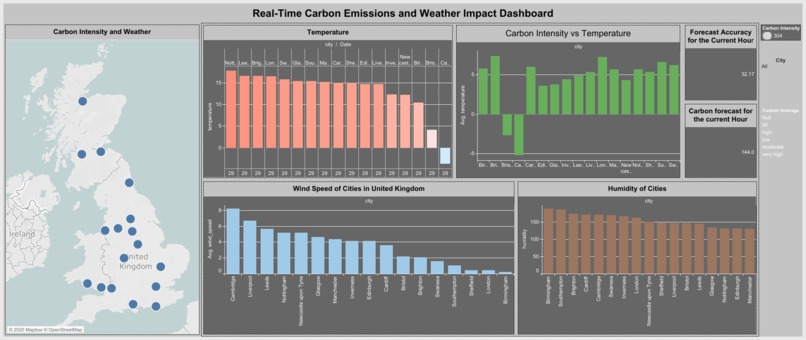
Real time Carbon Emissions and Weather Impact Dashboard
-
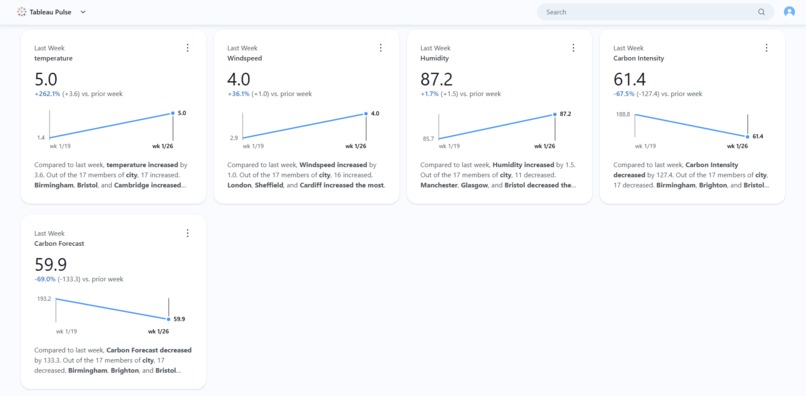
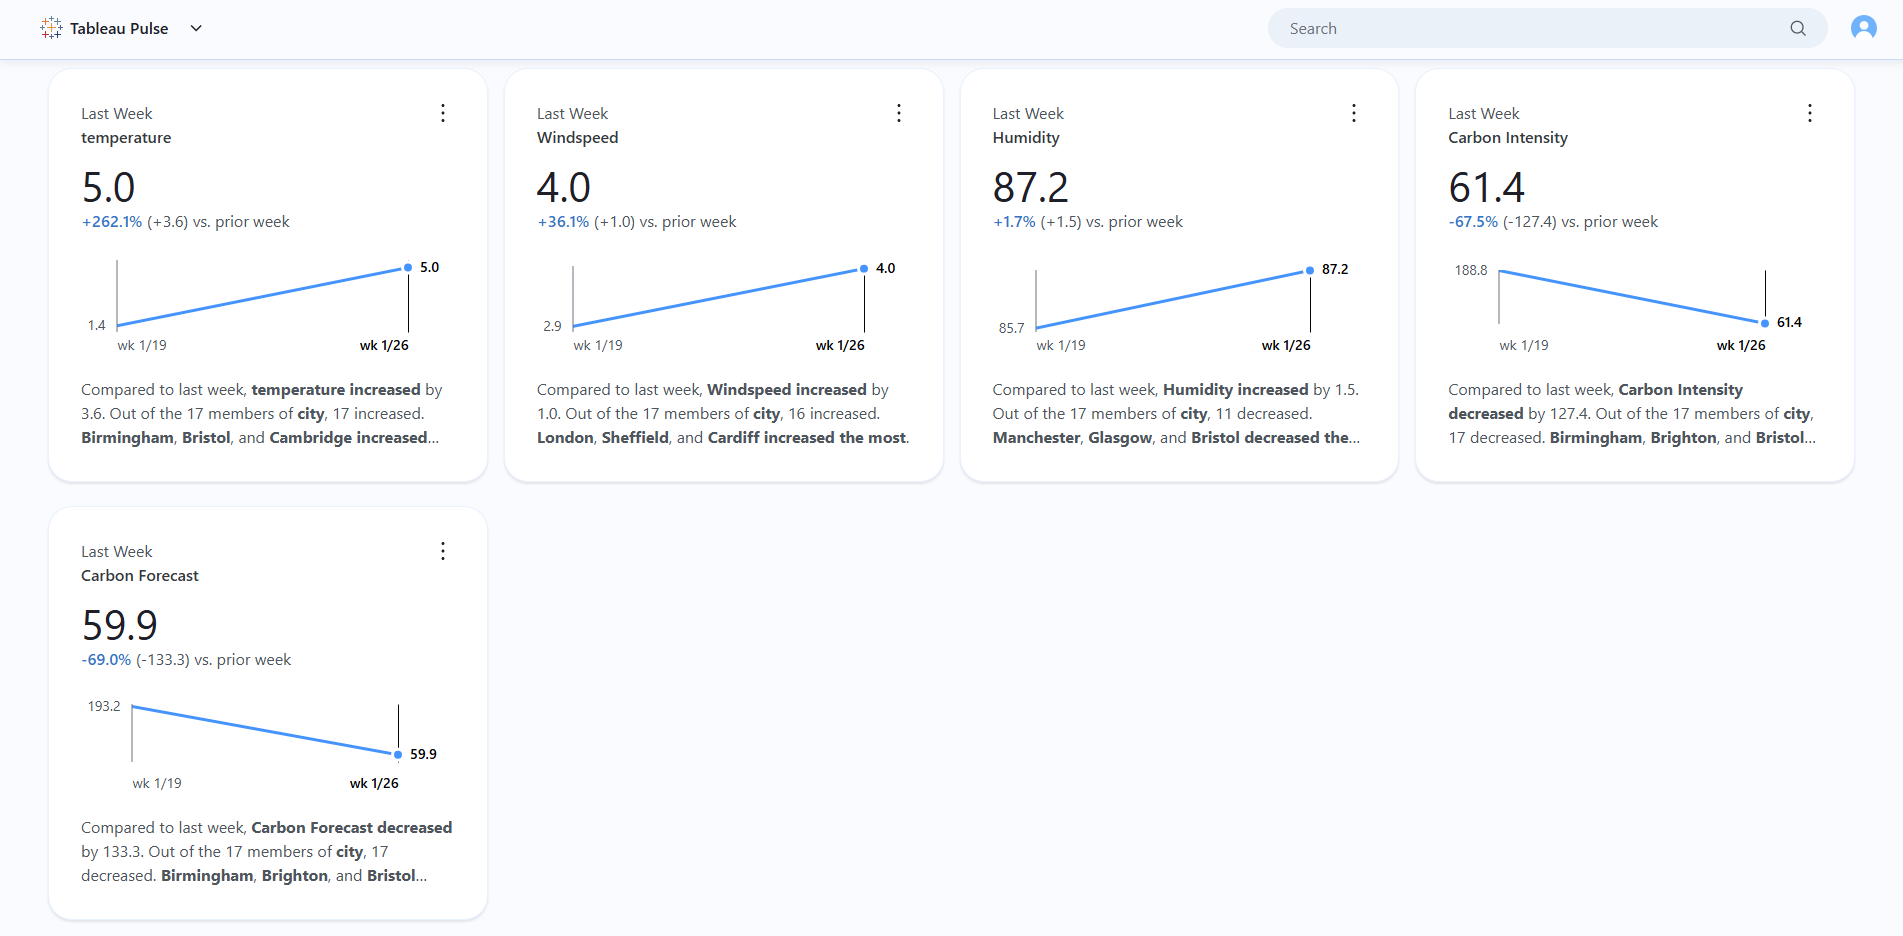
Tableau Pulse Analytics
-
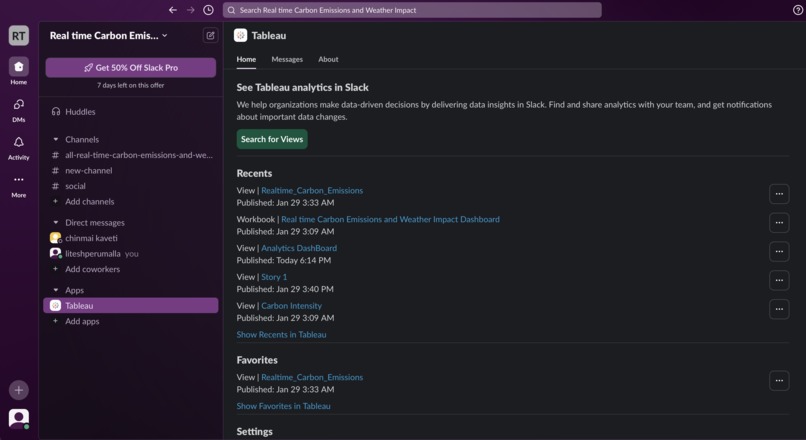
Slack Integration with Tableau Online for Summaries.
-
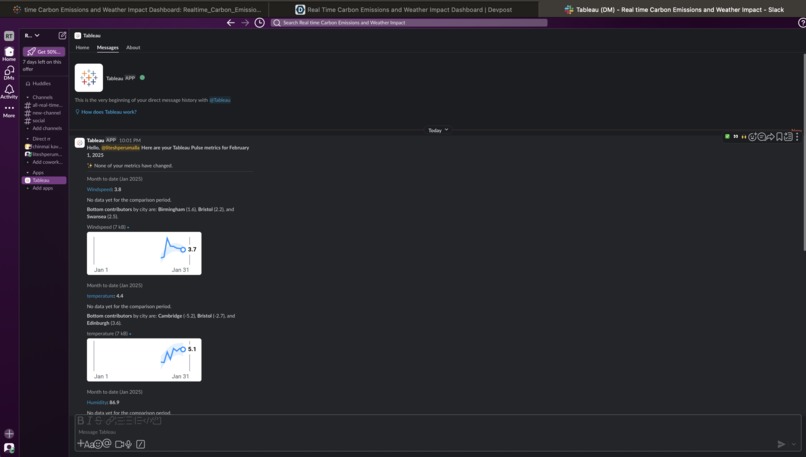
Generated Insights of Tableau Pulse in the Slack Workspace
-
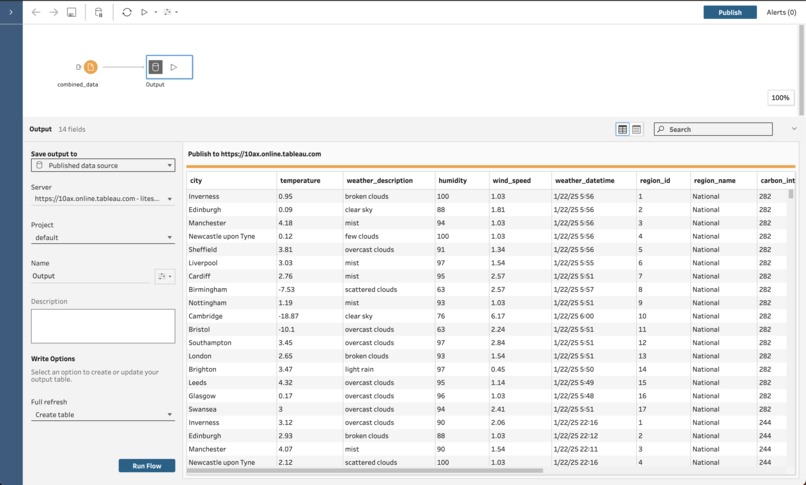
Tableau Prep for Running Flows.
-
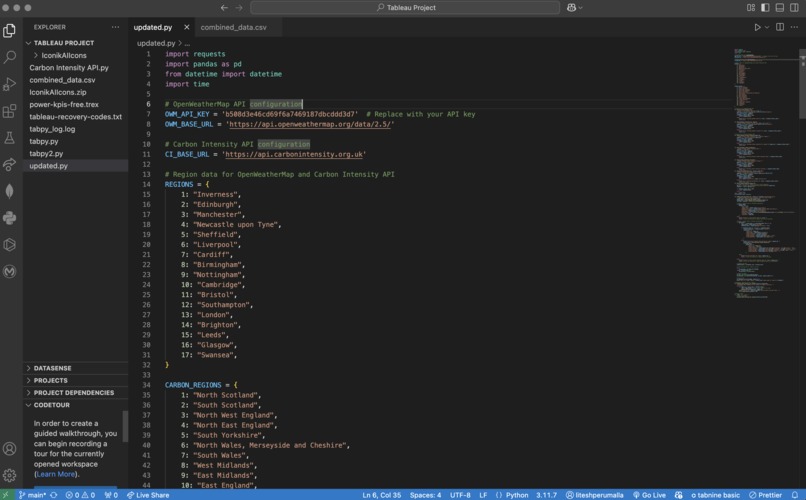
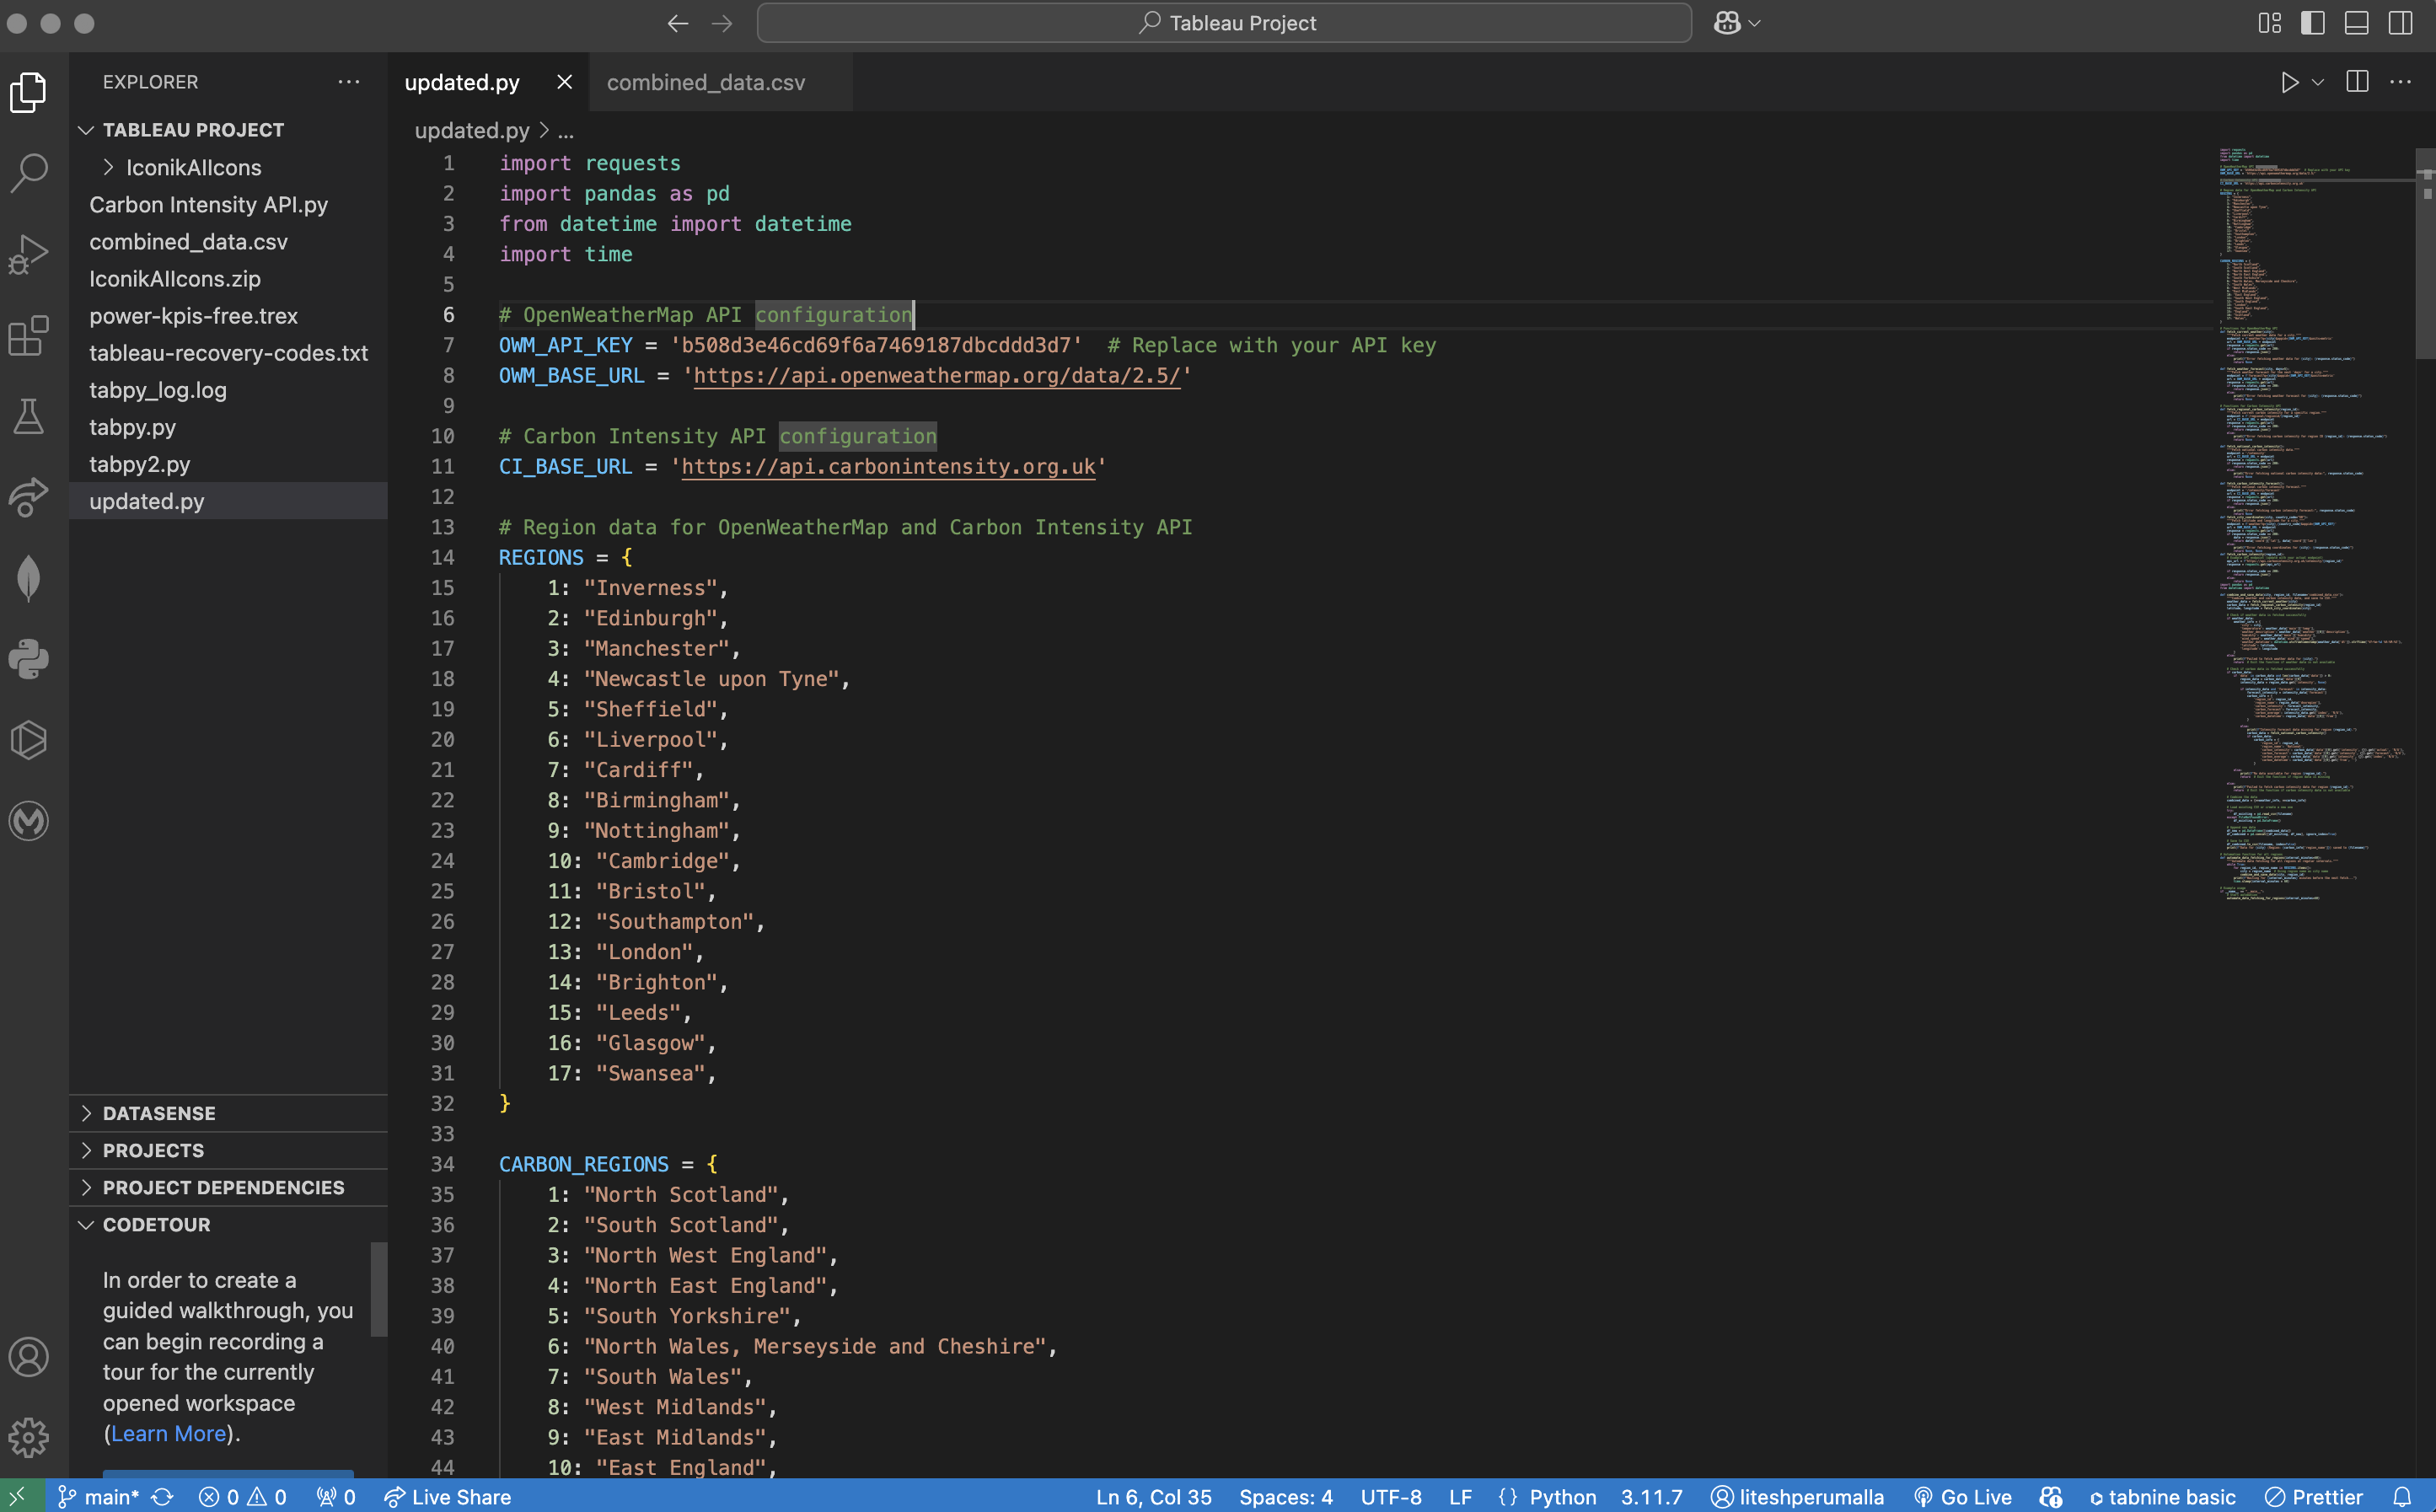
A python code to retrieve data from API's and combine and automate data with tableau.


Inspiration
Nowadays, I started noticing how weather is changing-warmer weather, unpredictable rain--and it made me wonder how carbon emissions were affecting it. So, using the data i created dashboard of real time carbon emissions and weather impact to help people understand how it affects the local weather. It is all about understand, act and protect...
What it does
The dashboard shows how carbon emissions affect the weather, with data that updates every 60 minutes. As emissions change, the visualizations also change, letting users see how wind, humidity, and weather patterns are being impacted in real-time. You can explore different regions, compare data, and even see predictions for how future emissions might influence the weather. It’s an easy way to understand how our actions are affecting the climate, with fresh data at all times.
How we built it
We built the dashboard using Python, Tableau, and Tableau Server. For the data, we used open APIs like the Weather API and Carbon Intensity API to get real-time information about weather and emissions. We cleaned and prepared the data using Tableau Prep to make sure everything was accurate. Then, we connected everything in Tableau and slack to create interactive visualizations and get insights regarding it. The dashboard updates every 60 minutes to show the latest data, making it easy to track changes in carbon emissions and their impact on the weather.
Challenges we ran into
We faced several challenges while building the dashboard. First, connecting and retrieving data from different APIs, like the Weather API and Carbon Intensity API, was tricky because each had its own format and requirements. Combining and storing data from these different sources was also difficult, as we had to make sure everything aligned properly. Integrating this data with Tableau and slack took extra effort to ensure the visualizations and get insights smoothly. Lastly, scheduling the data updates every 60 minutes and setting up automations for the entire process required a lot of fine-tuning to make sure the system ran automatically without errors.
Accomplishments that we're proud of
We’re really proud of how the dashboard turned out. It’s dynamic, with data updating every 60 minutes, giving users real-time insights into how carbon emissions impact the weather. We successfully connected multiple APIs, cleaned and combined the data, and integrated everything seamlessly into Tableau. The dashboard is easy to use and helps people better understand the relationship between emissions and climate change. It’s a step toward making complex environmental data more accessible and actionable.
What we learned
From this project, we learned a lot about connecting and retrieving data from different APIs, cleaning and combining it, and making sure everything works smoothly together. We also learned how to integrate this data with Tableau and automate the updates every 60 minutes. The process taught us the importance of making complex data easy to understand and how powerful real-time visualizations can be in showing the impact of carbon emissions on the weather. It was a great experience in problem-solving and building a useful tool for understanding climate change.
What's next for Real Time Carbon Emissions and Weather Impact Dashboard
Next, we want to improve the dashboard by adding more data, like air quality and renewable energy use, to give a better view of environmental impact. We also plan to make the weather predictions more accurate and add features that let users explore data in more personalized ways. Our goal is to make the dashboard accessible to more people, like schools, businesses, and policymakers, to help everyone make better decisions for the environment.

Log in or sign up for Devpost to join the conversation.