-
-

Architecture
-

Example of Alert
-

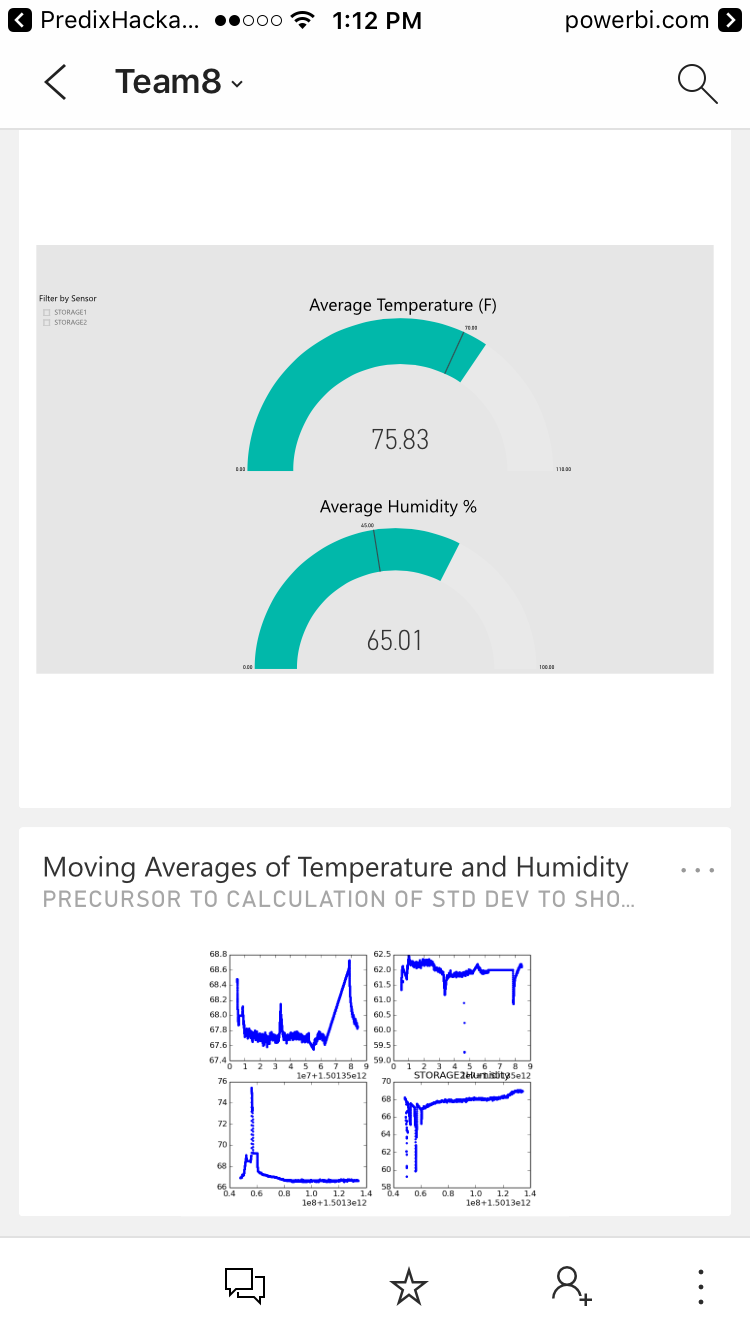
iPhone App
-

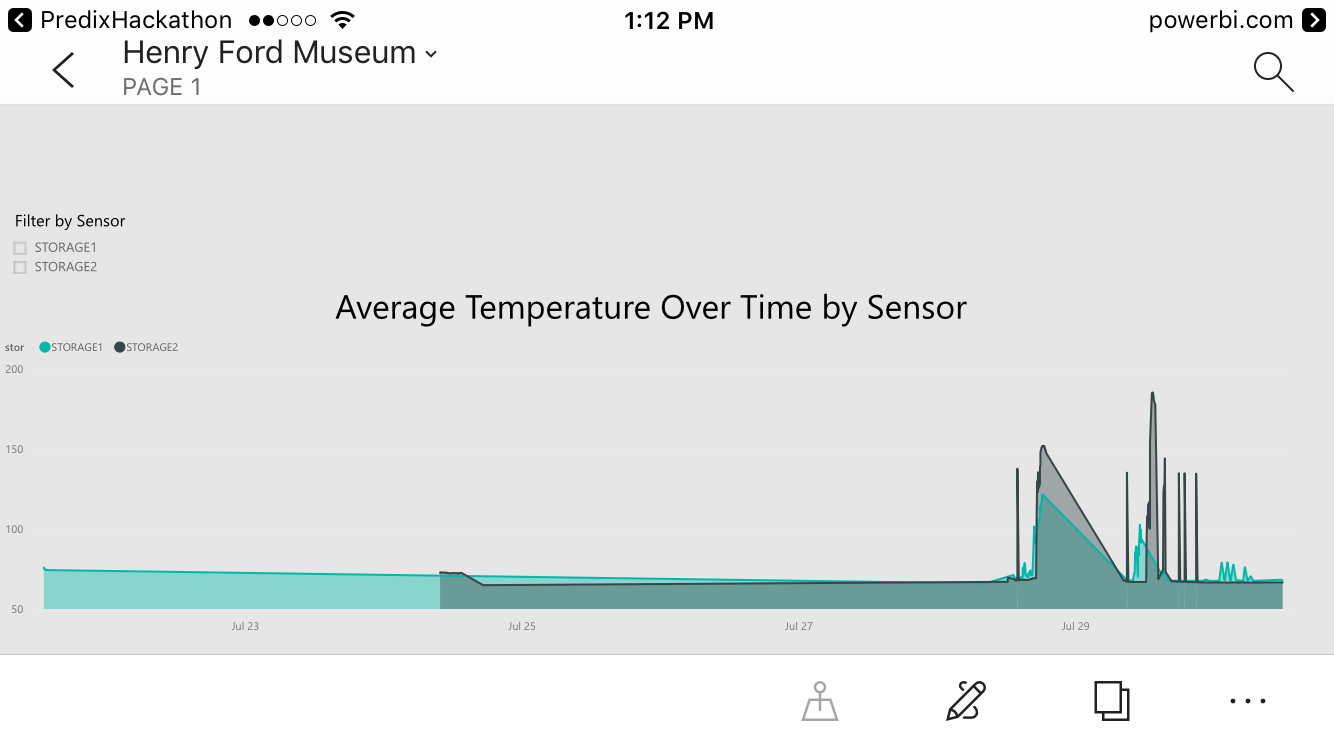
Dashboard
-

Dashboard
-

Dashboard
-

Dashboard
-

Dashboard
-

Individual Artifact Monitors
-

Diagram of the red flow on Bluemix
-

Diagram of the red flow on Bluemix


Inspiration
Our past guides our future. By optimally preserving our historical artifacts, we propel our culture forward. It is a gift to our descendants. For this noble purpose, this app helps a little.
GitHub
Here are our artifacts
How it Works
The best part of this app is that you can set it and forget it. It wakes you up when there is a problem.
There are two systems for monitoring conditions. The first system monitors storage areas. This system collects temperature and humidity data using local sensors that transmit and store in the Predix cloud.
The second system uses TI Sensor tags, which collect ambient temperature, humidity, pressure, and object temperature. The TI Sensor Tag uses an IR sensor to determine the surface temperature of the object that it is pointed at.
Other sensors could be incorporated into either system.
After set up, you forget about it. The system alerts you automatically by text message when conditions are not within the optimal range. The text message links to an iPhone app that shows the instant conditions. If more details are desired, the app displays current and historical conditions, including monitoring of individual artifacts.
Finally, the system is capable of determining the stability of conditions by interpolating between sensors. The collected data allows modeling of the stability of measured statistics. This would allow a curator to optimally position artifacts which are highly sensitive to atmospheric fluctuations. The curator would not have to simply guess that "further away from the door is better".
Why we built it
- Real time monitoring of artifacts
- Alerts when conditions are not Optimal
- Modeling of stability of conditions
- Individual artifact monitoring
How we built it
We used a little of everything to maximize the talent of our team.
Predix - temperature and humidity sensors transmit to the Predix cloud and are accessed by the time-series service.
BlueMix and Node-RED - TI SensorTags transmit temperature, humidity, pressure and object surface temperature to Bluemix, which is processed by a Node-RED flow. A Rest API was built to query observed conditions.
Twillio - used for text message notifications. A Python script runs intermittently to query current conditions and sends a message to Twillo when conditions fall outside normal range.
Apache - calculation of condition stability occurs on an Apache server, which creates image files that show the output of the stability algorithms.
Swift/Xcode - the iPhone app displays real time conditions in a simple, elegant display, with the option to view detailed dashboard data.
Power BI - this is our dashboard to power our analytics. It pulls together the disparate data sources. A Python script parses the data, calculates and sends it to Power BI as a streaming data set. Dashboard
Modeling of Condition Stability
One of the most difficult aspects of monitoring ambient conditions such as temperature and humidity in real time is that it exists in a gradient and can fluctuate in the real world. Your sensor may say the temperature in your room is exactly 70 degrees F, but in reality some parts are warmer, others are colder and some are fluctuating, such as when a door opens.
Challenges we ran into
We initially tried to do analayis in Matlab, however, it was not possible to integrate it. (We tried hard!) We eventually turned to Python.
We researched condition stability through conversion of time series data to the frequency domain using FFT (fast fouier transform), comparison of the derivative of short v long moving averages, or other methods. The scope of this research fell outside of the time parameters. In theory, such analysis should permit quantification of local condition stability and potentially interpolation between sensors. However, there was not sufficient data (due to time) to complete this analysis.
We spent many hours trying to get the Predix UI working. We were able to pull in the sensor data using an express app, but, struggled to wire up the Predix UI components to get the desired interface.
Accomplishments that we are proud of
The simplicity of the user experience - set it and forget it. The user interface only appears when there is a real problem to diagnose.
What we learned
That this team rocks and we should hack together in the future.
What's next for Real-Time Alerts for Museum Artifacts and Storage
- Completion of the research into stability of conditions, such that we could classify areas or rooms
- Build out the sensor network
- Simplify
- Beautify
- Handle edge case


Log in or sign up for Devpost to join the conversation.