RealTerminal — project story
Inspiration
Real estate and macro decisions still depend on a scattered mix of spreadsheets, government portals, and news sites. We wanted a single, map-first terminal that behaves like the tools institutional analysts use—where housing, labor, rents, risk, GDP, lending, and macro indicators for a place are one click away, not ten browser tabs.
What it does
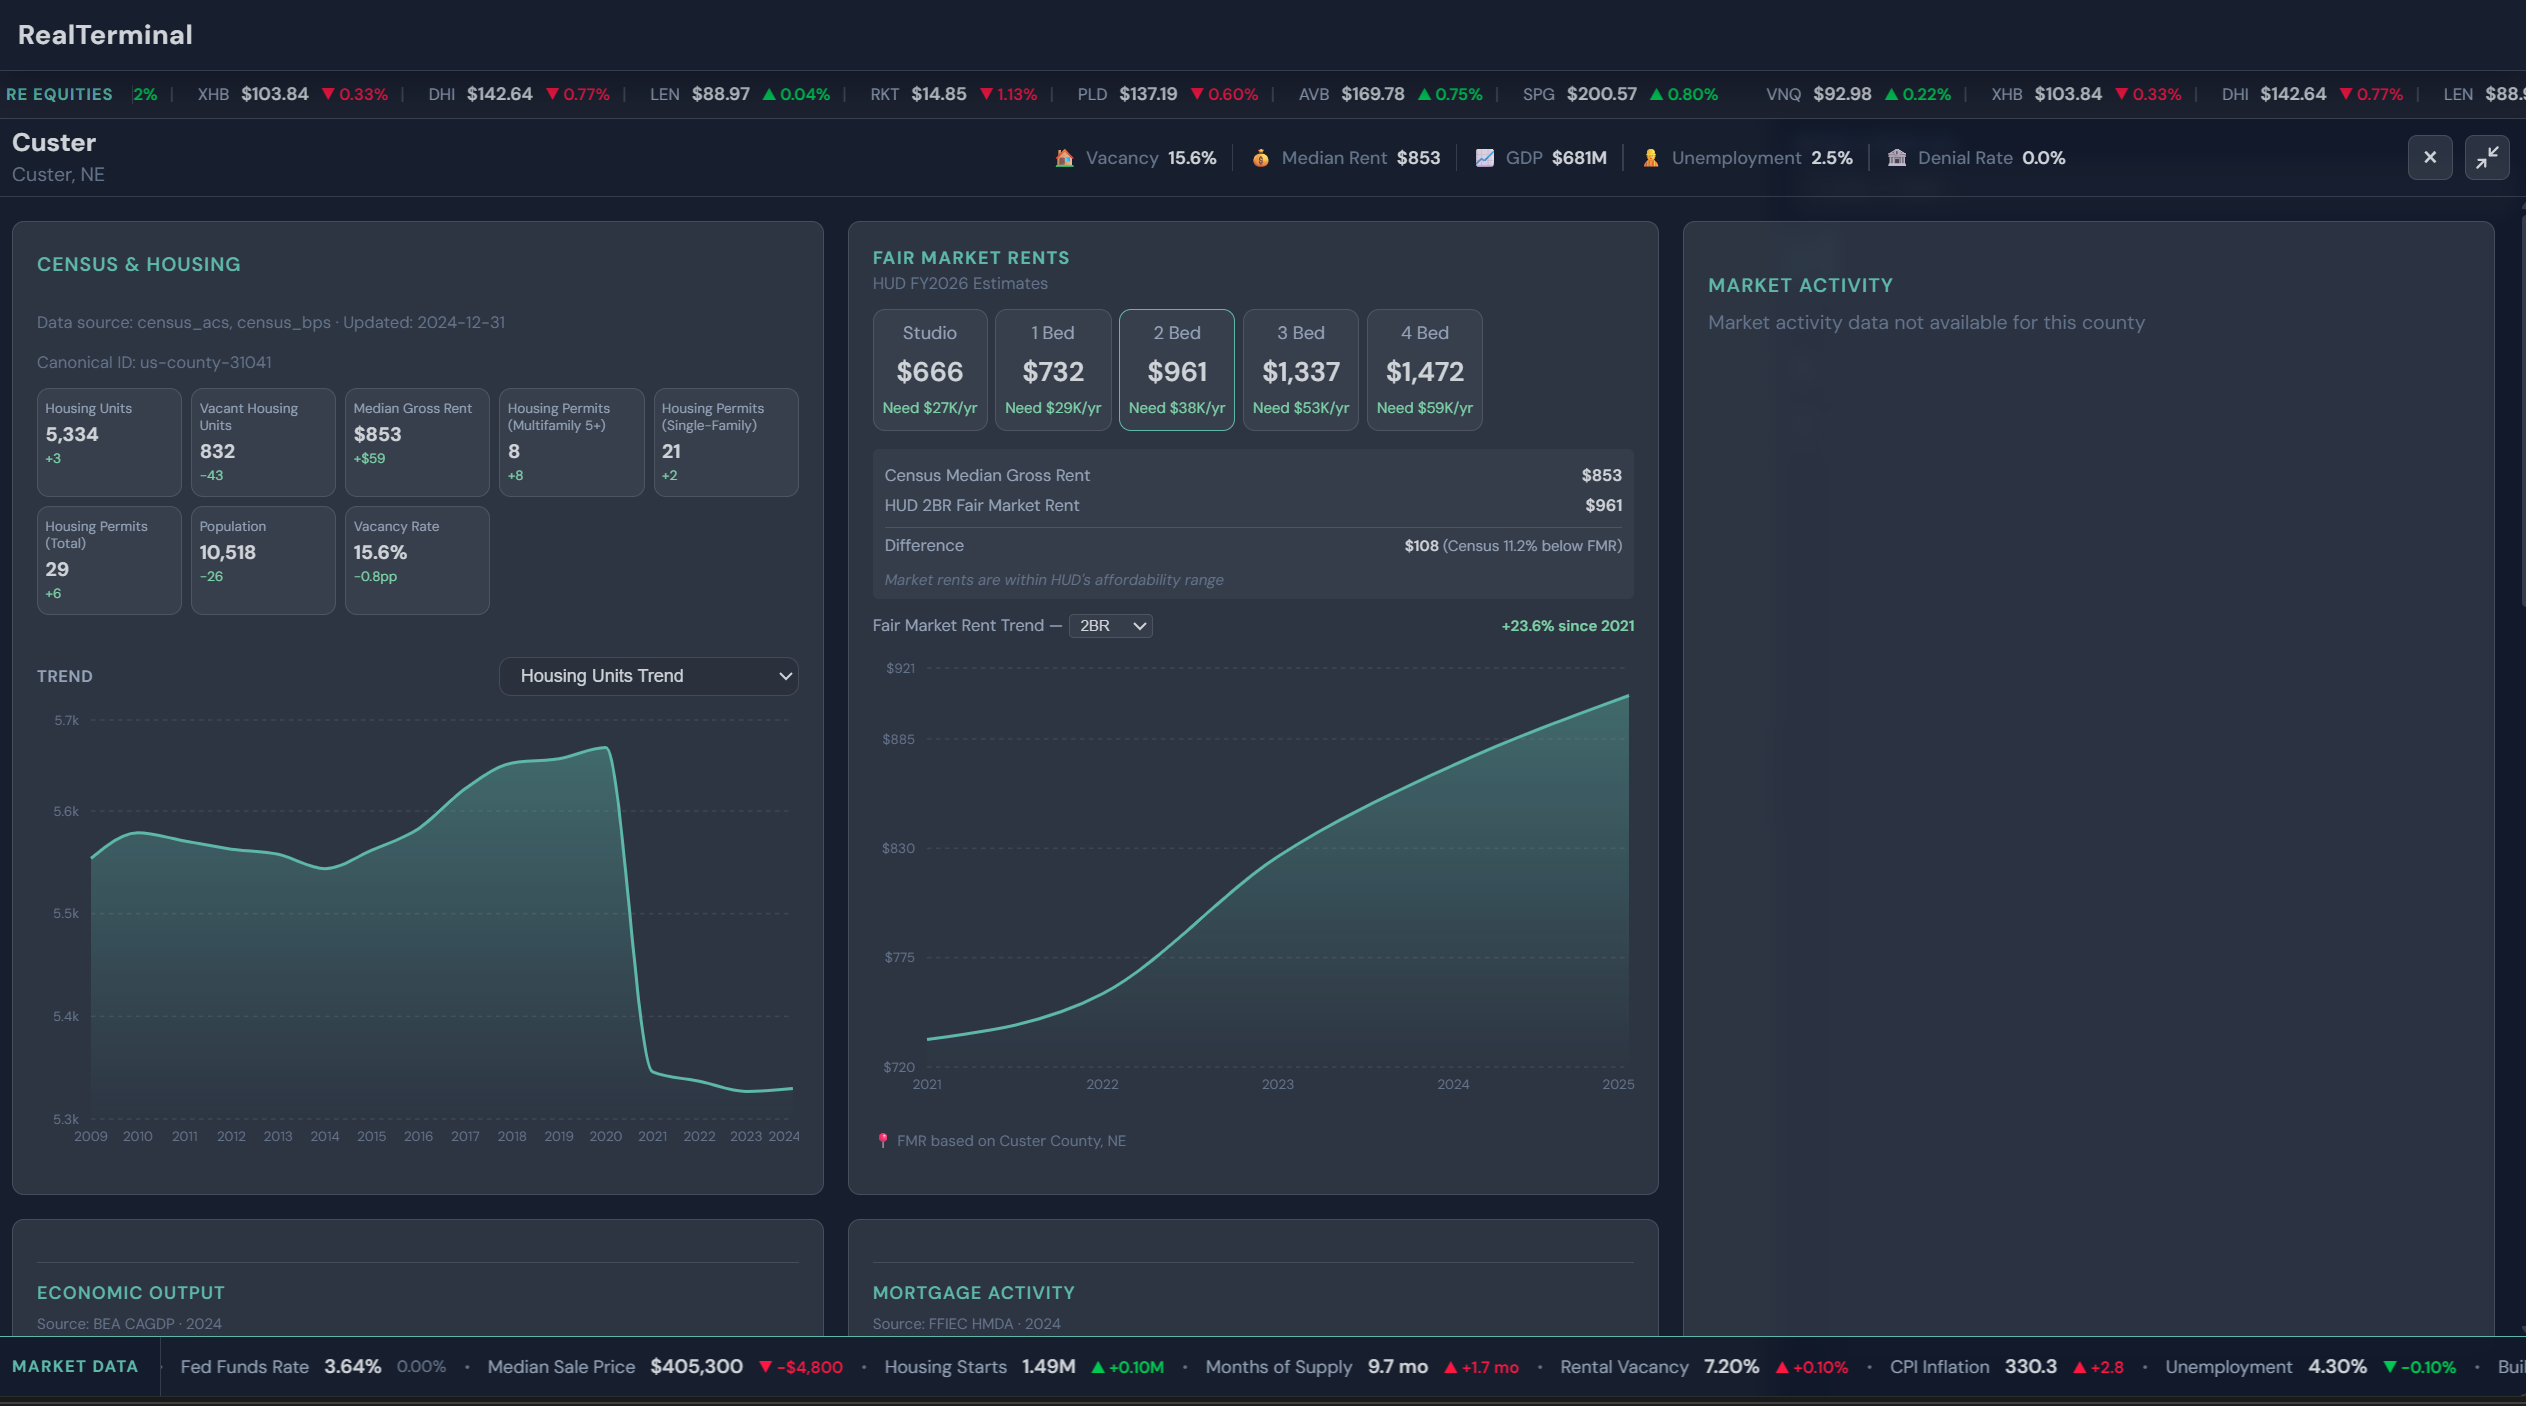
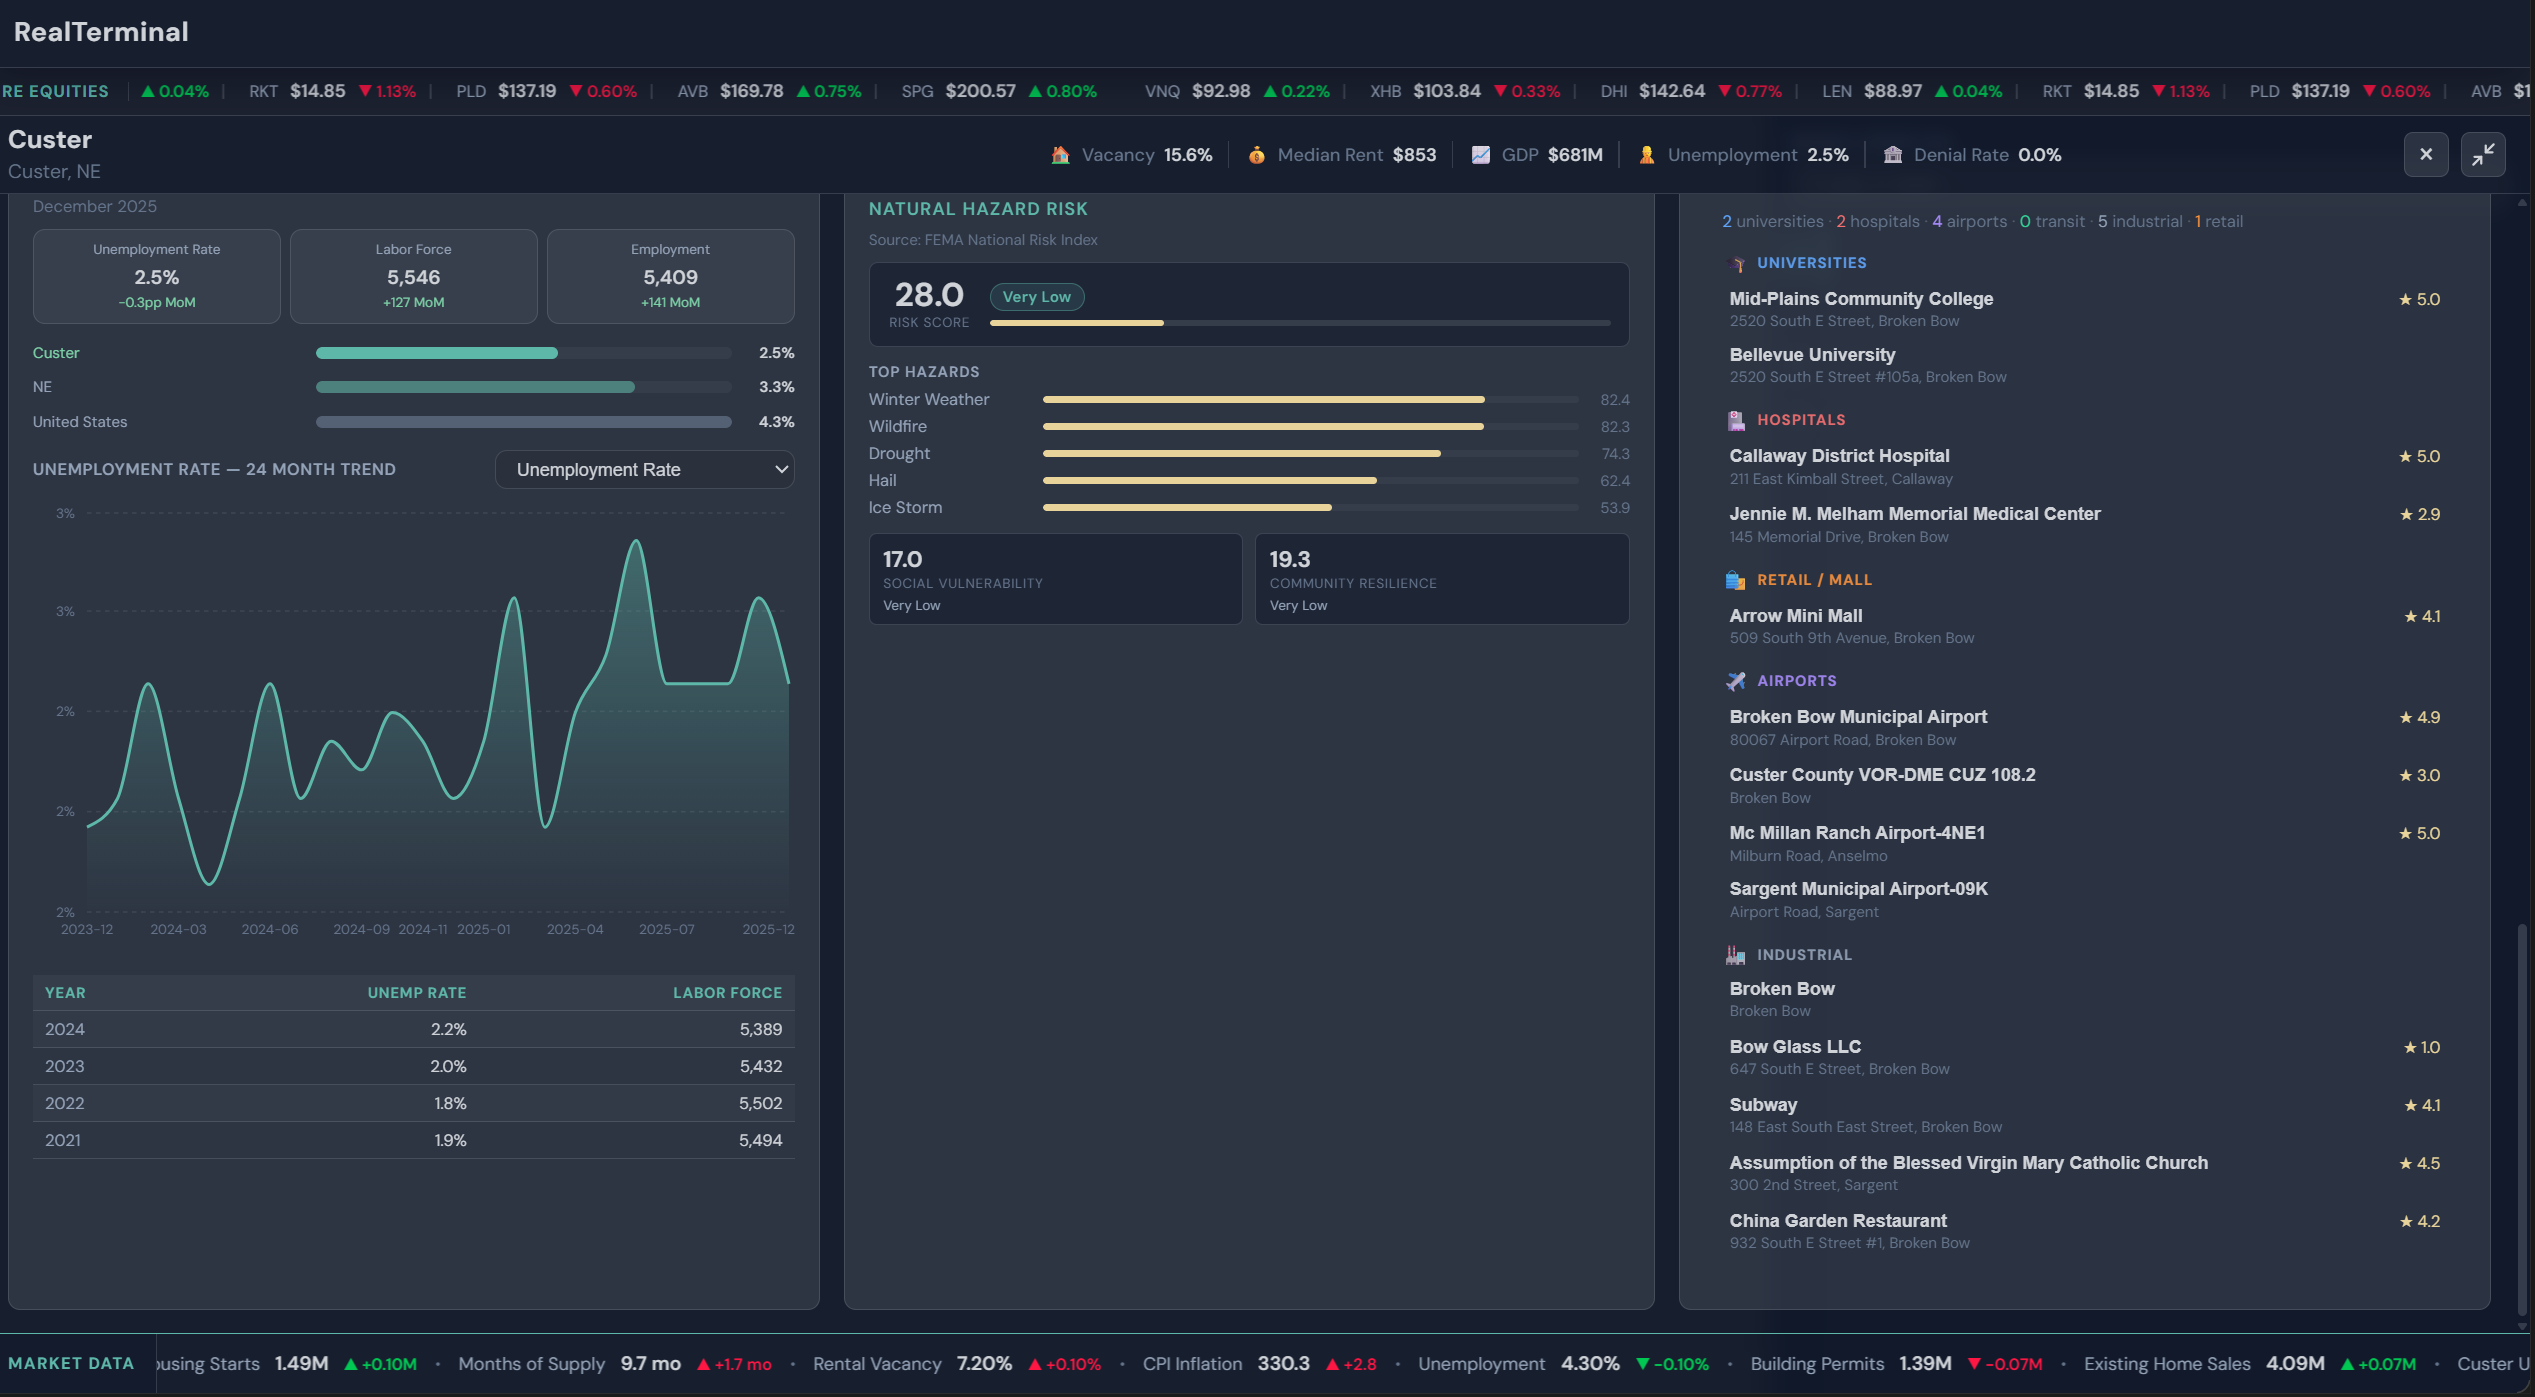
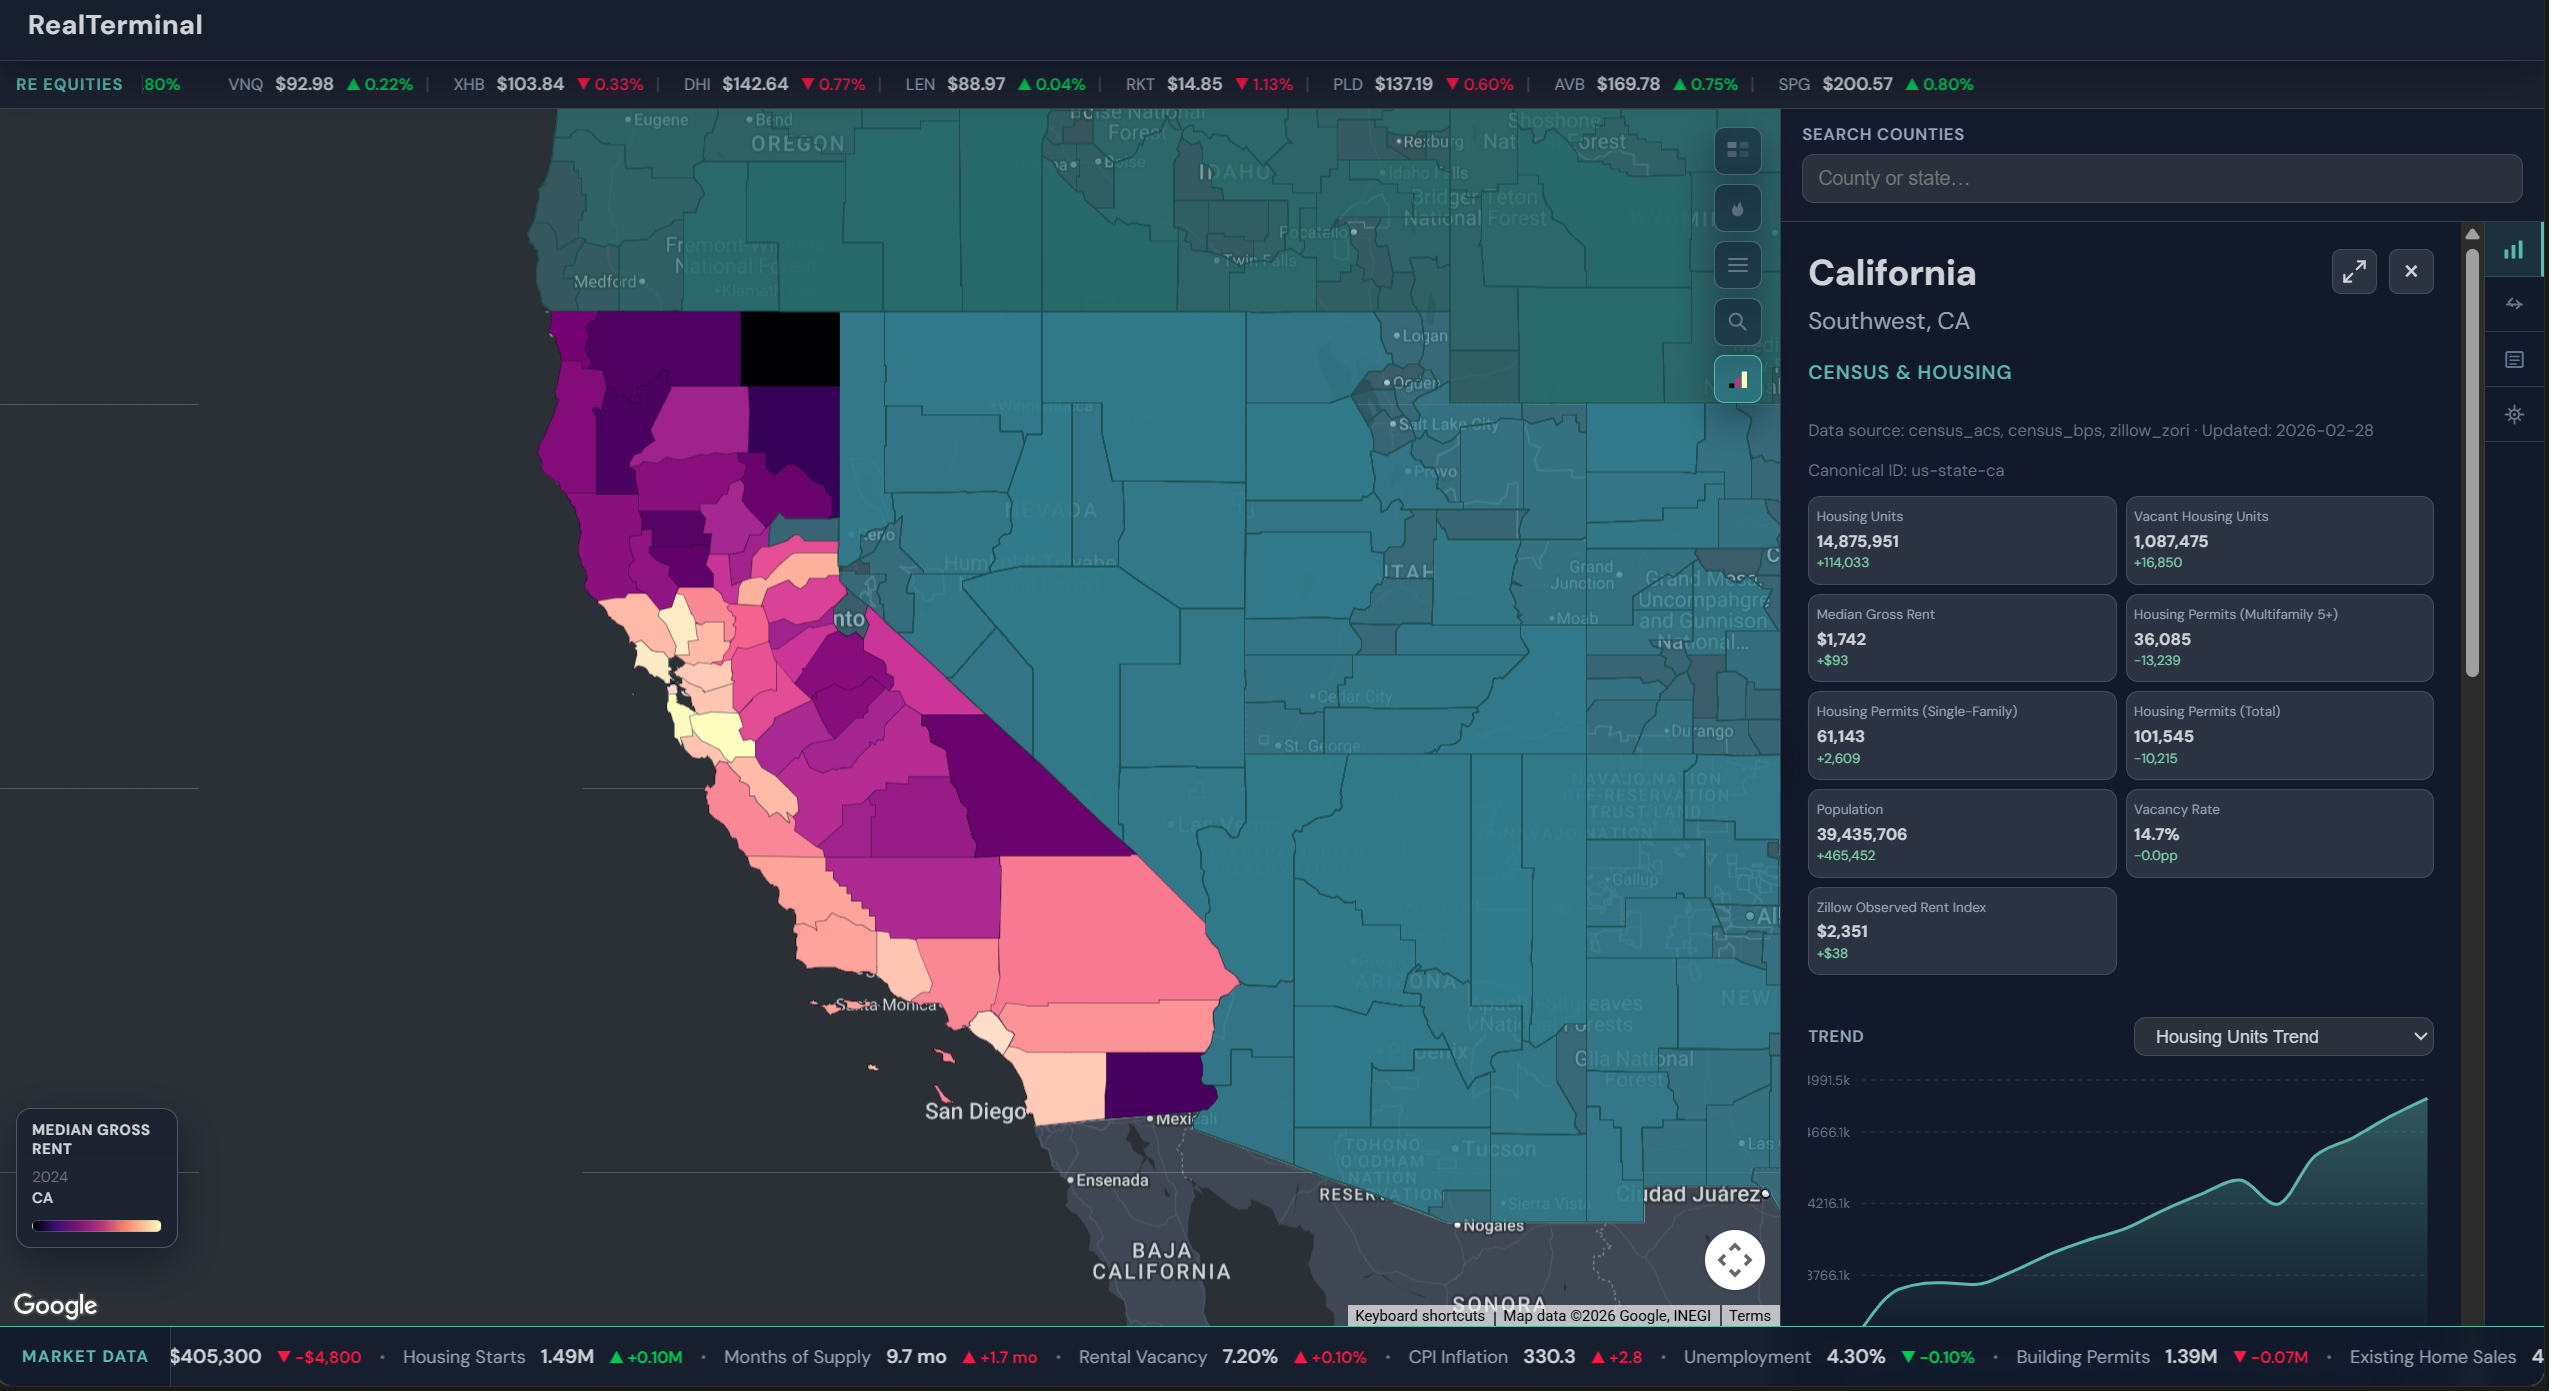
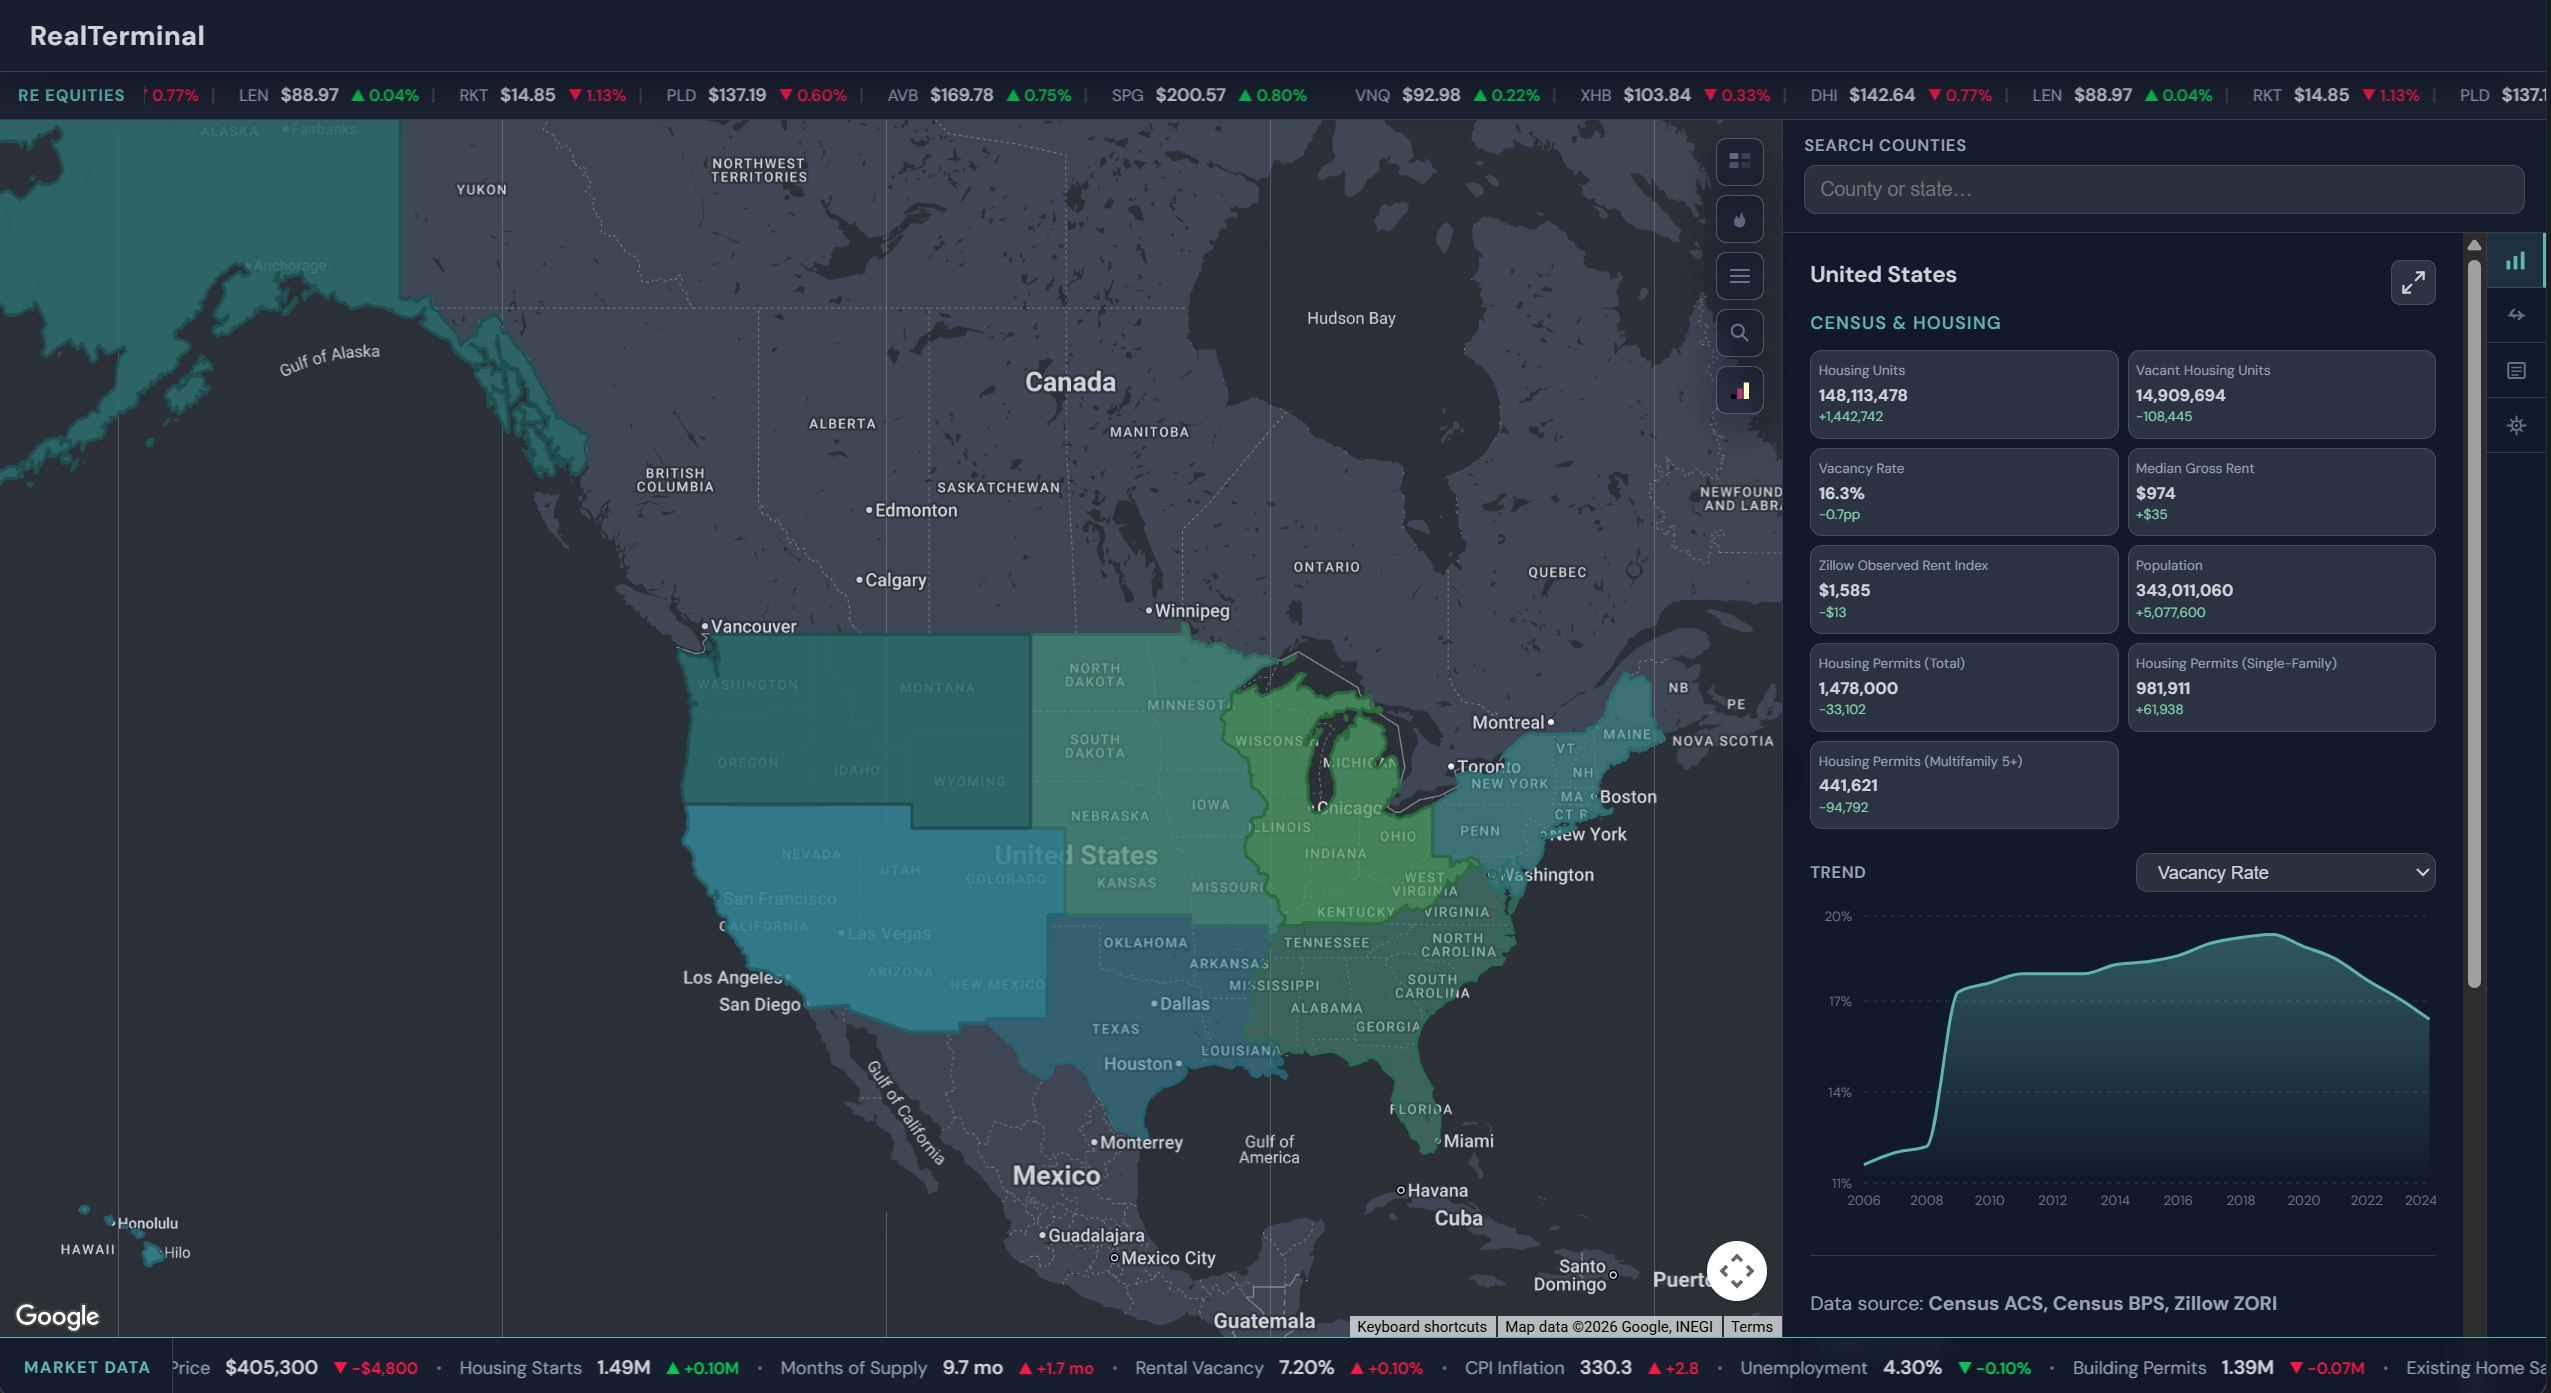
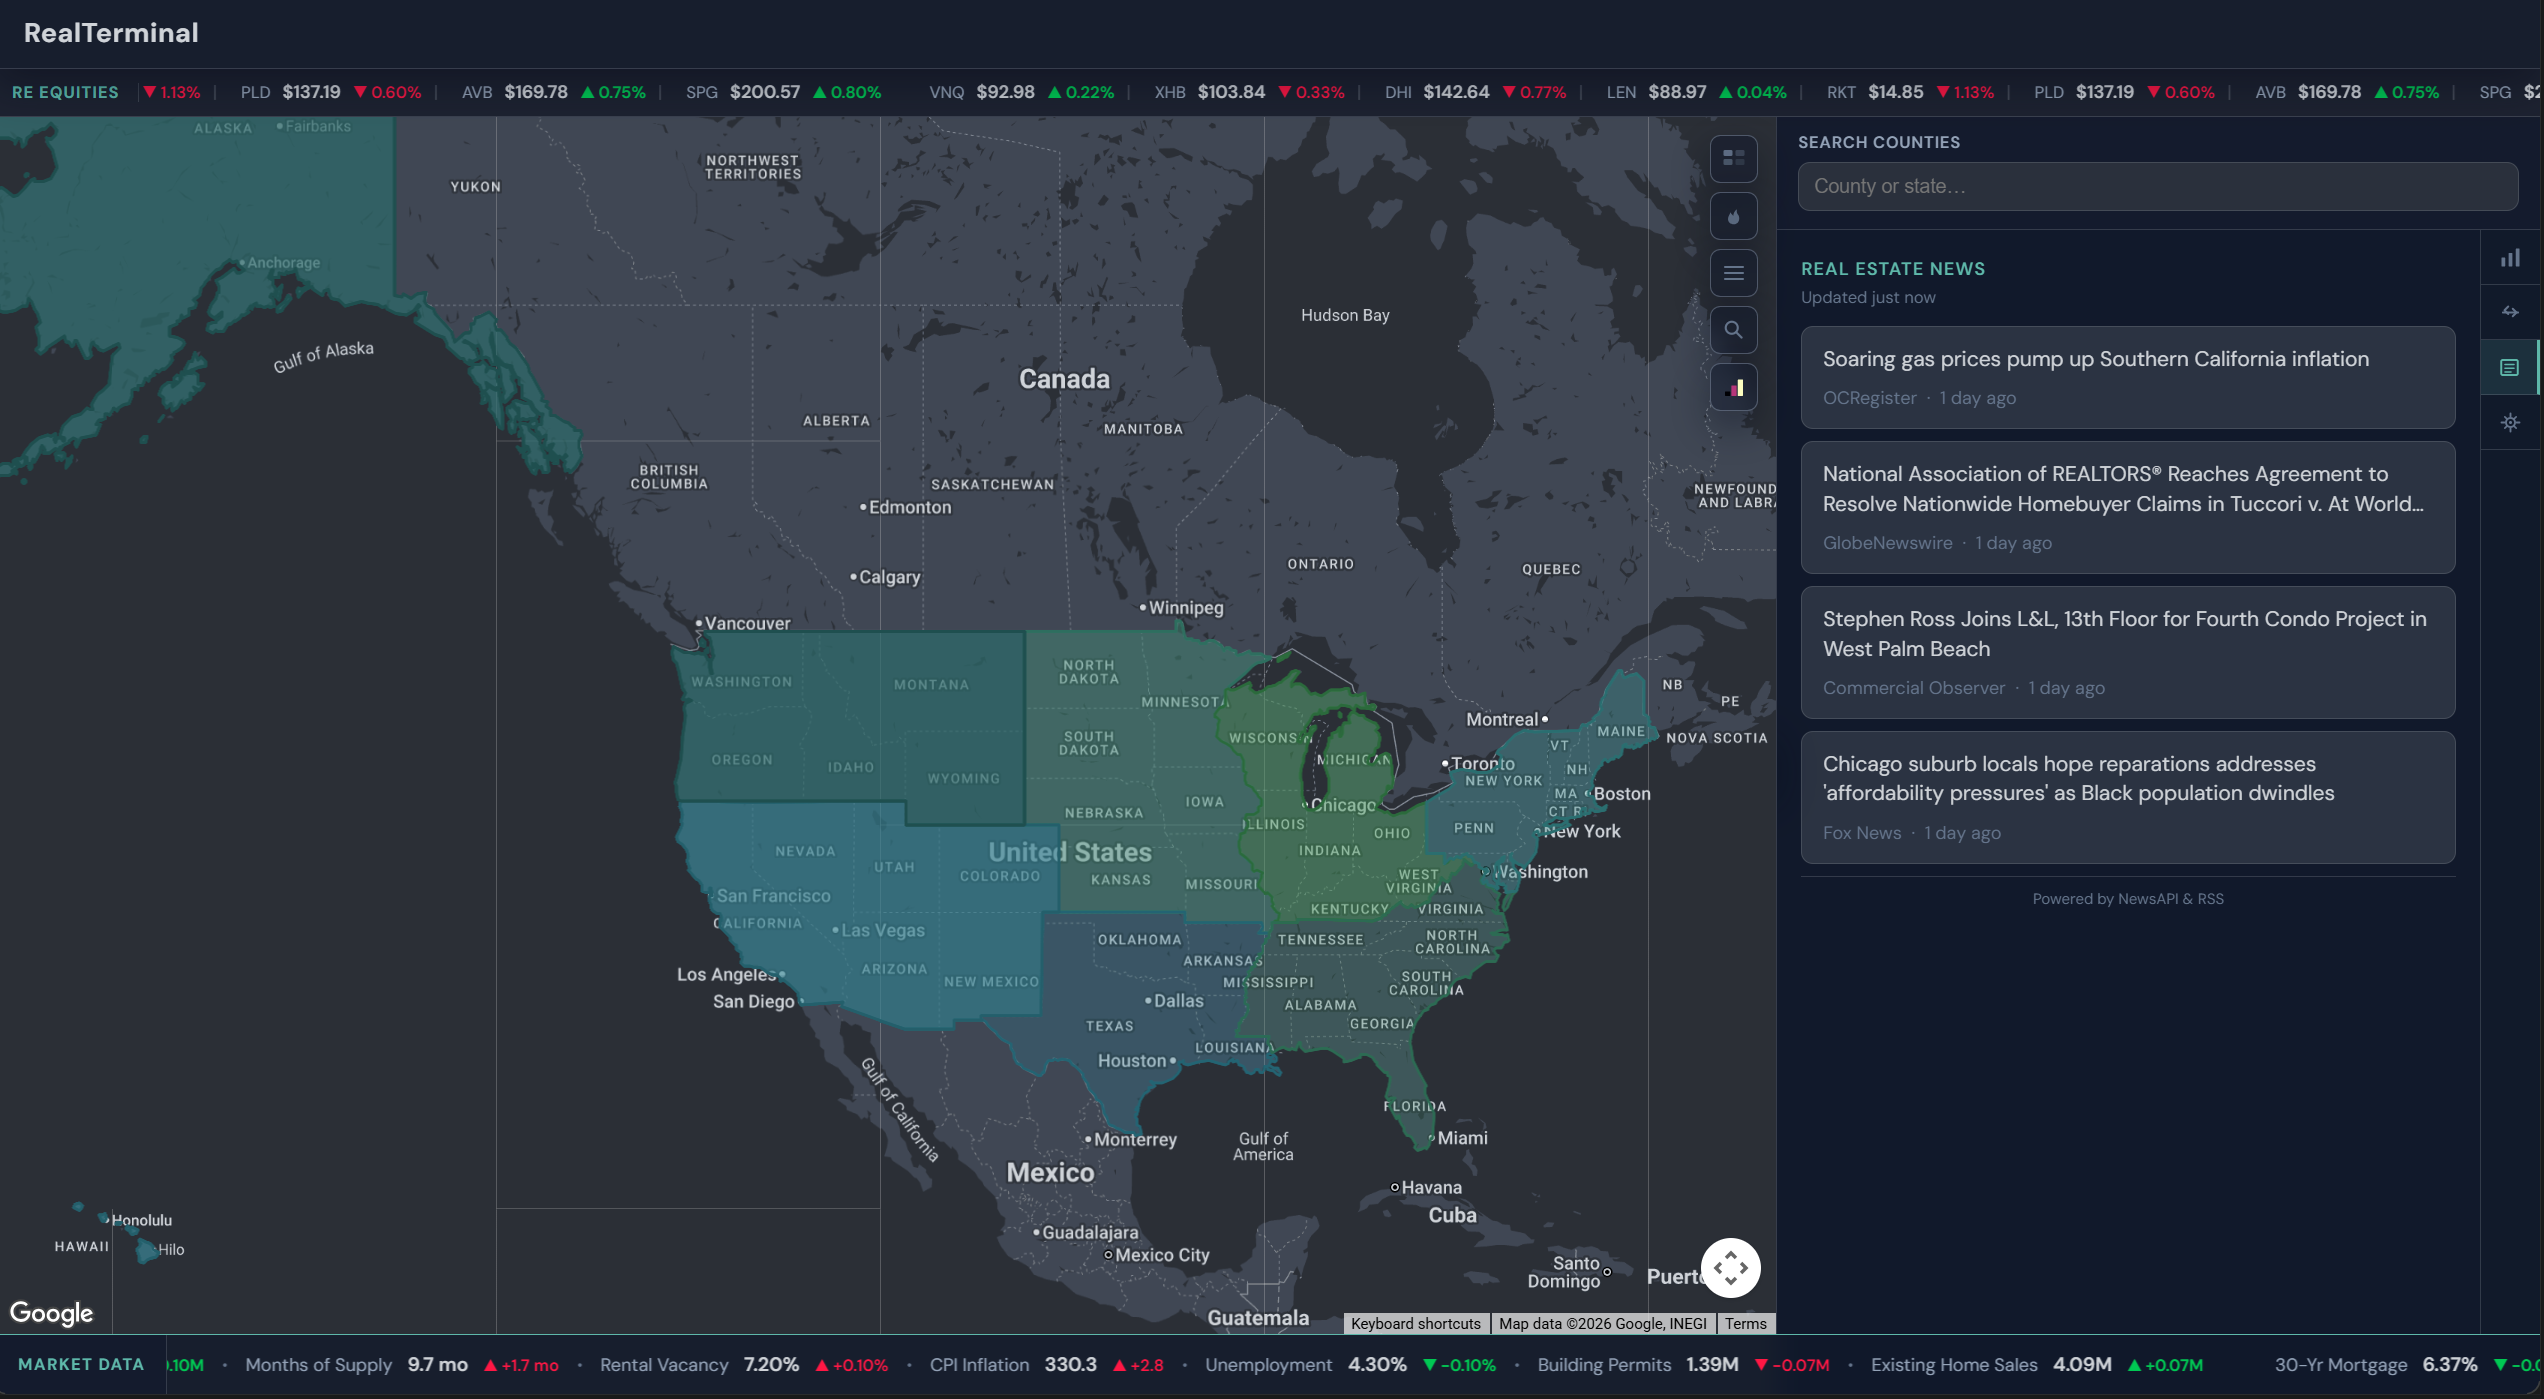
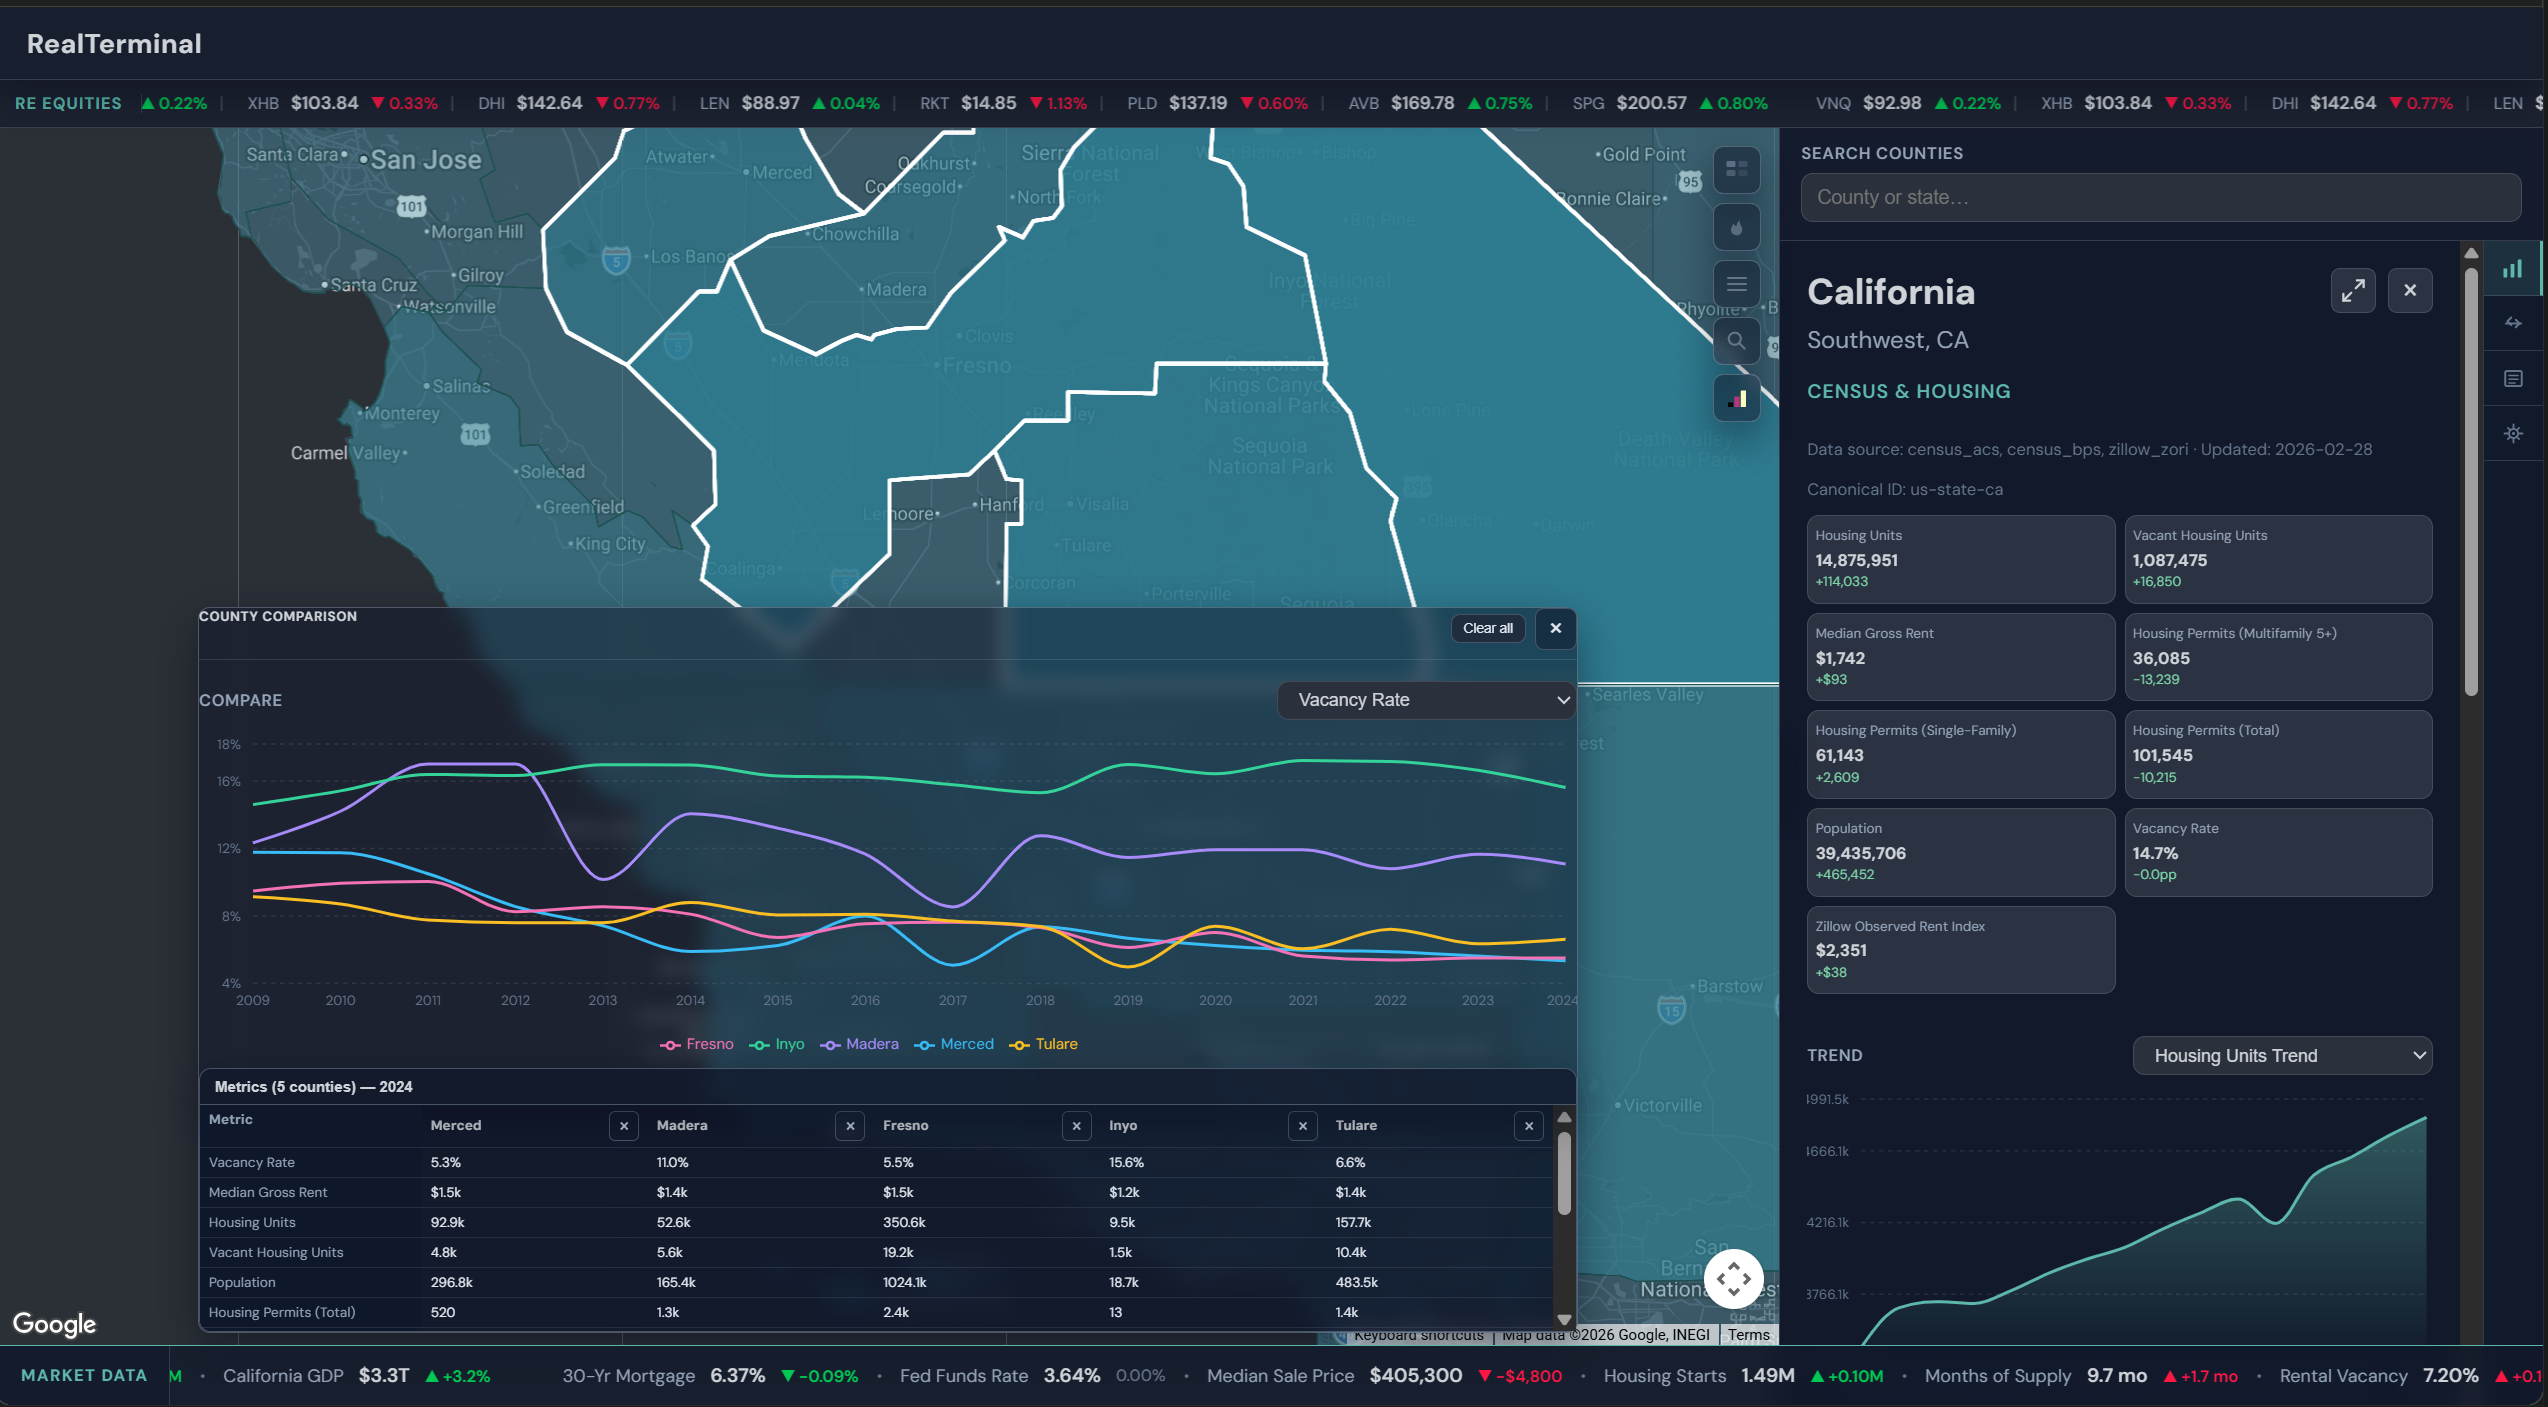
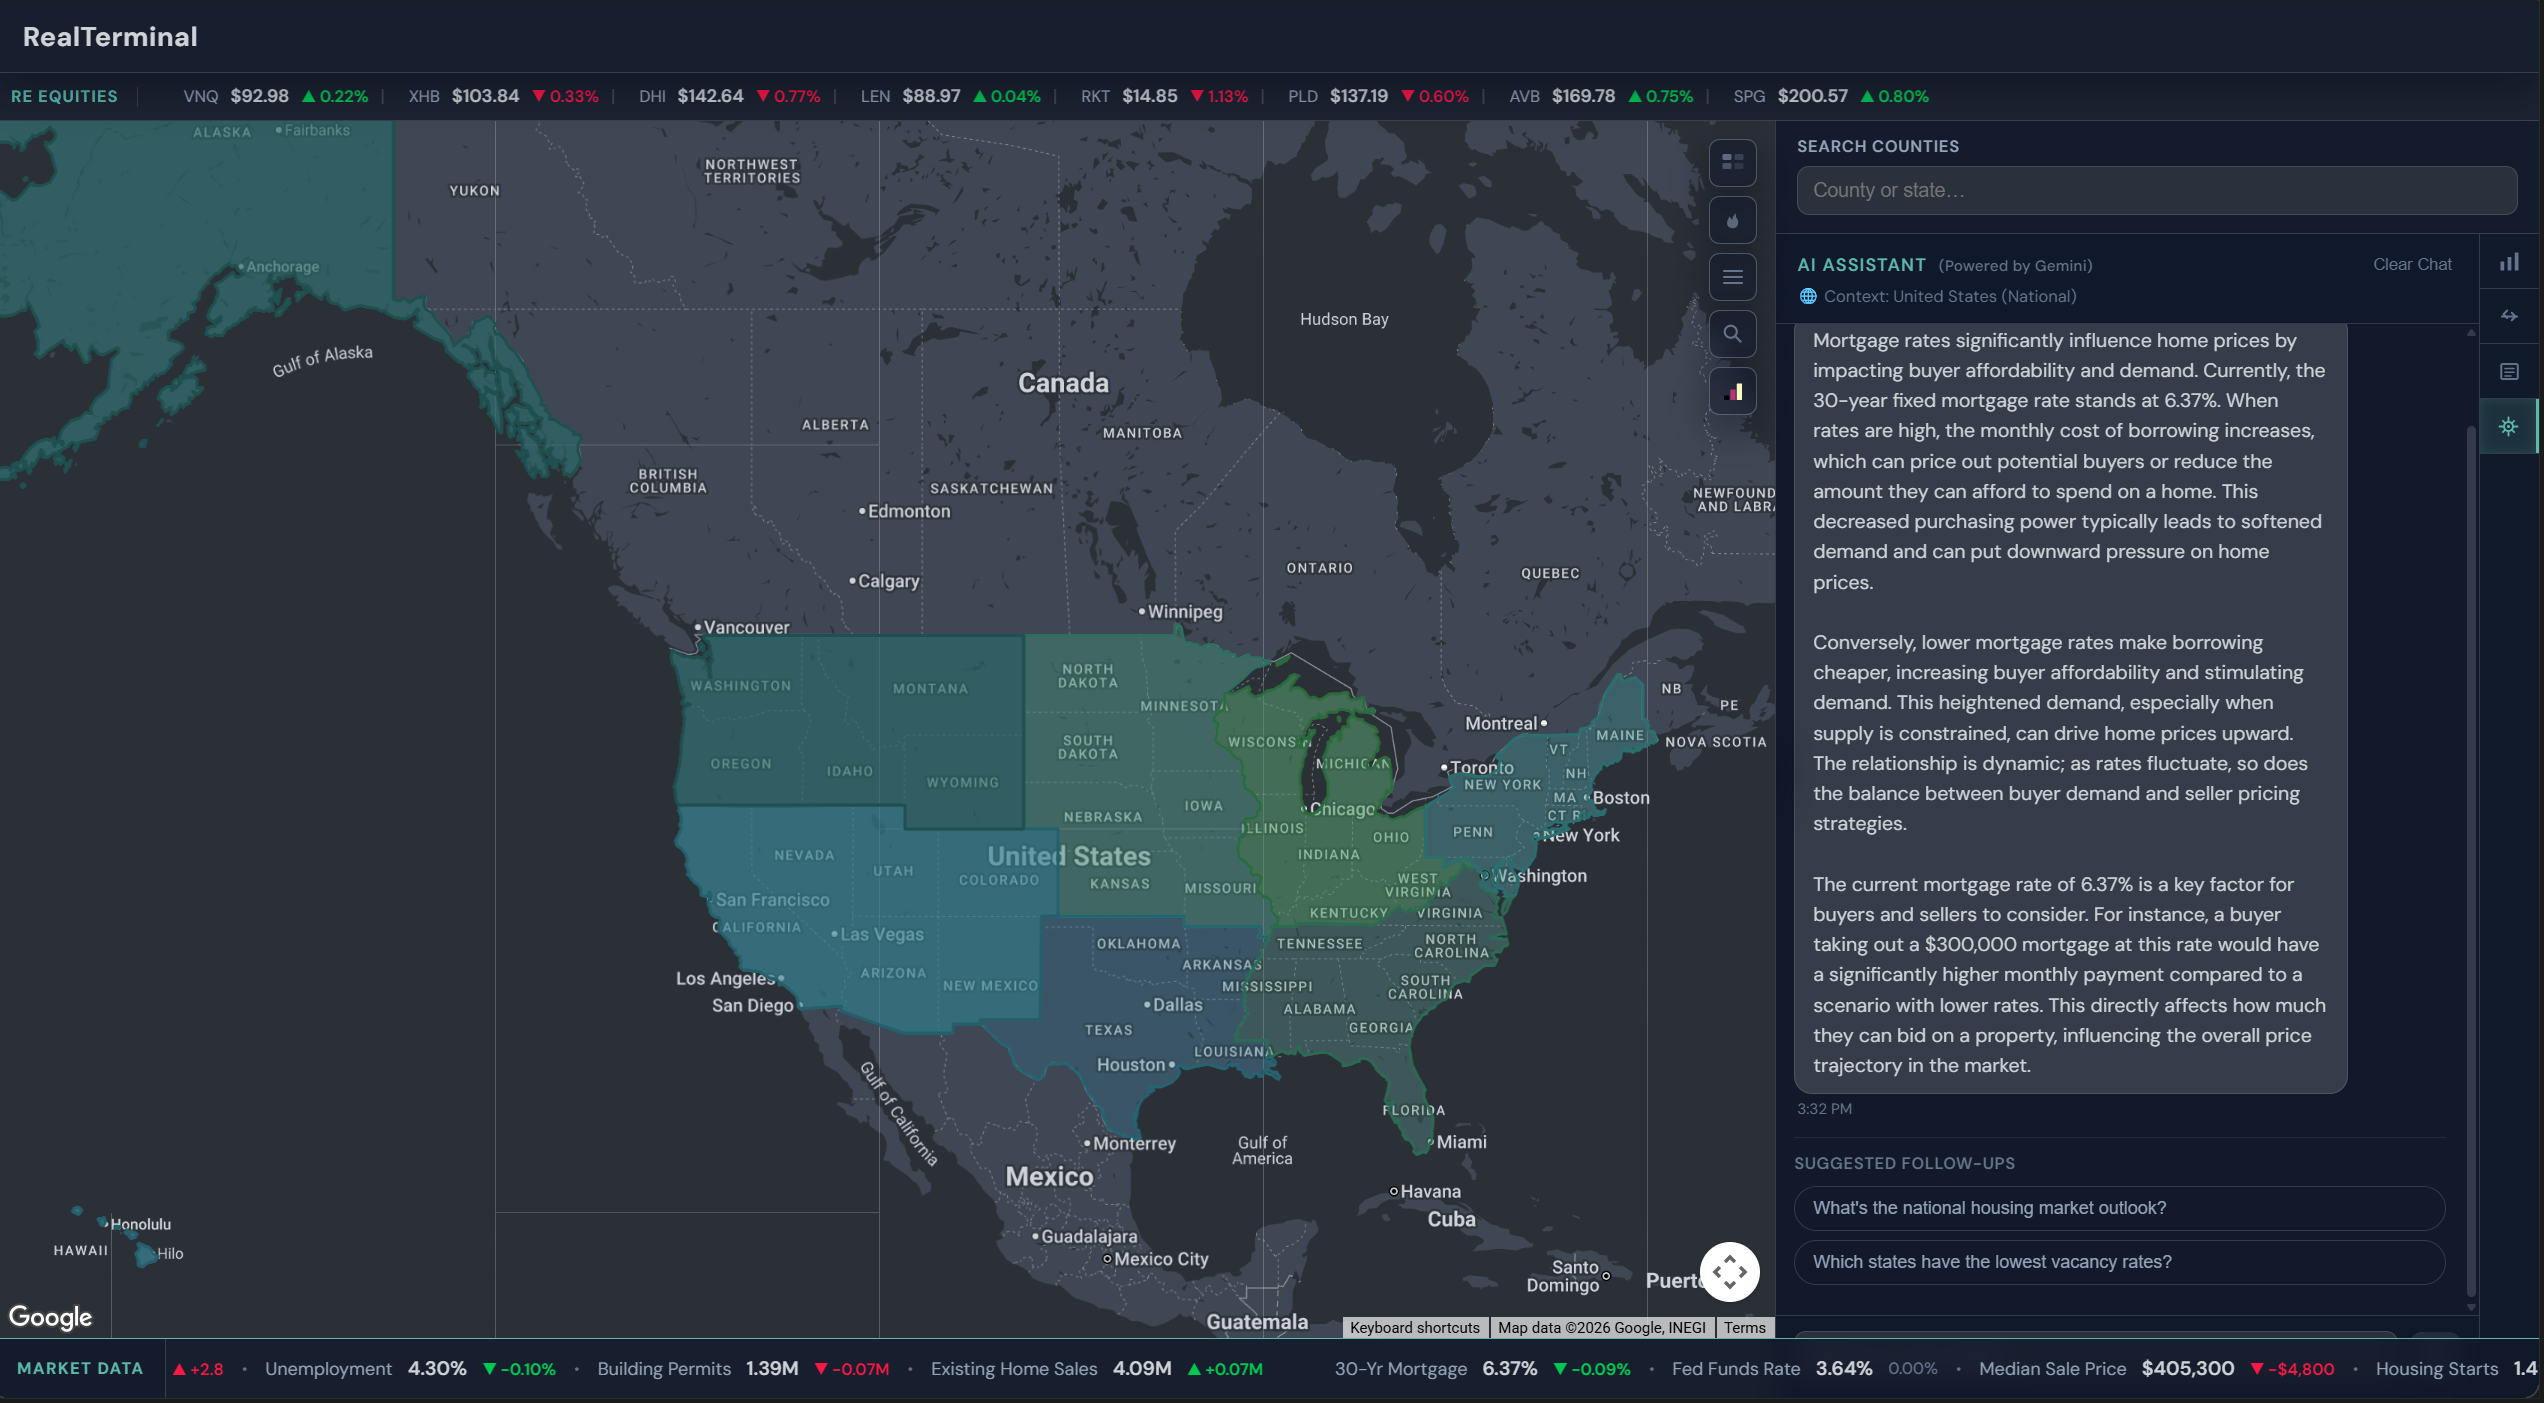
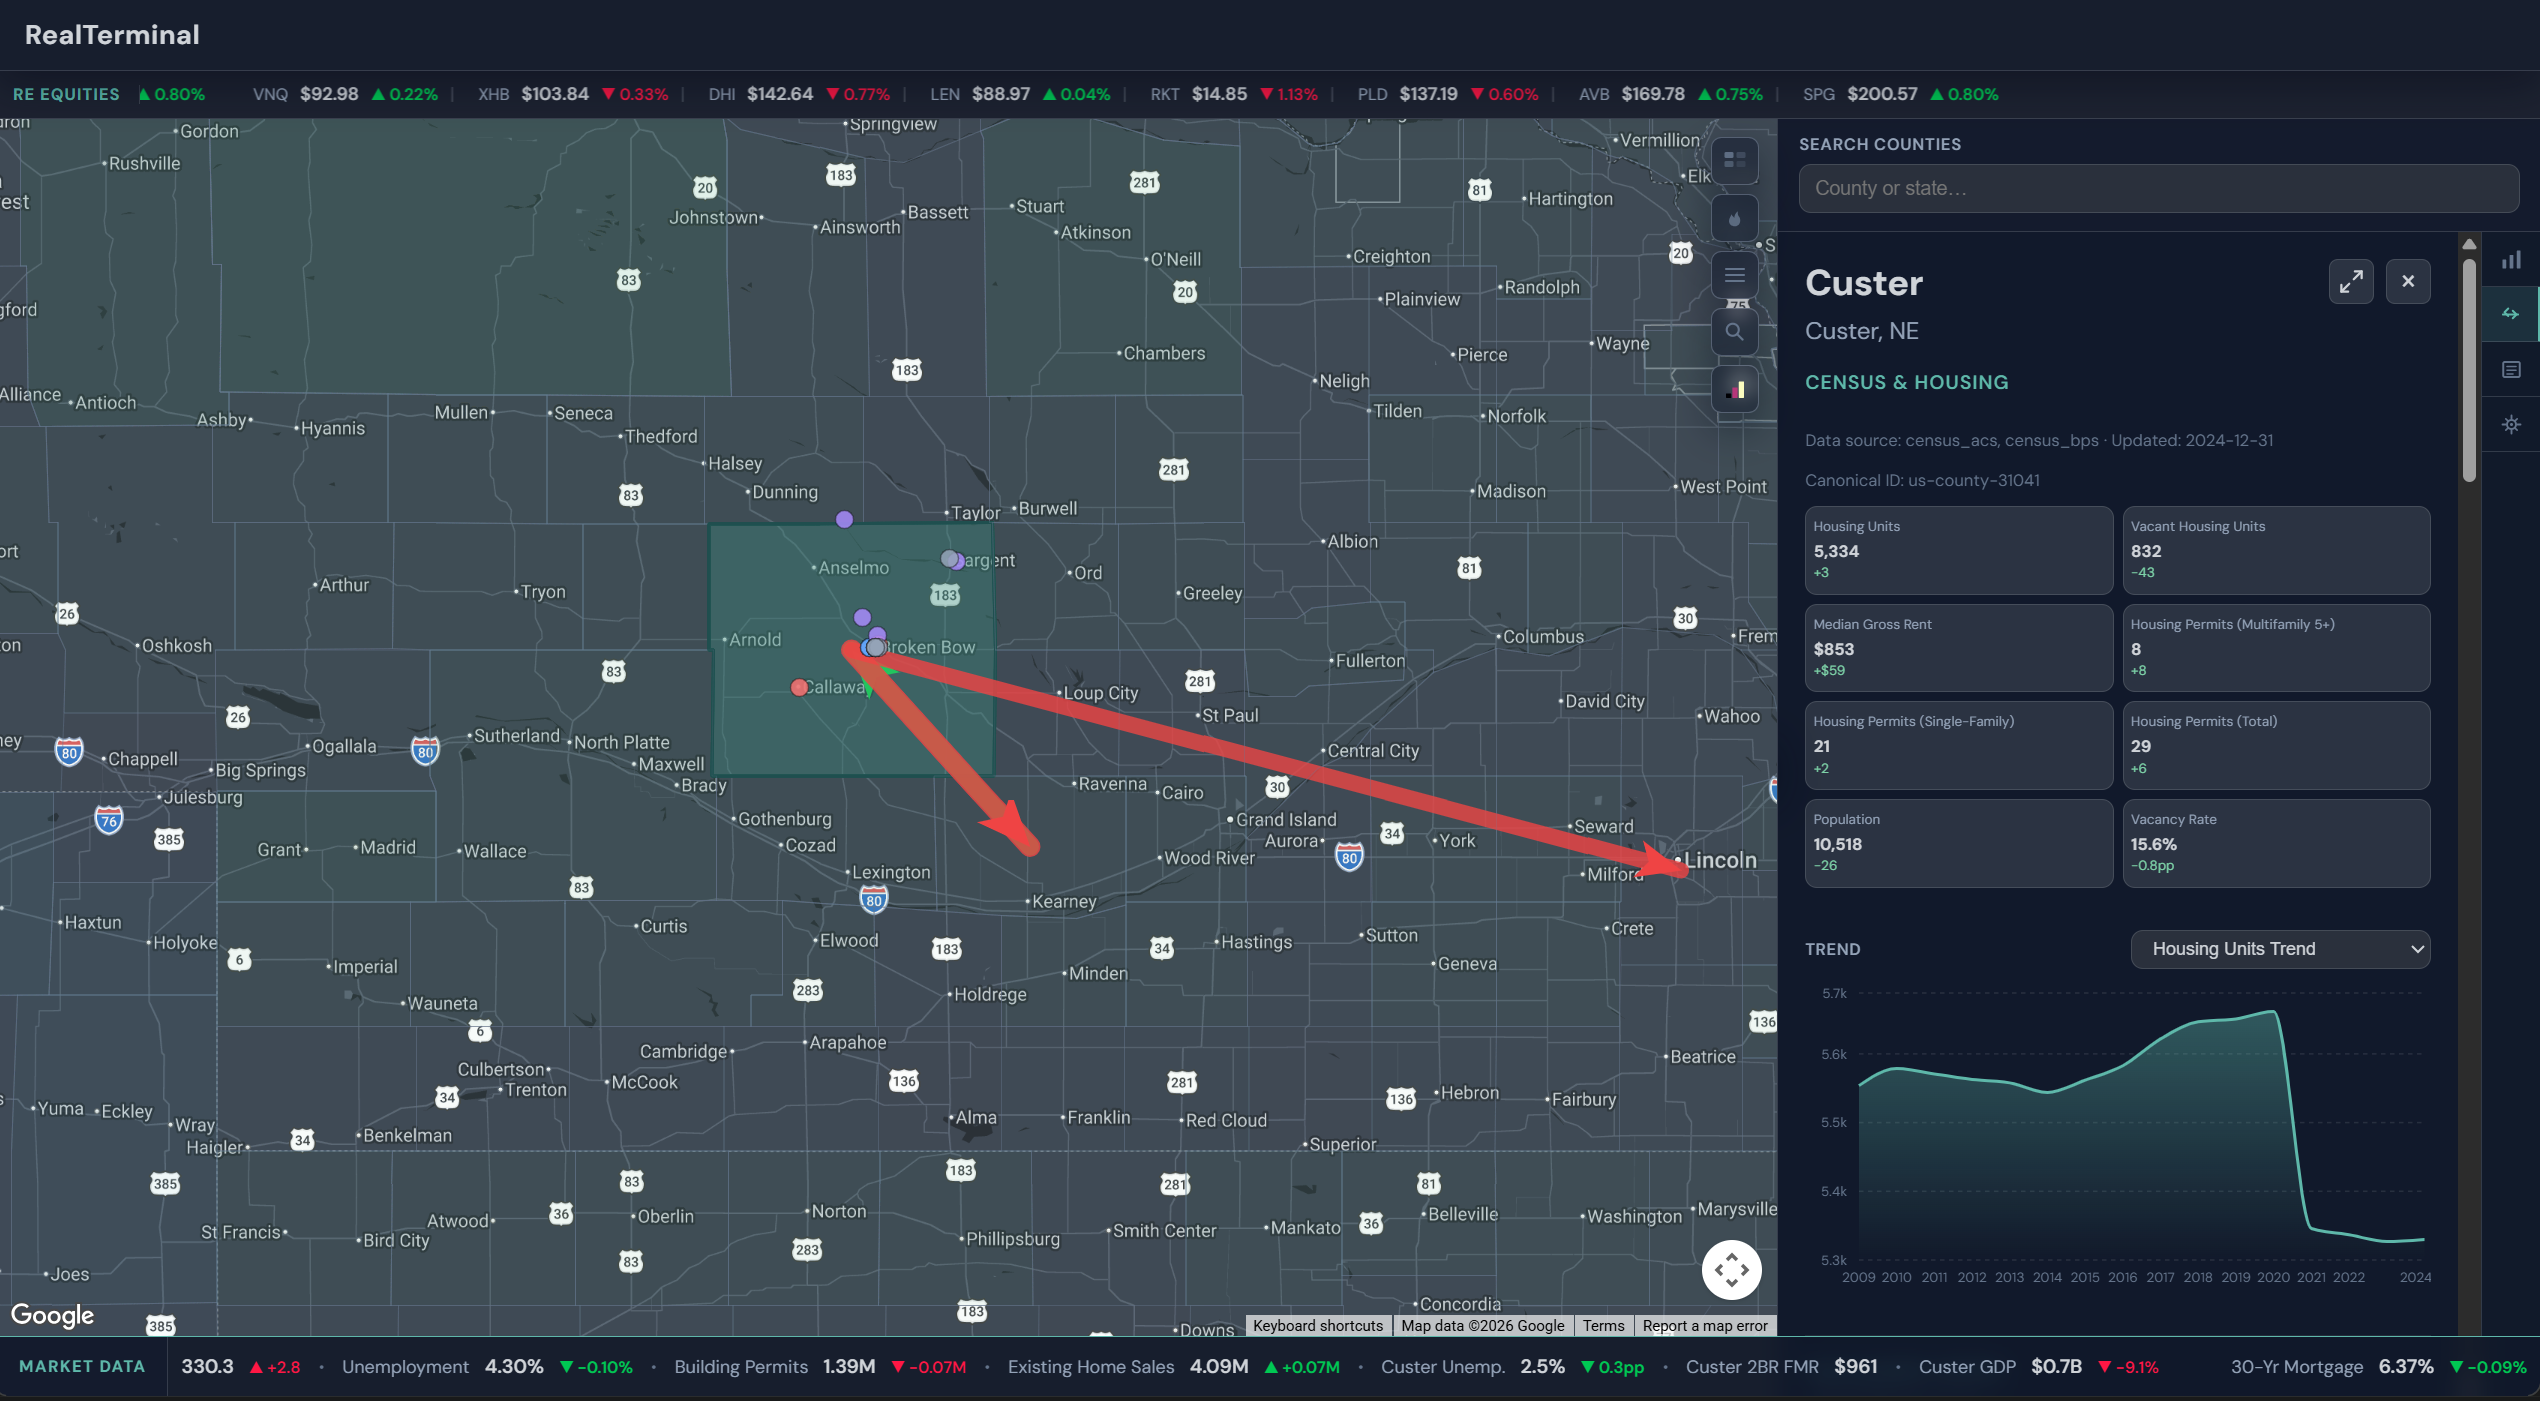
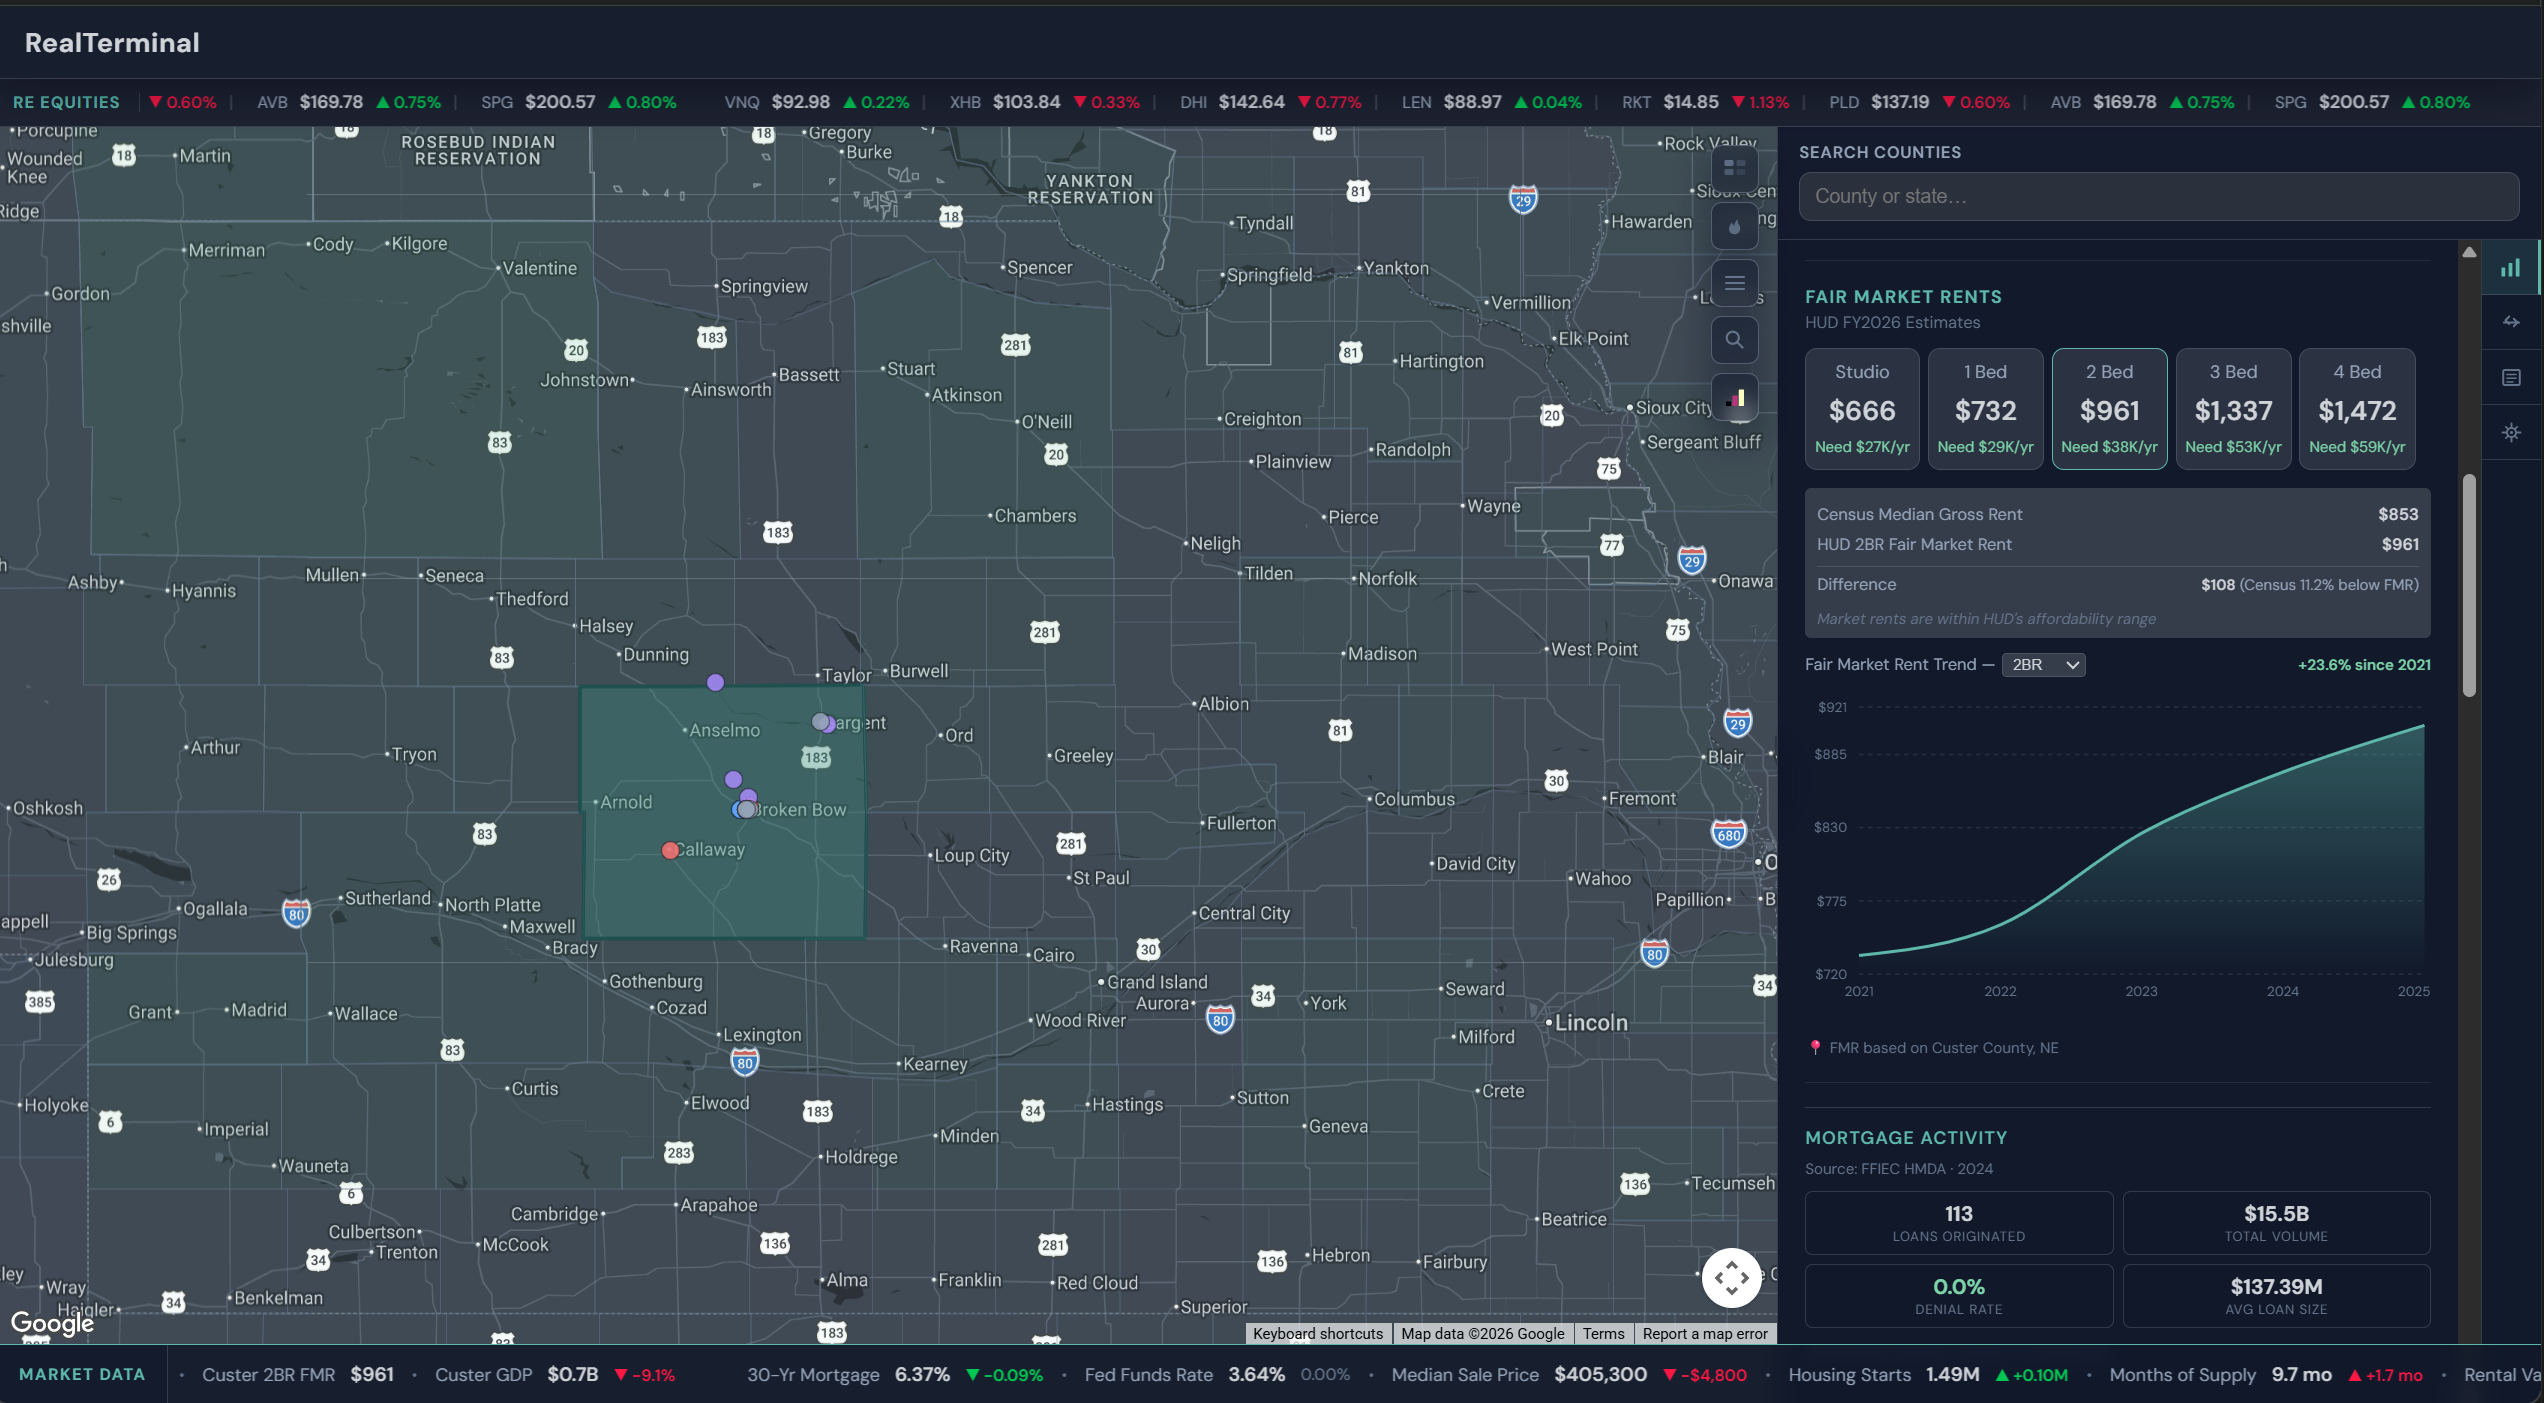
RealTerminal is a geographic market terminal: pick a county or submarket on an interactive map and get Census-style housing and demographic insights, Redfin market dynamics, FRED macro series with a live-style ticker (including local unemployment when relevant), migration flows, HUD Fair Market Rents, FEMA natural-hazard risk, BEA GDP, HMDA mortgage activity, real estate news, and a Gemini-powered assistant that answers using the same structured context as the dashboard—not generic web search.
How we built it
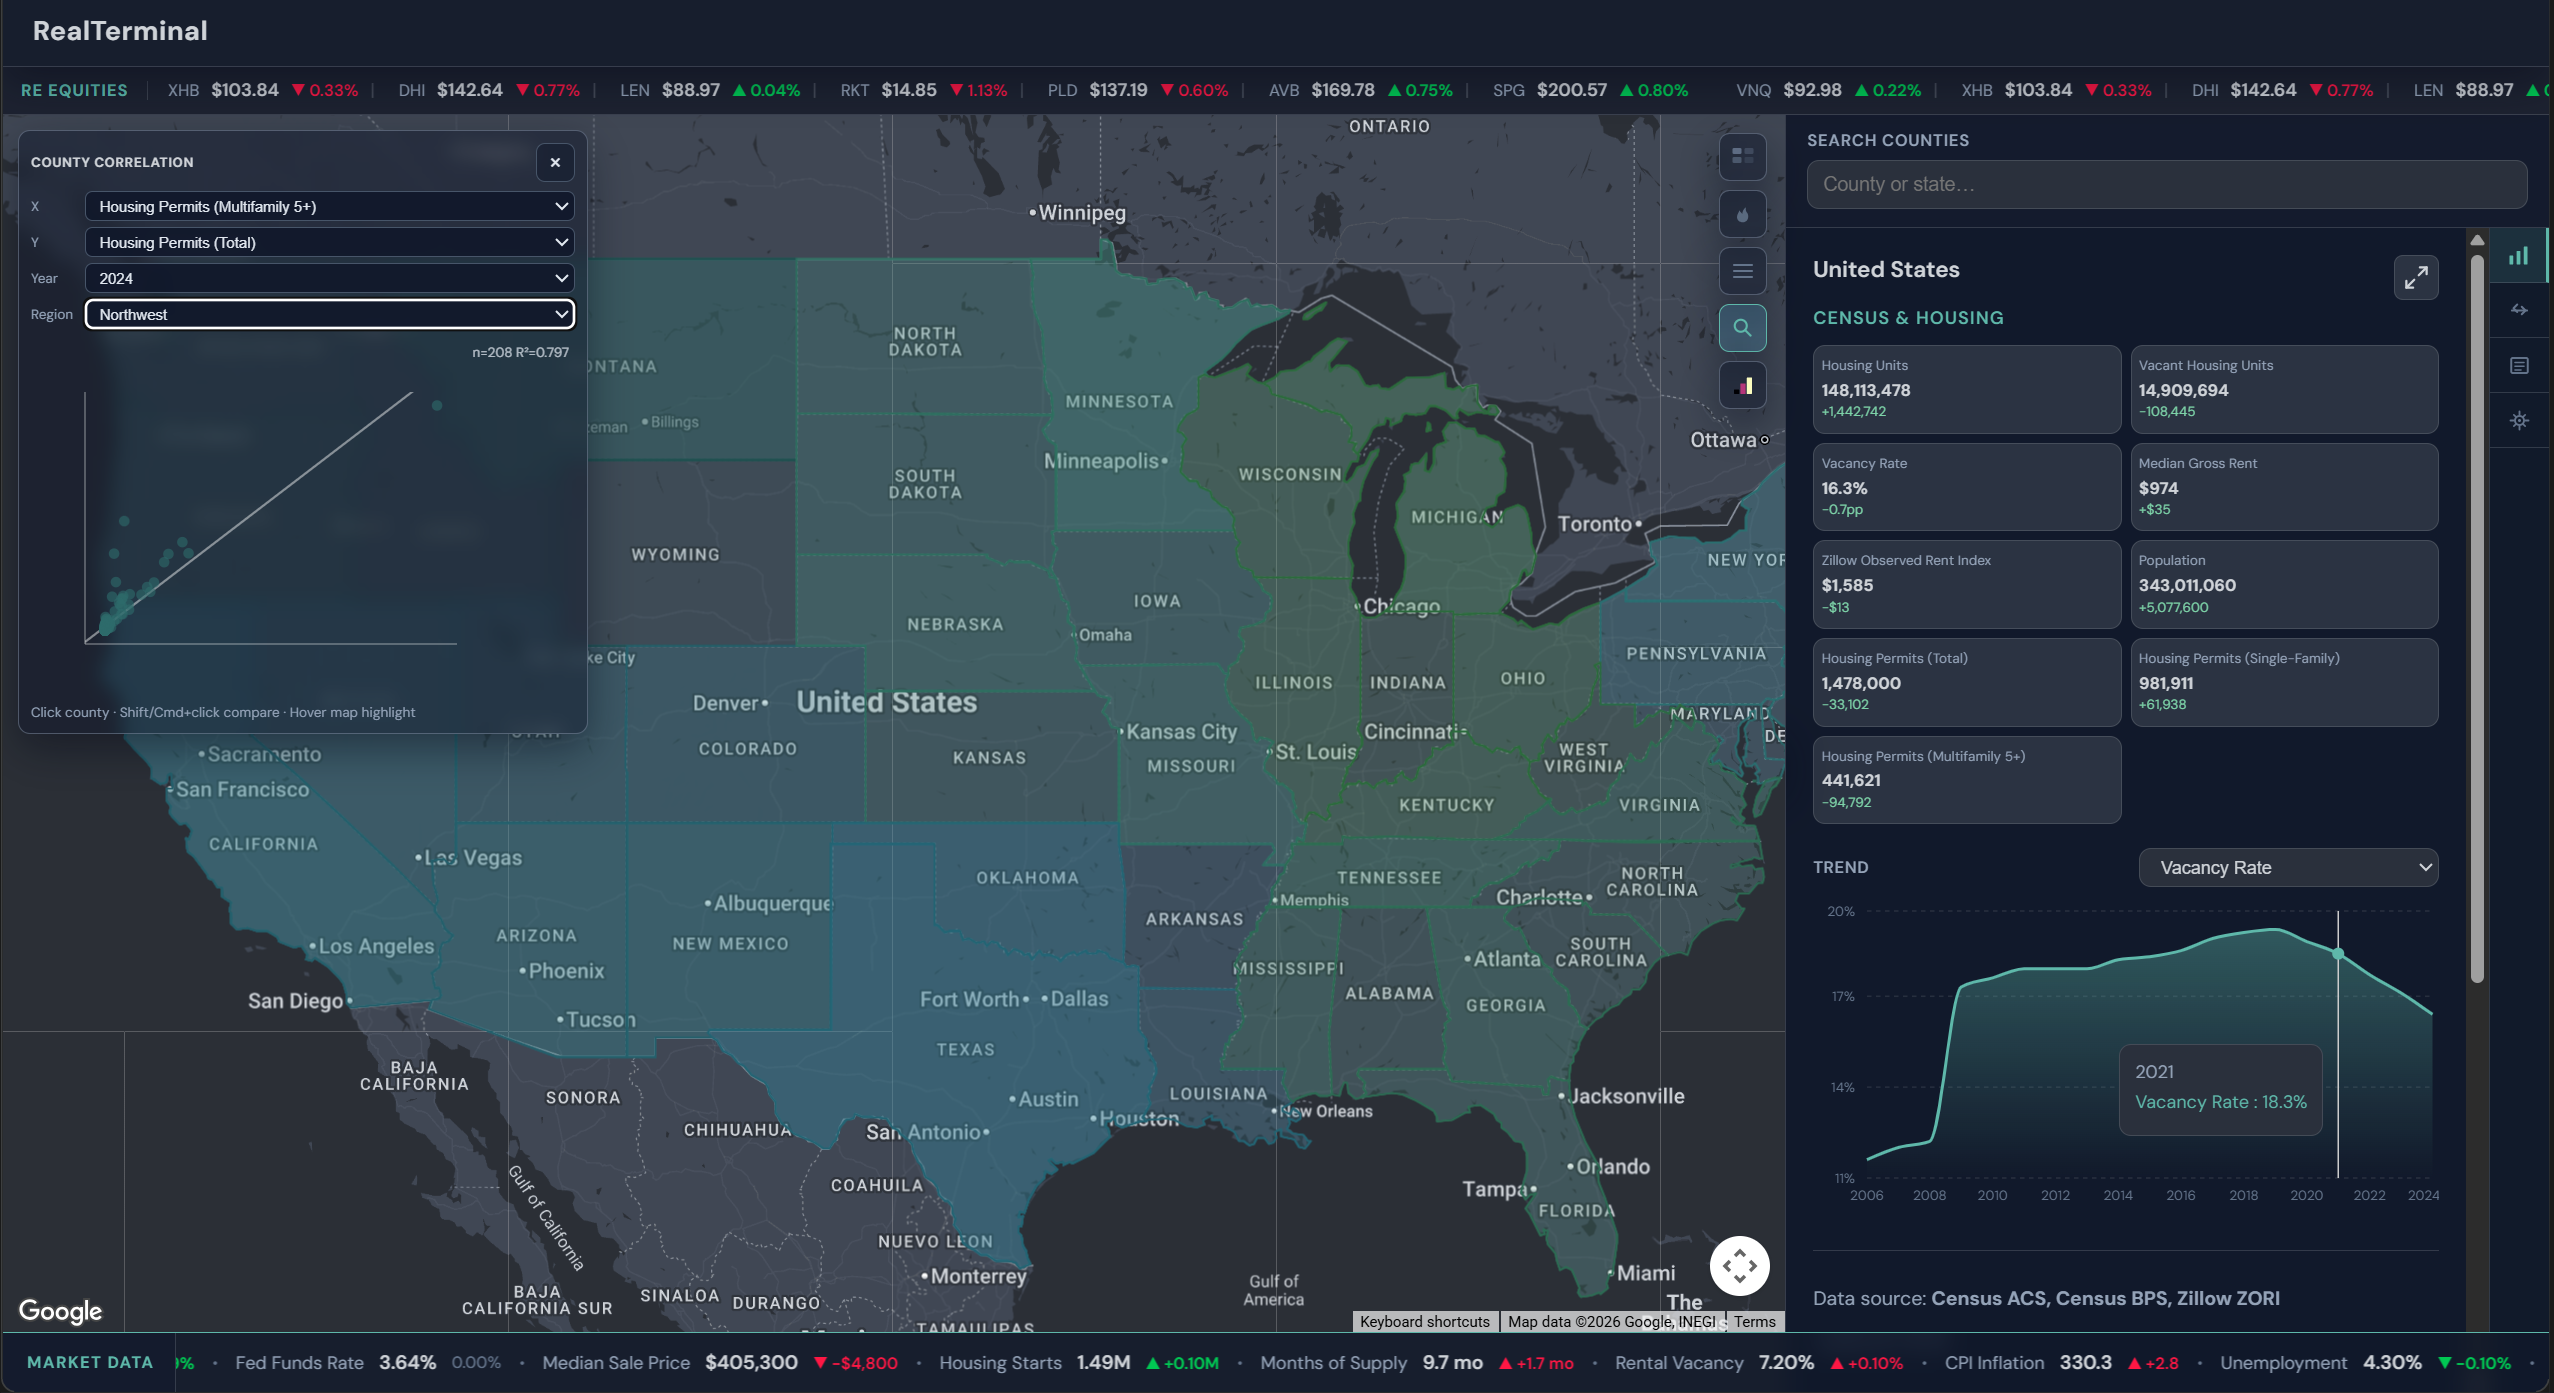
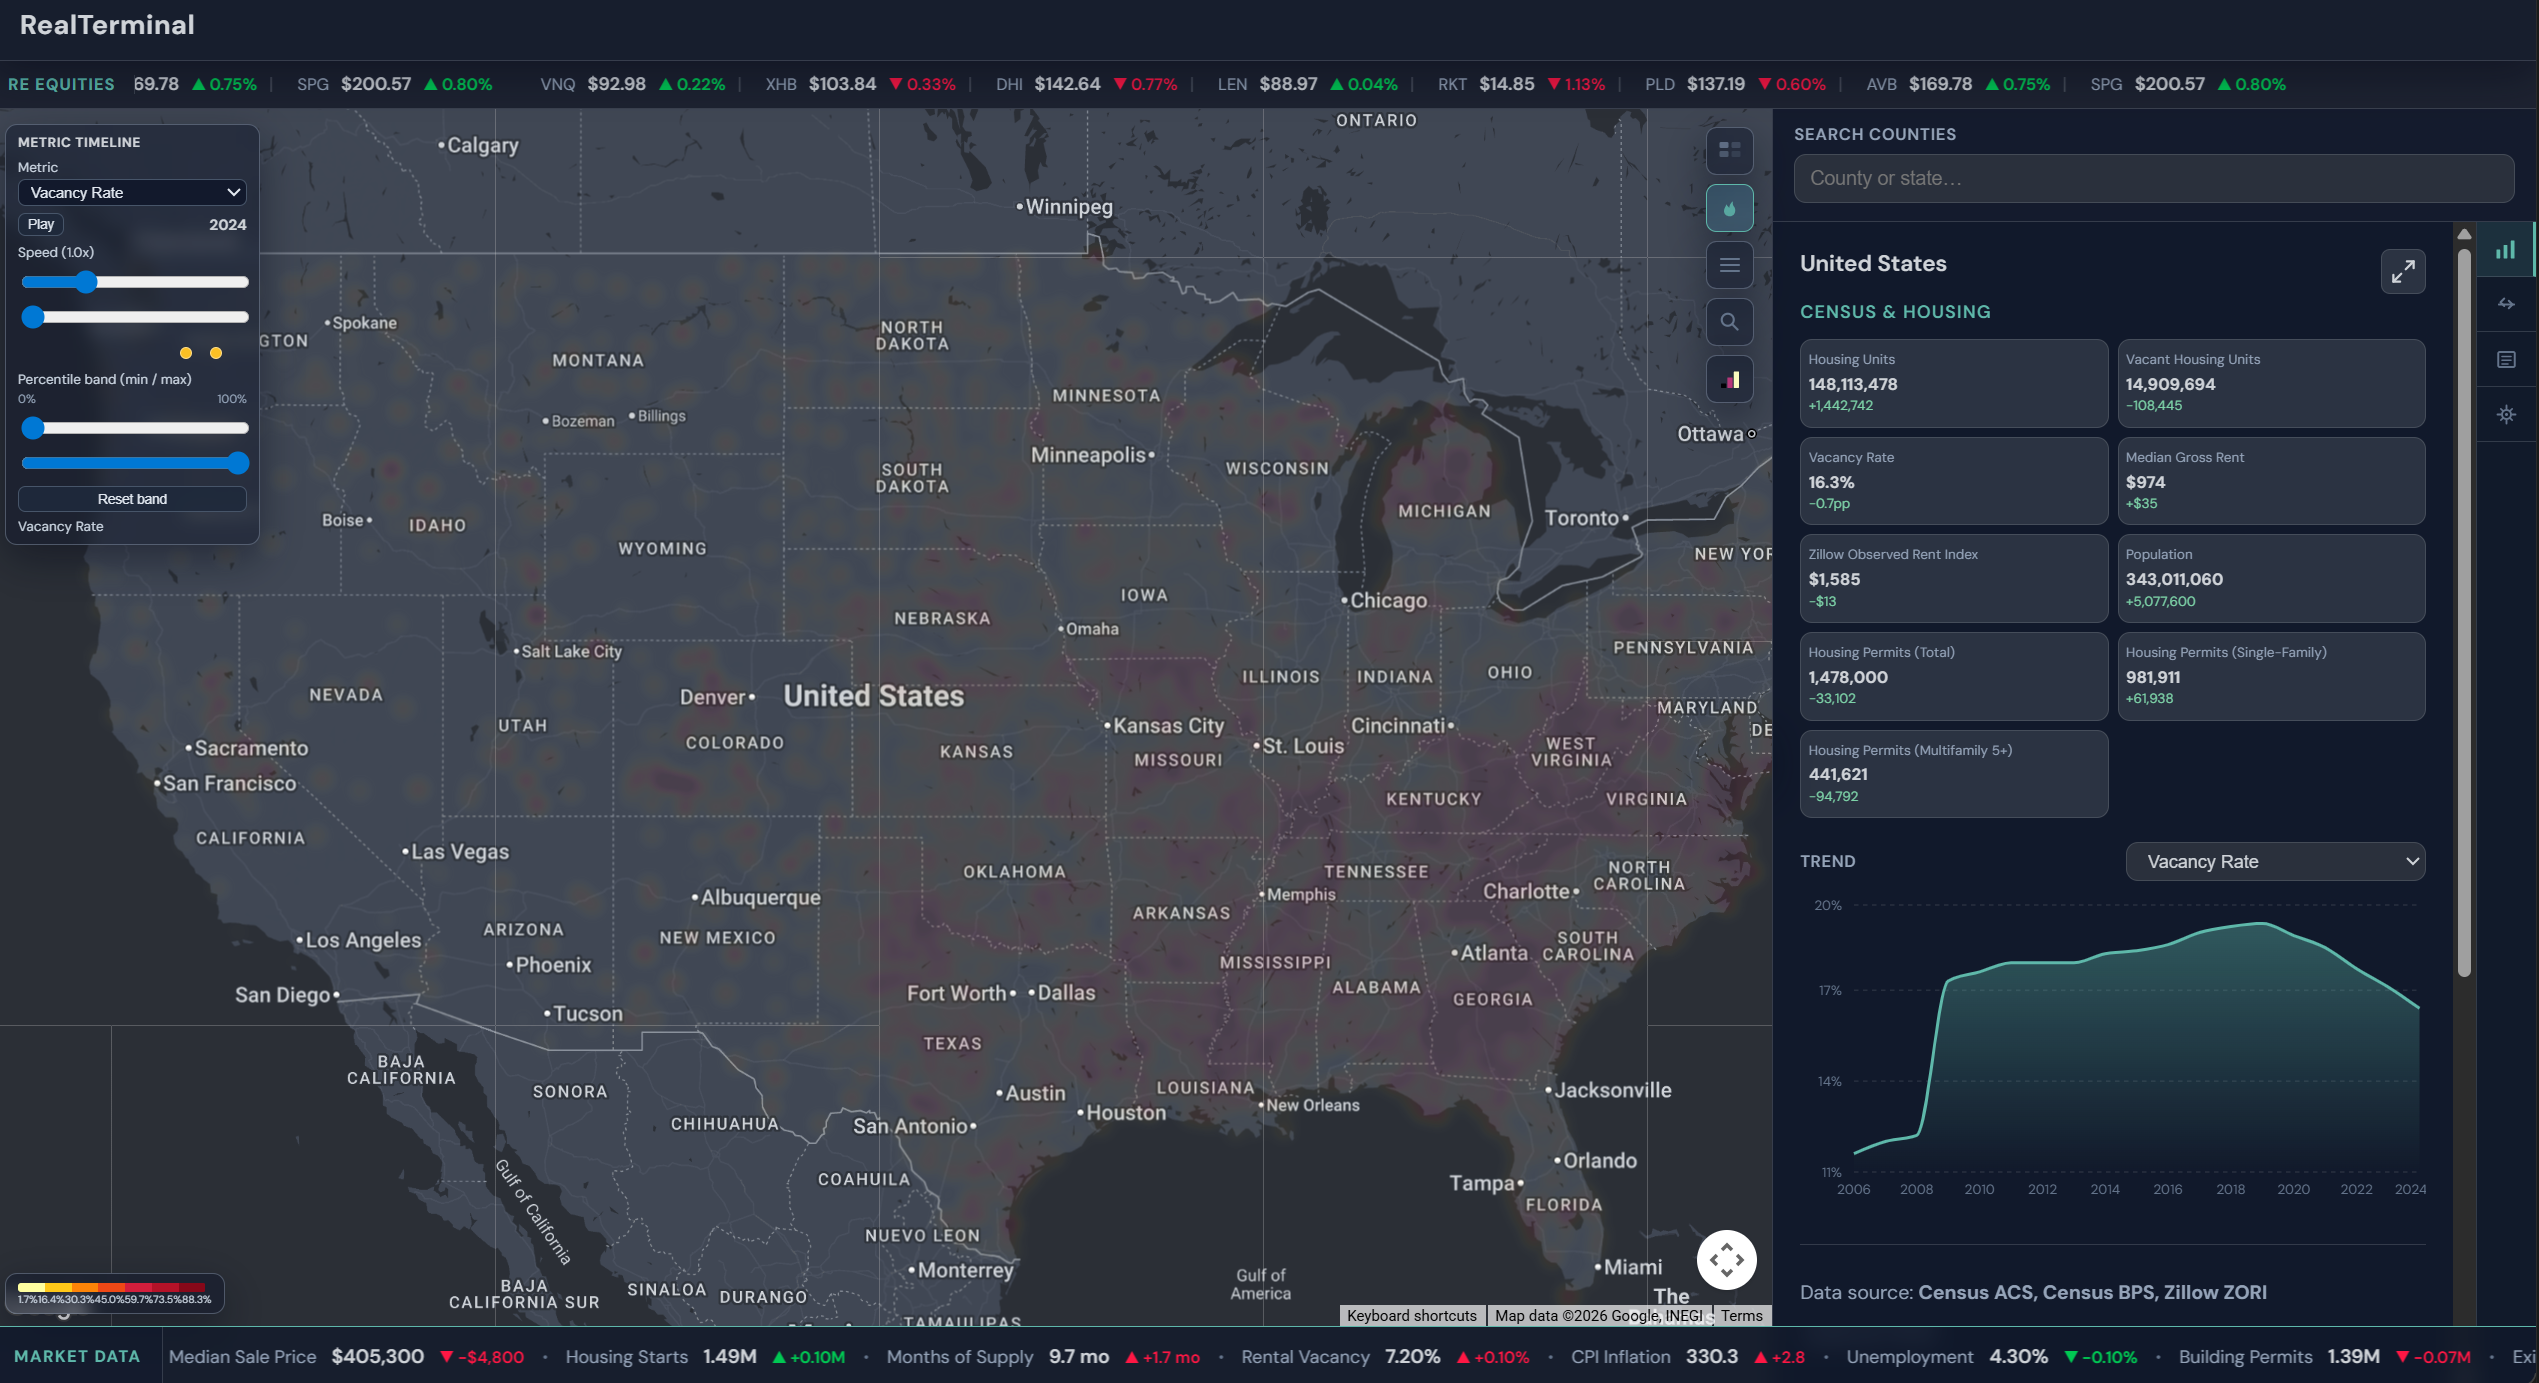
- Frontend: React and TypeScript (Vite), Google Maps for the map, heatmaps, choropleth, rankings, correlations, and a fullscreen analytics dashboard.
- Backend: FastAPI with modular REST routes; Pydantic settings for API keys; async lifespan tasks for scheduled refreshes (e.g. Redfin, stocks, news) and startup retries.
- Data: PostgreSQL + PostGIS via Docker for persistent geography and migration data; agency data from FRED, public Redfin county data, HUD, BLS, BEA, FFIEC HMDA, OpenFEMA NRI downloads, NewsAPI with RSS fallback, and Google Gemini for chat—all integrated behind one API surface the UI consumes through typed hooks.
Challenges we ran into
- Unifying geography: aligning county FIPS, state codes, and “what the map selected” with what each federal API expects.
- Operational constraints: rate limits and courteous pacing (e.g. HUD), cache TTLs for slow-moving datasets (HMDA especially), and reliable startup when external services are flaky.
- UX density: packing many indicators into a readable layout—tickers, panels, map tools, and AI—without overwhelming first-time users.
Accomplishments that we're proud of
- A coherent context model that powers both the UI and Gemini, so analysis stays grounded in the same numbers users see on screen.
- FEMA NRI integrated via authoritative bulk downloads instead of a fragile one-off API call.
- Background refresh and caching strategies that keep the app responsive while still pulling from many live sources.
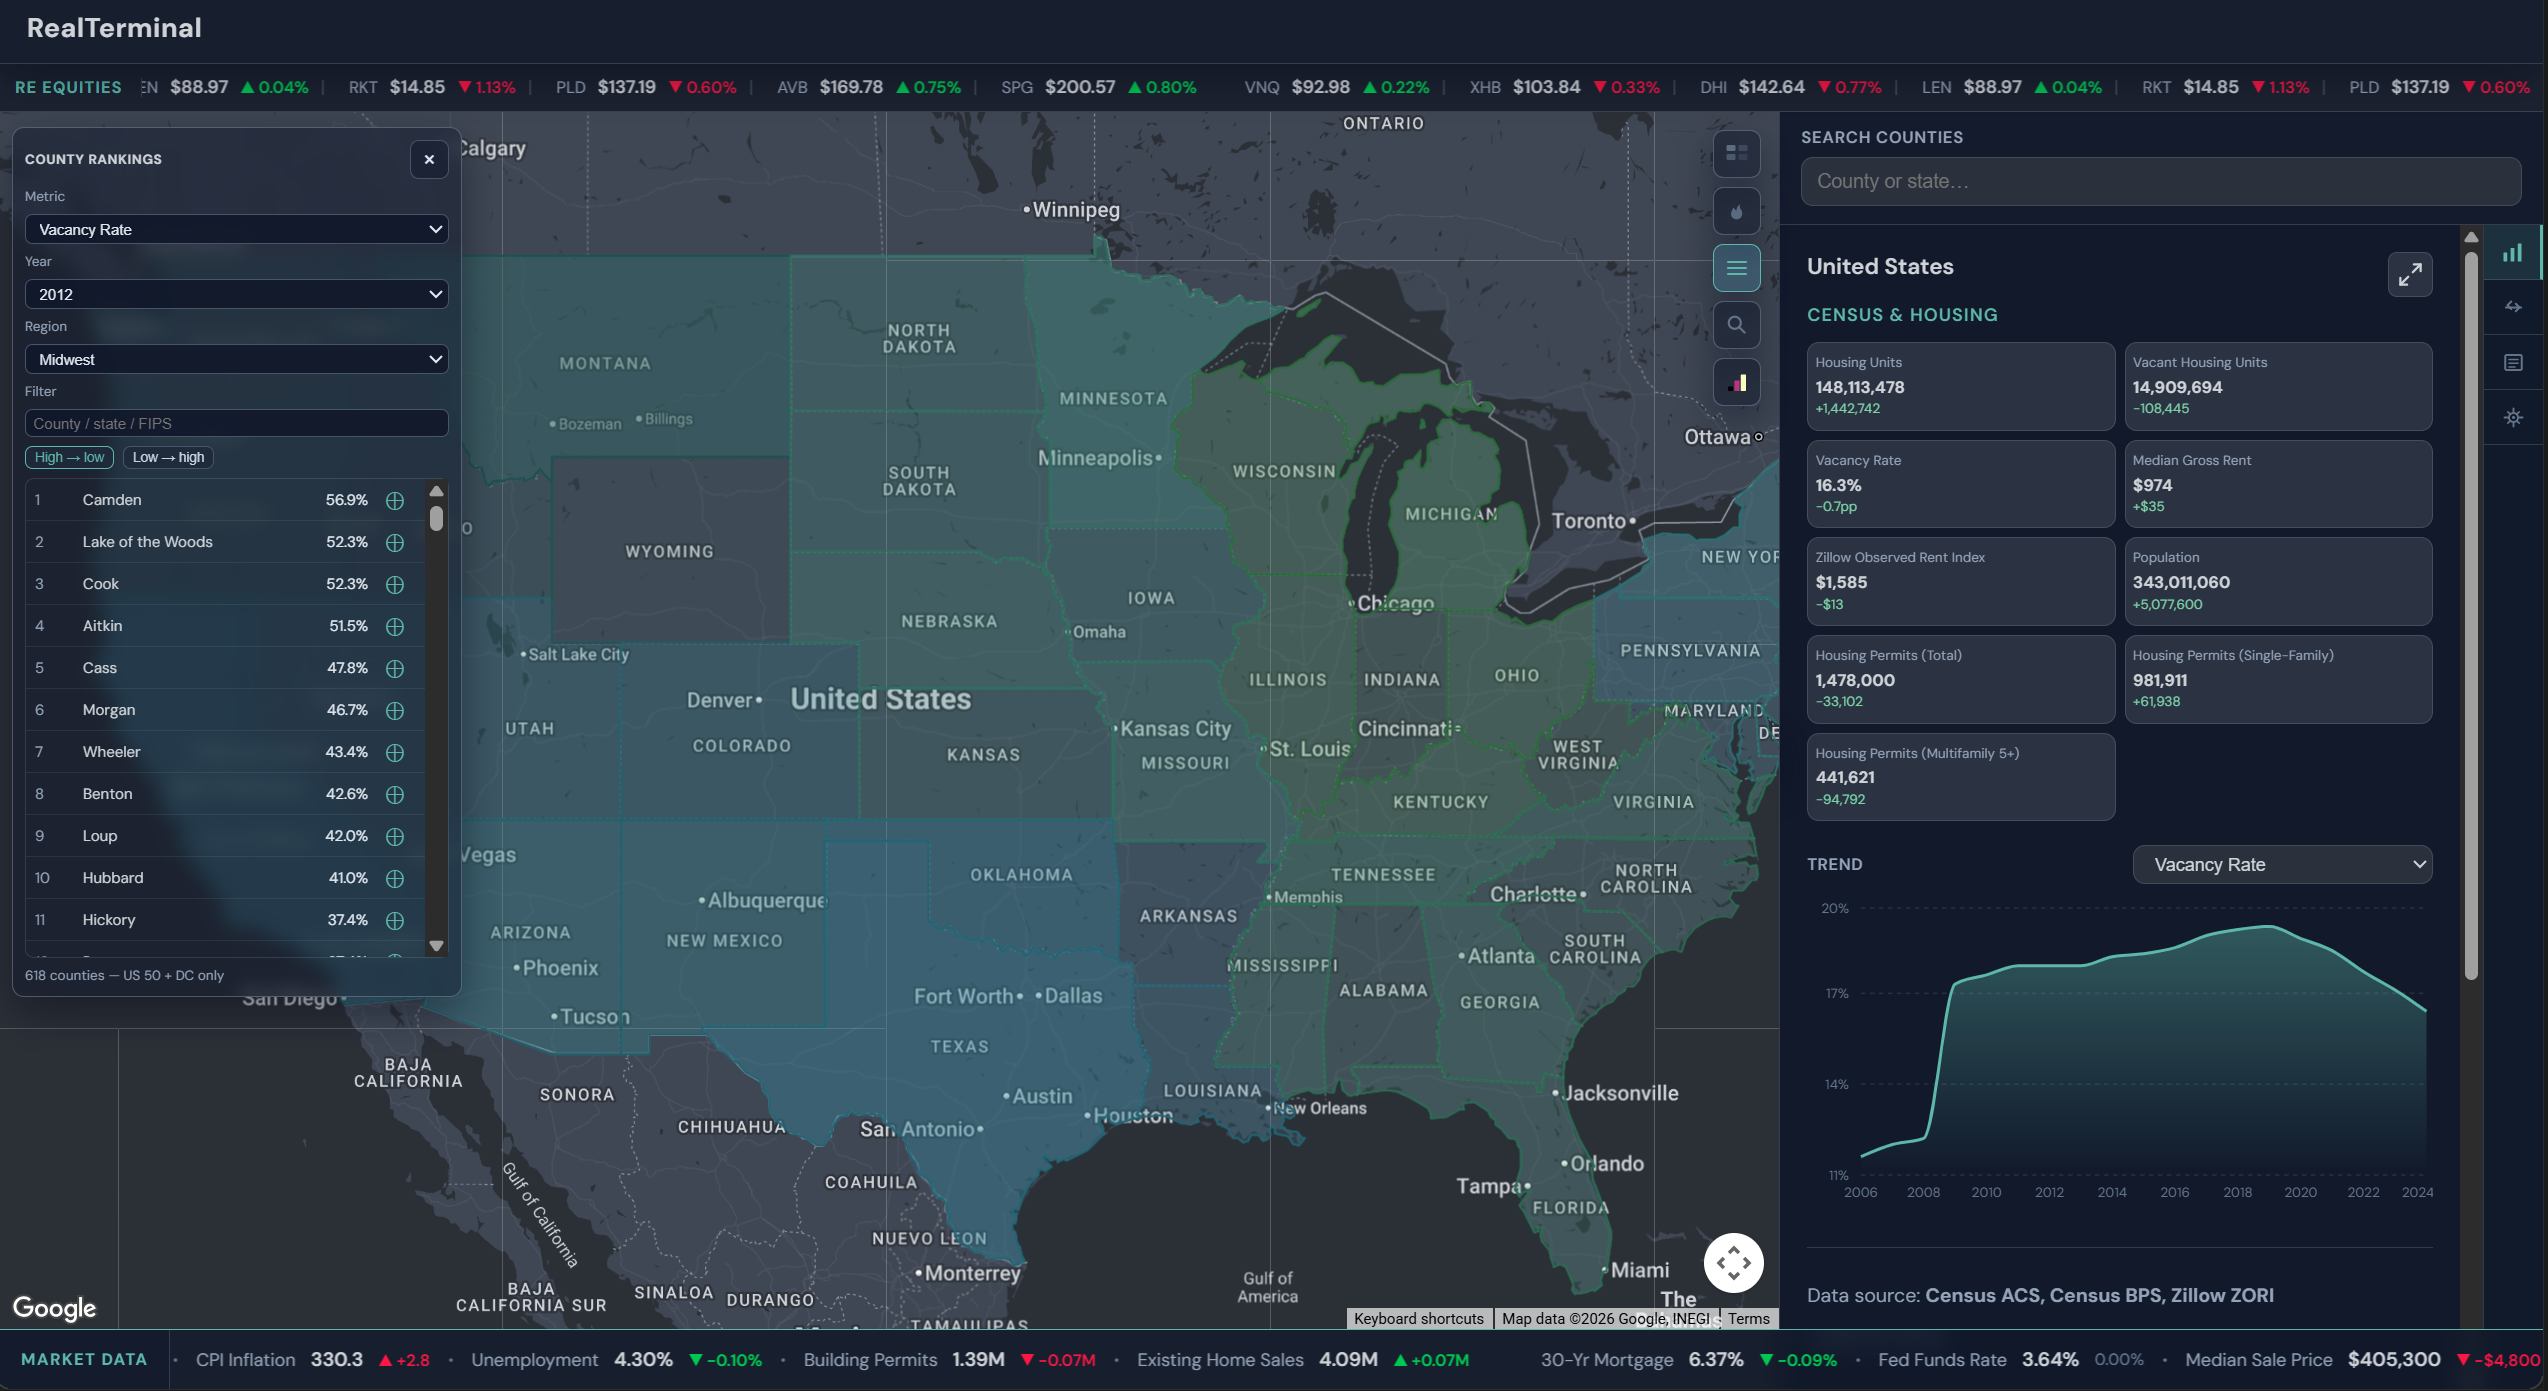
- Map-linked analytics: rankings and correlations that tie charts back to counties users can explore immediately.
What we learned
- Federal data is powerful but heterogeneous: each agency has different identifiers, latency, and semantics—real engineering is normalization and honest labeling (e.g. HMDA lag vs. spot indicators).
- PostGIS + a thin API layer pays off when you need migration and spatial workflows alongside REST integrations.
- LLMs shine when given structured, user-visible context—not when they free-associate from the open web.
What's next for Real Terminal
- User accounts and saved watchlists for counties and metrics.
- Alerts when key series cross thresholds (rates, unemployment, risk, rents).
- Deeper time-series and export (CSV/PDF) for diligence workflows.
- Performance passes on heavy map layers and broader geographic coverage where data allows.
Built With
- bea-api
- bls-api
- docker
- fastapi
- fema-openfema
- ffiec-hmda-(cfpb-data-browser)
- fred-api
- google-gemini-api
- google-maps-platform
- hud-fair-market-rents-api
- market
- newsapi
- postgis
- postgresql
- public
- pydantic
- python
- react
- redfin
- rss
- sqlalchemy
- typescript
- u.s.-census-bureau-api
- vite
- yahoo-finance

Log in or sign up for Devpost to join the conversation.