Try it in a minute: open rtr-qloo.vercel.app and click Run the demo. It reads a set written for Texas in front of a Brooklyn crowd, on live Qloo data. Then open Rewritten set, Tour map and Receipts. The first read takes about 40 seconds while it makes over 100 live Qloo calls; repeat reads come from cache.
Inspiration
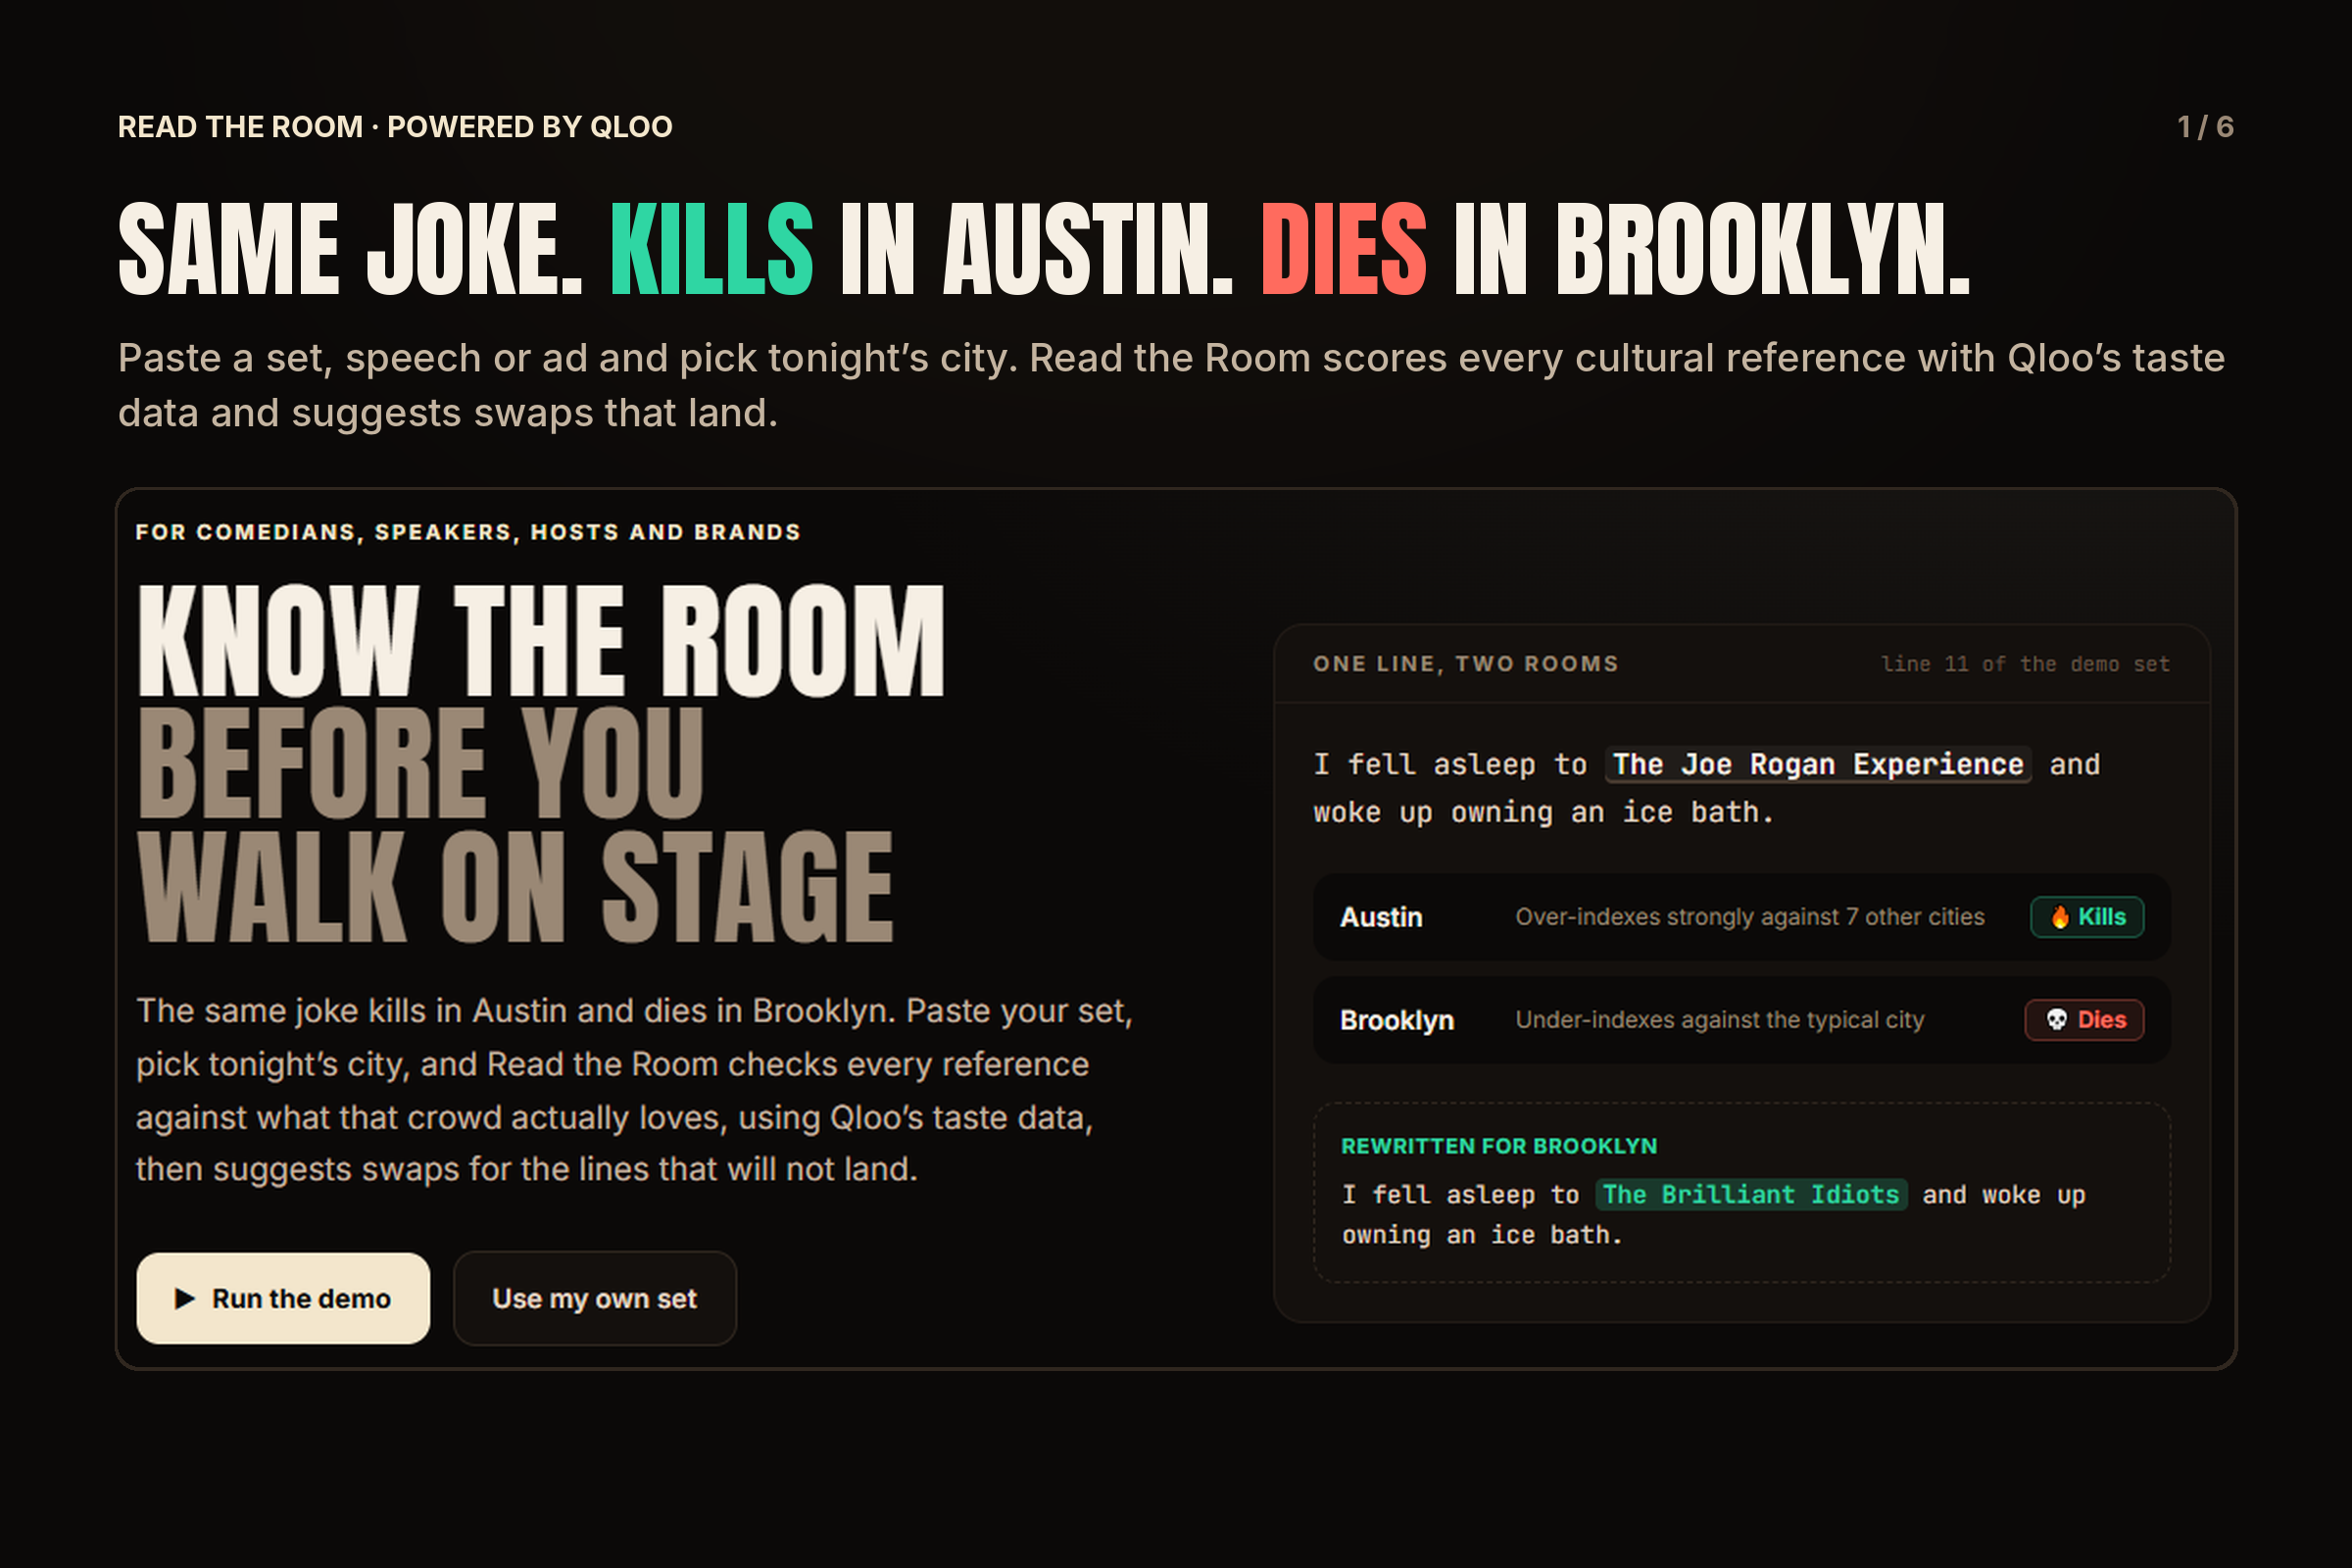
Every touring comedian knows the feeling: a joke that destroyed in Austin gets total silence in Brooklyn. The material didn't change. The room did.
Comedians, keynote speakers, sales teams and agencies all have the same problem. They write one script and perform it for dozens of different crowds. Today the only way to know what a room shares is experience, gut feeling, or bombing. When I asked an AI chatbot whether a reference would land in a given city, it answered confidently in stereotypes, and nothing it said could be checked.
The Qloo Agentic Hackathon asked for something that only works because it knows what people love. Knowing tonight's room is exactly that problem. You can't reason your way to what Salt Lake City over-indexes on. You have to measure it.
What it does
Paste a set, speech or toast, then pick a city and the kind of room (comedy club, college show, corporate gig, casino theater). The agent:
- Finds every cultural reference in the text: shows, artists, brands, places, people, podcasts, games.
- Matches each one to an entity in Qloo's taste graph, and refuses fuzzy matches whose names don't agree.
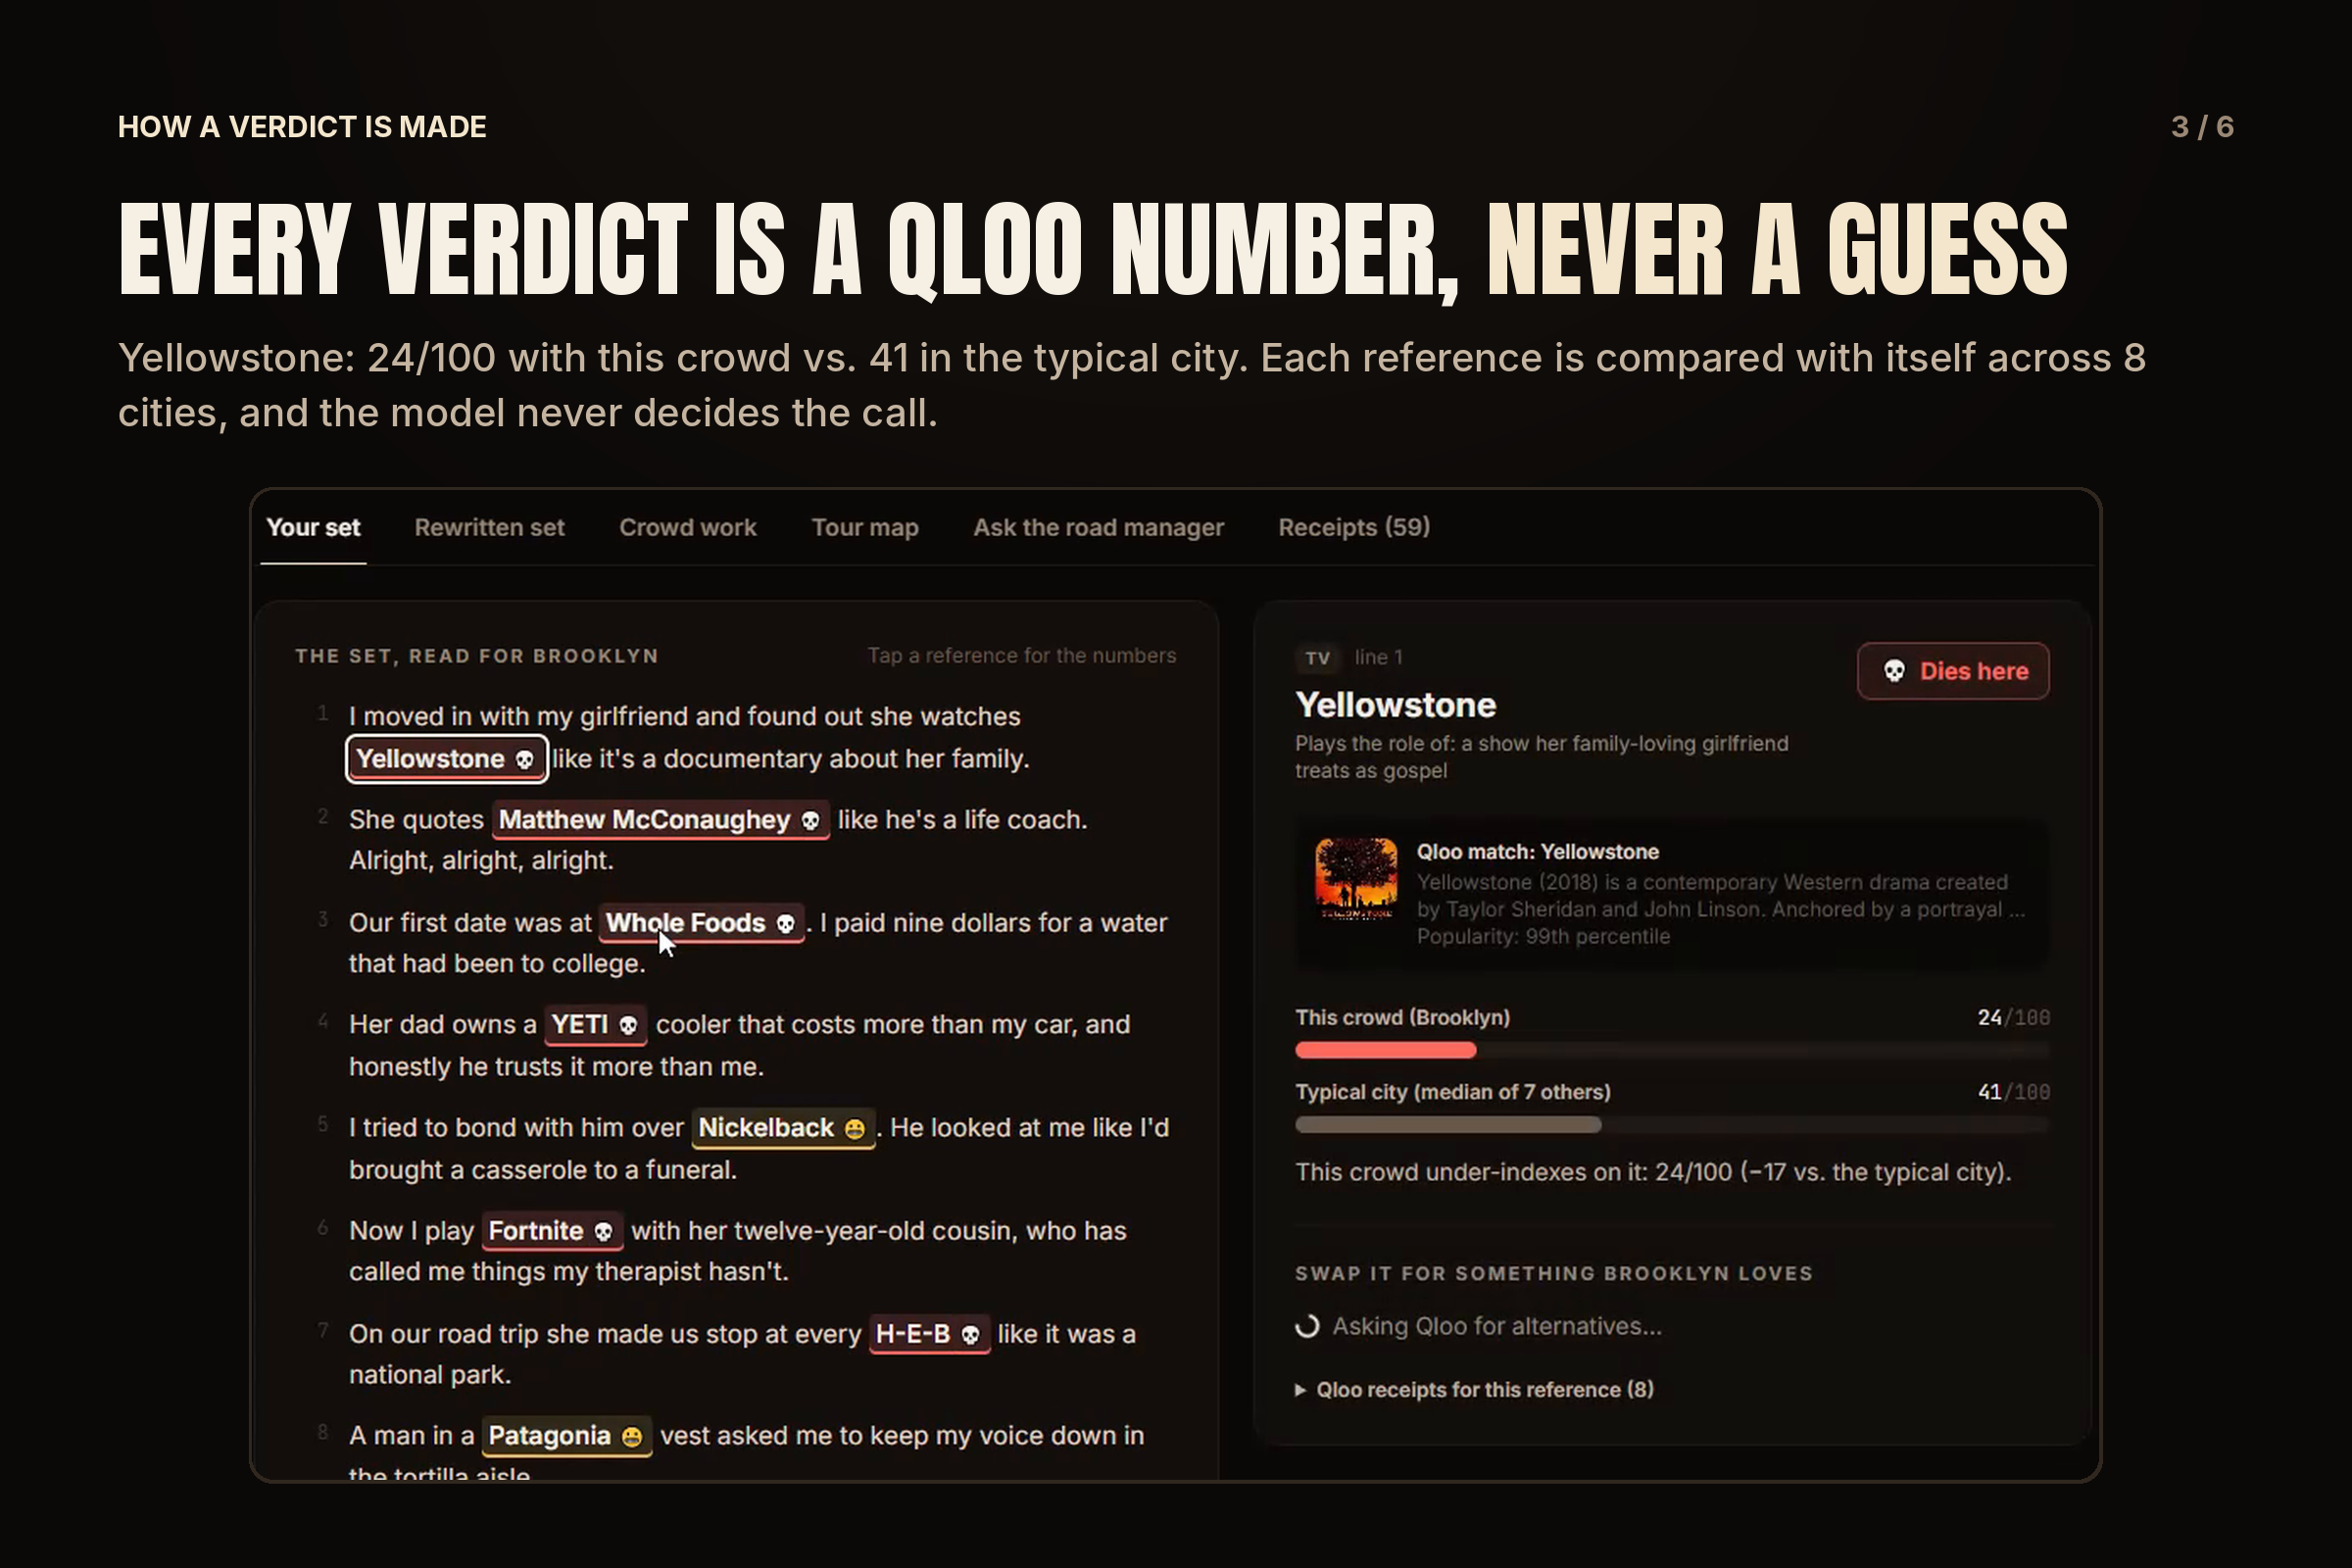
- Scores each reference for tonight's crowd against the same reference in 7 other US cities: 🔥 kills, 😬 risky or 💀 dies here. The room's age band then shifts the call when a reference's audience clearly skews toward or away from that age.
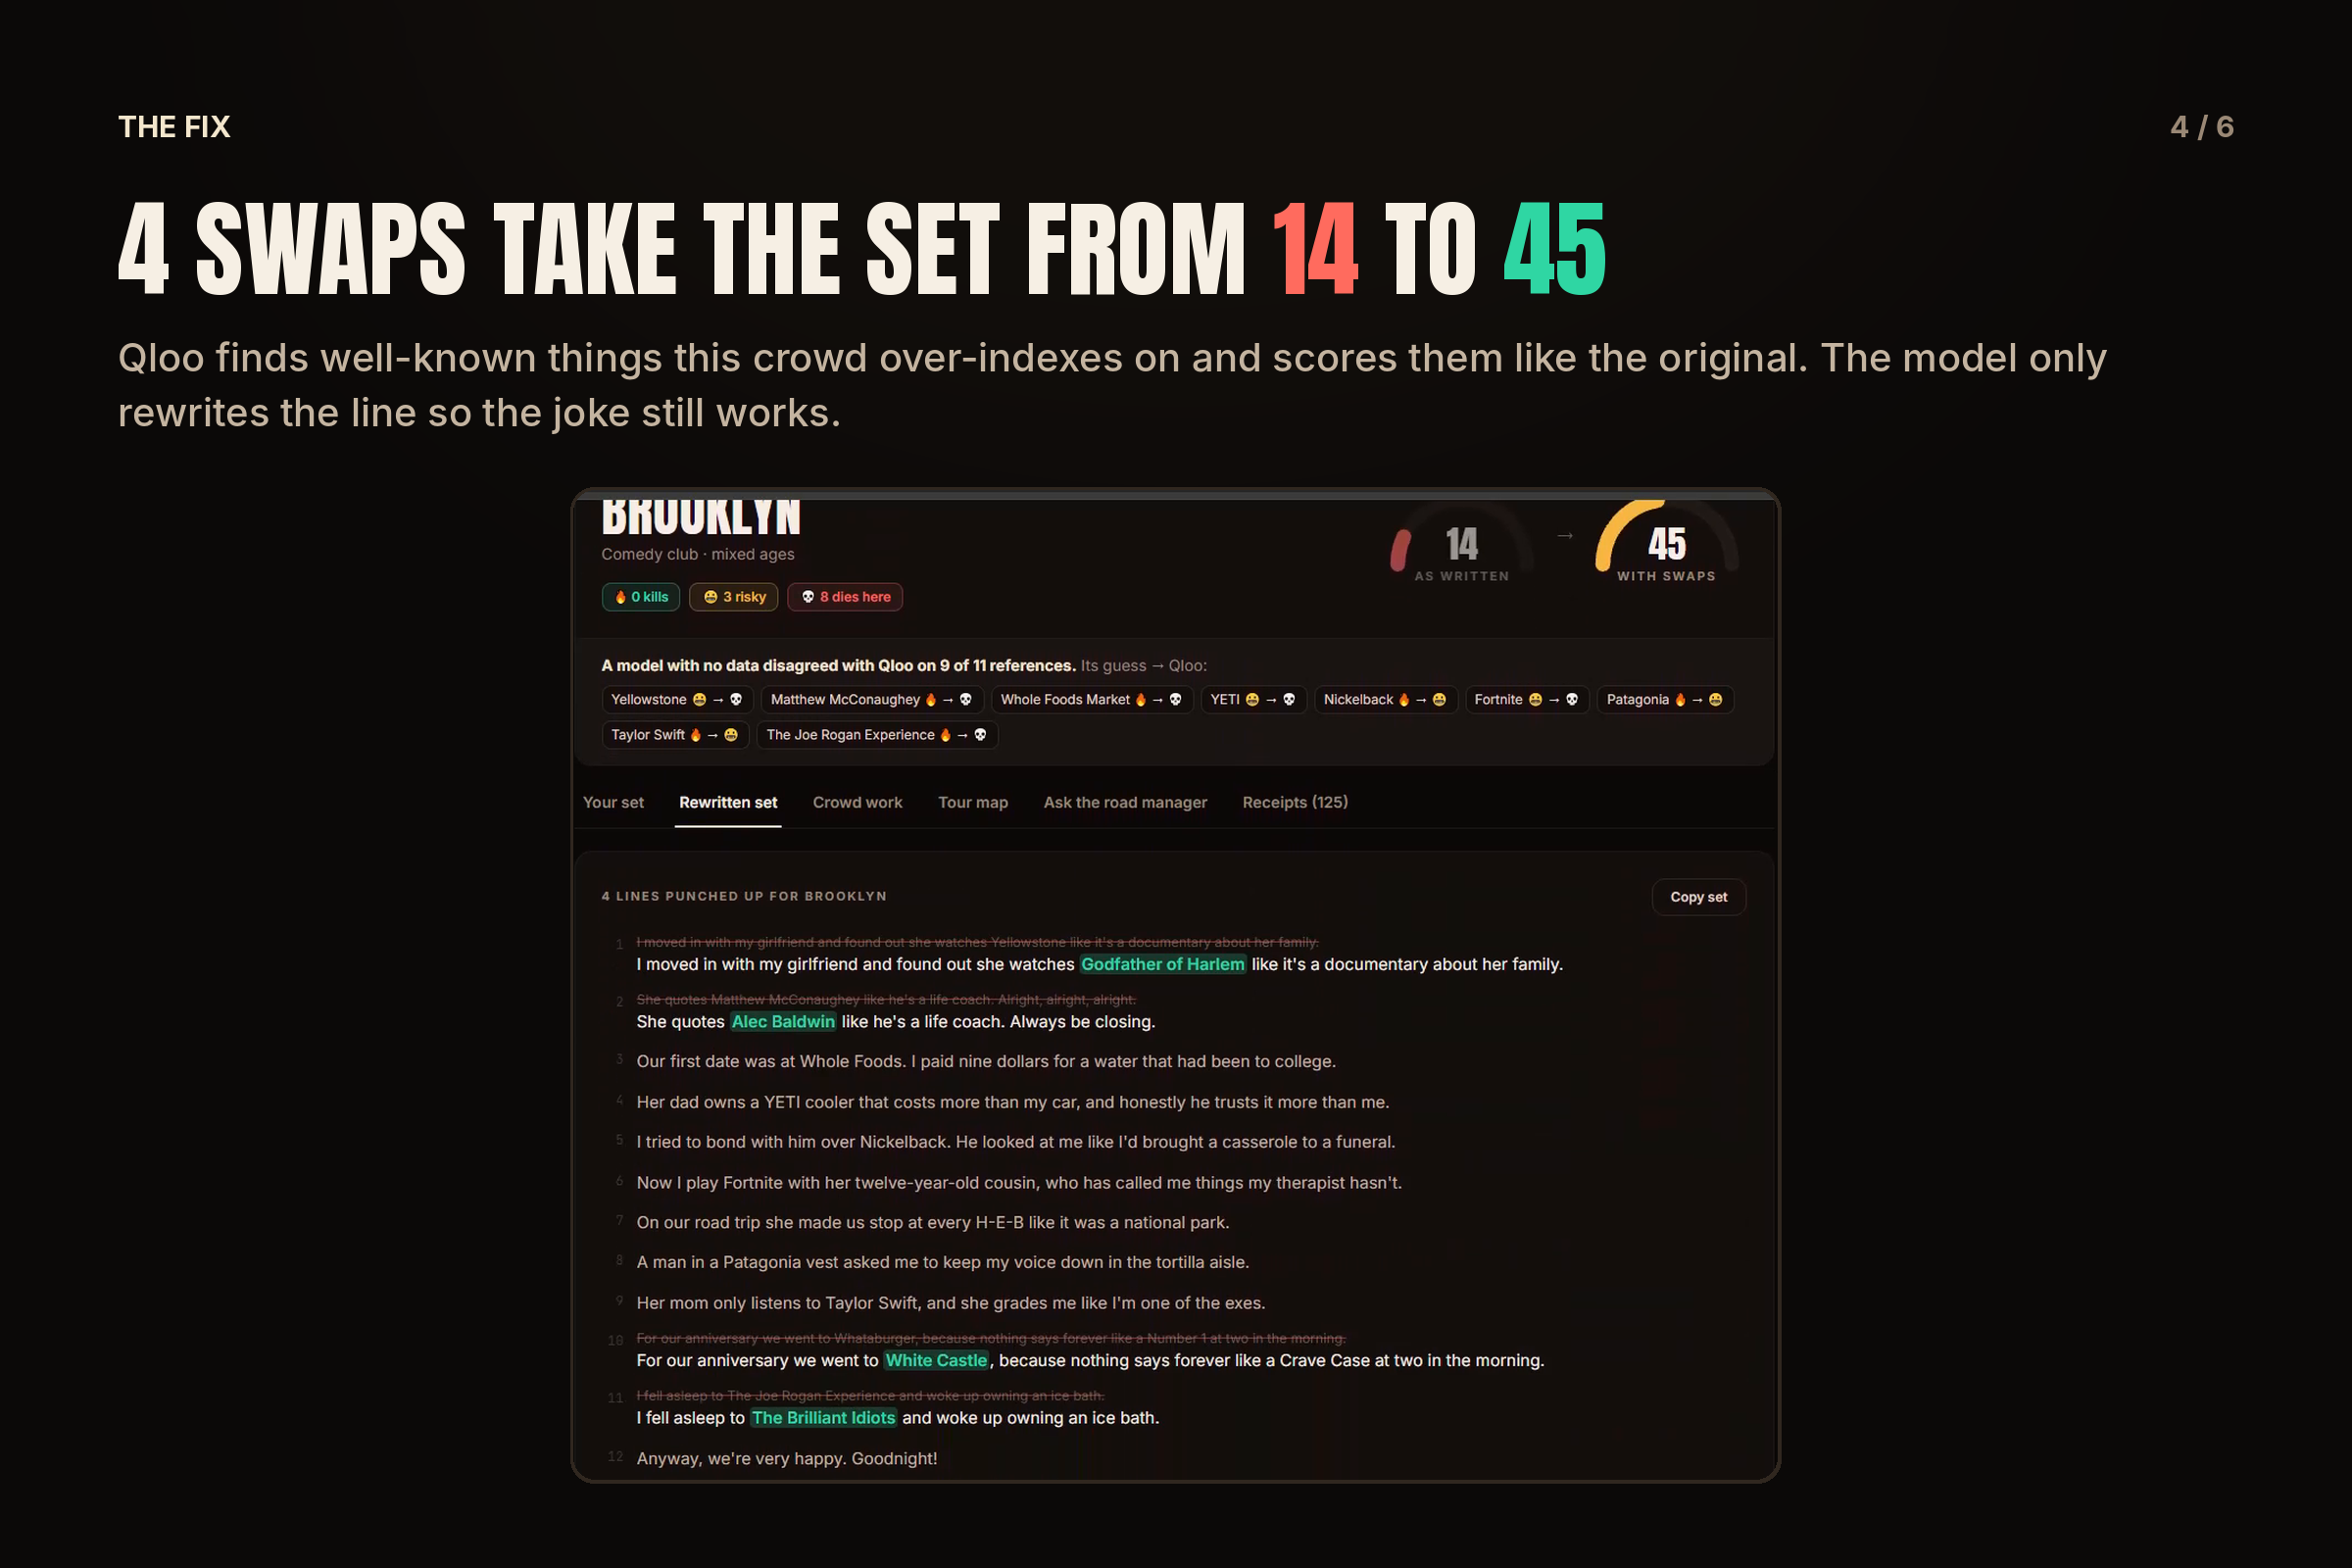
- Swaps weak references for well-known ones this crowd actually loves, and rewrites the line so the joke still works.
- Profiles the room: the TV themes and music genres the crowd over-indexes on, turned into a delivery tip, plus crowd-work openers built from local favorites.
- Tour map: the same set scored across up to 8 cities, showing where it plays best.
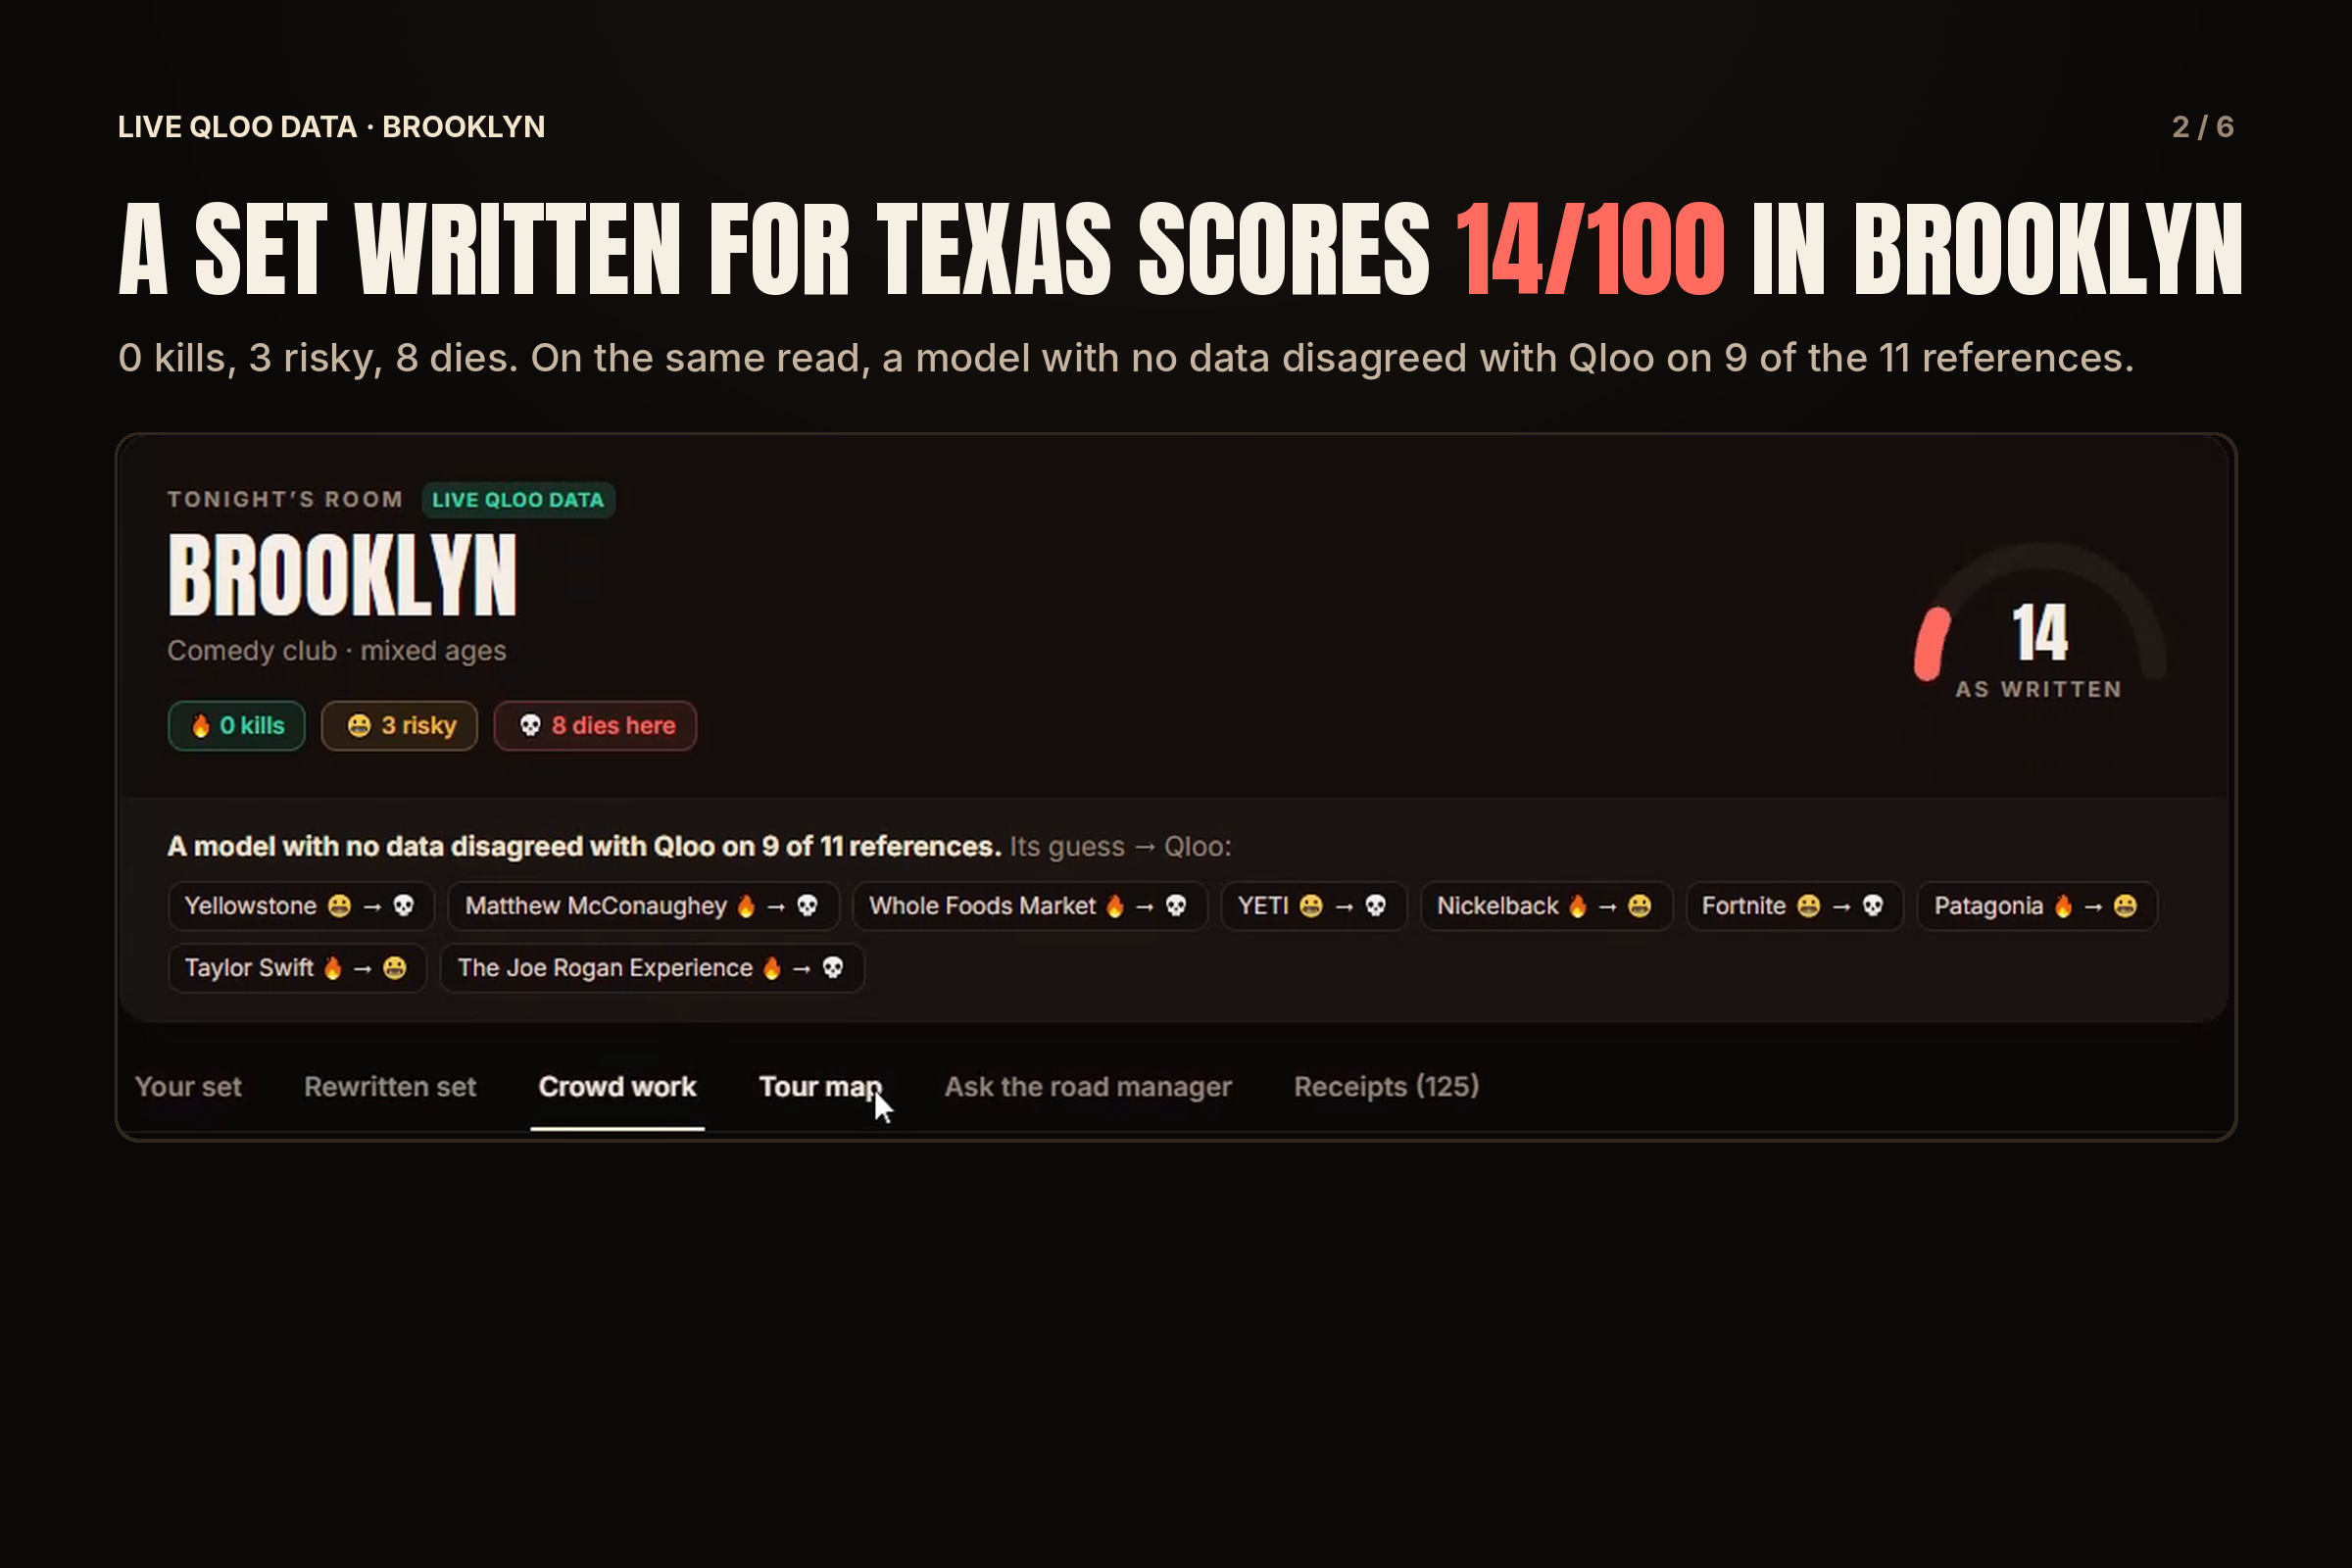
The demo shows it in one set. A stand-up set written for Texas scores 14/100 in Brooklyn as written: 0 kills, 3 risky, 8 dies. "I fell asleep to The Joe Rogan Experience and woke up owning an ice bath" is a 🔥 in Austin and a 💀 in Brooklyn, so the agent swaps in a podcast Brooklyn actually over-indexes on. Yellowstone becomes Godfather of Harlem, and Whataburger becomes White Castle, with the "Number 1 at two in the morning" detail rewritten to fit ("a Crave Case at two in the morning"). Four rewritten lines take the set from 14 to 45.
On the same read, a model with no data guessed the verdicts too: it disagreed with Qloo on 9 of the 11 references.
Two more ways to use it:
- The Road Manager, a chat agent that calls Qloo tools on its own to answer questions like "I'm in Brooklyn Friday and Nashville Saturday, which bits should I swap?"
- An MCP endpoint (
https://rtr-qloo.vercel.app/api/mcp), so Claude, Cursor or any MCP client can use the same Qloo tools inside an agent it already has.
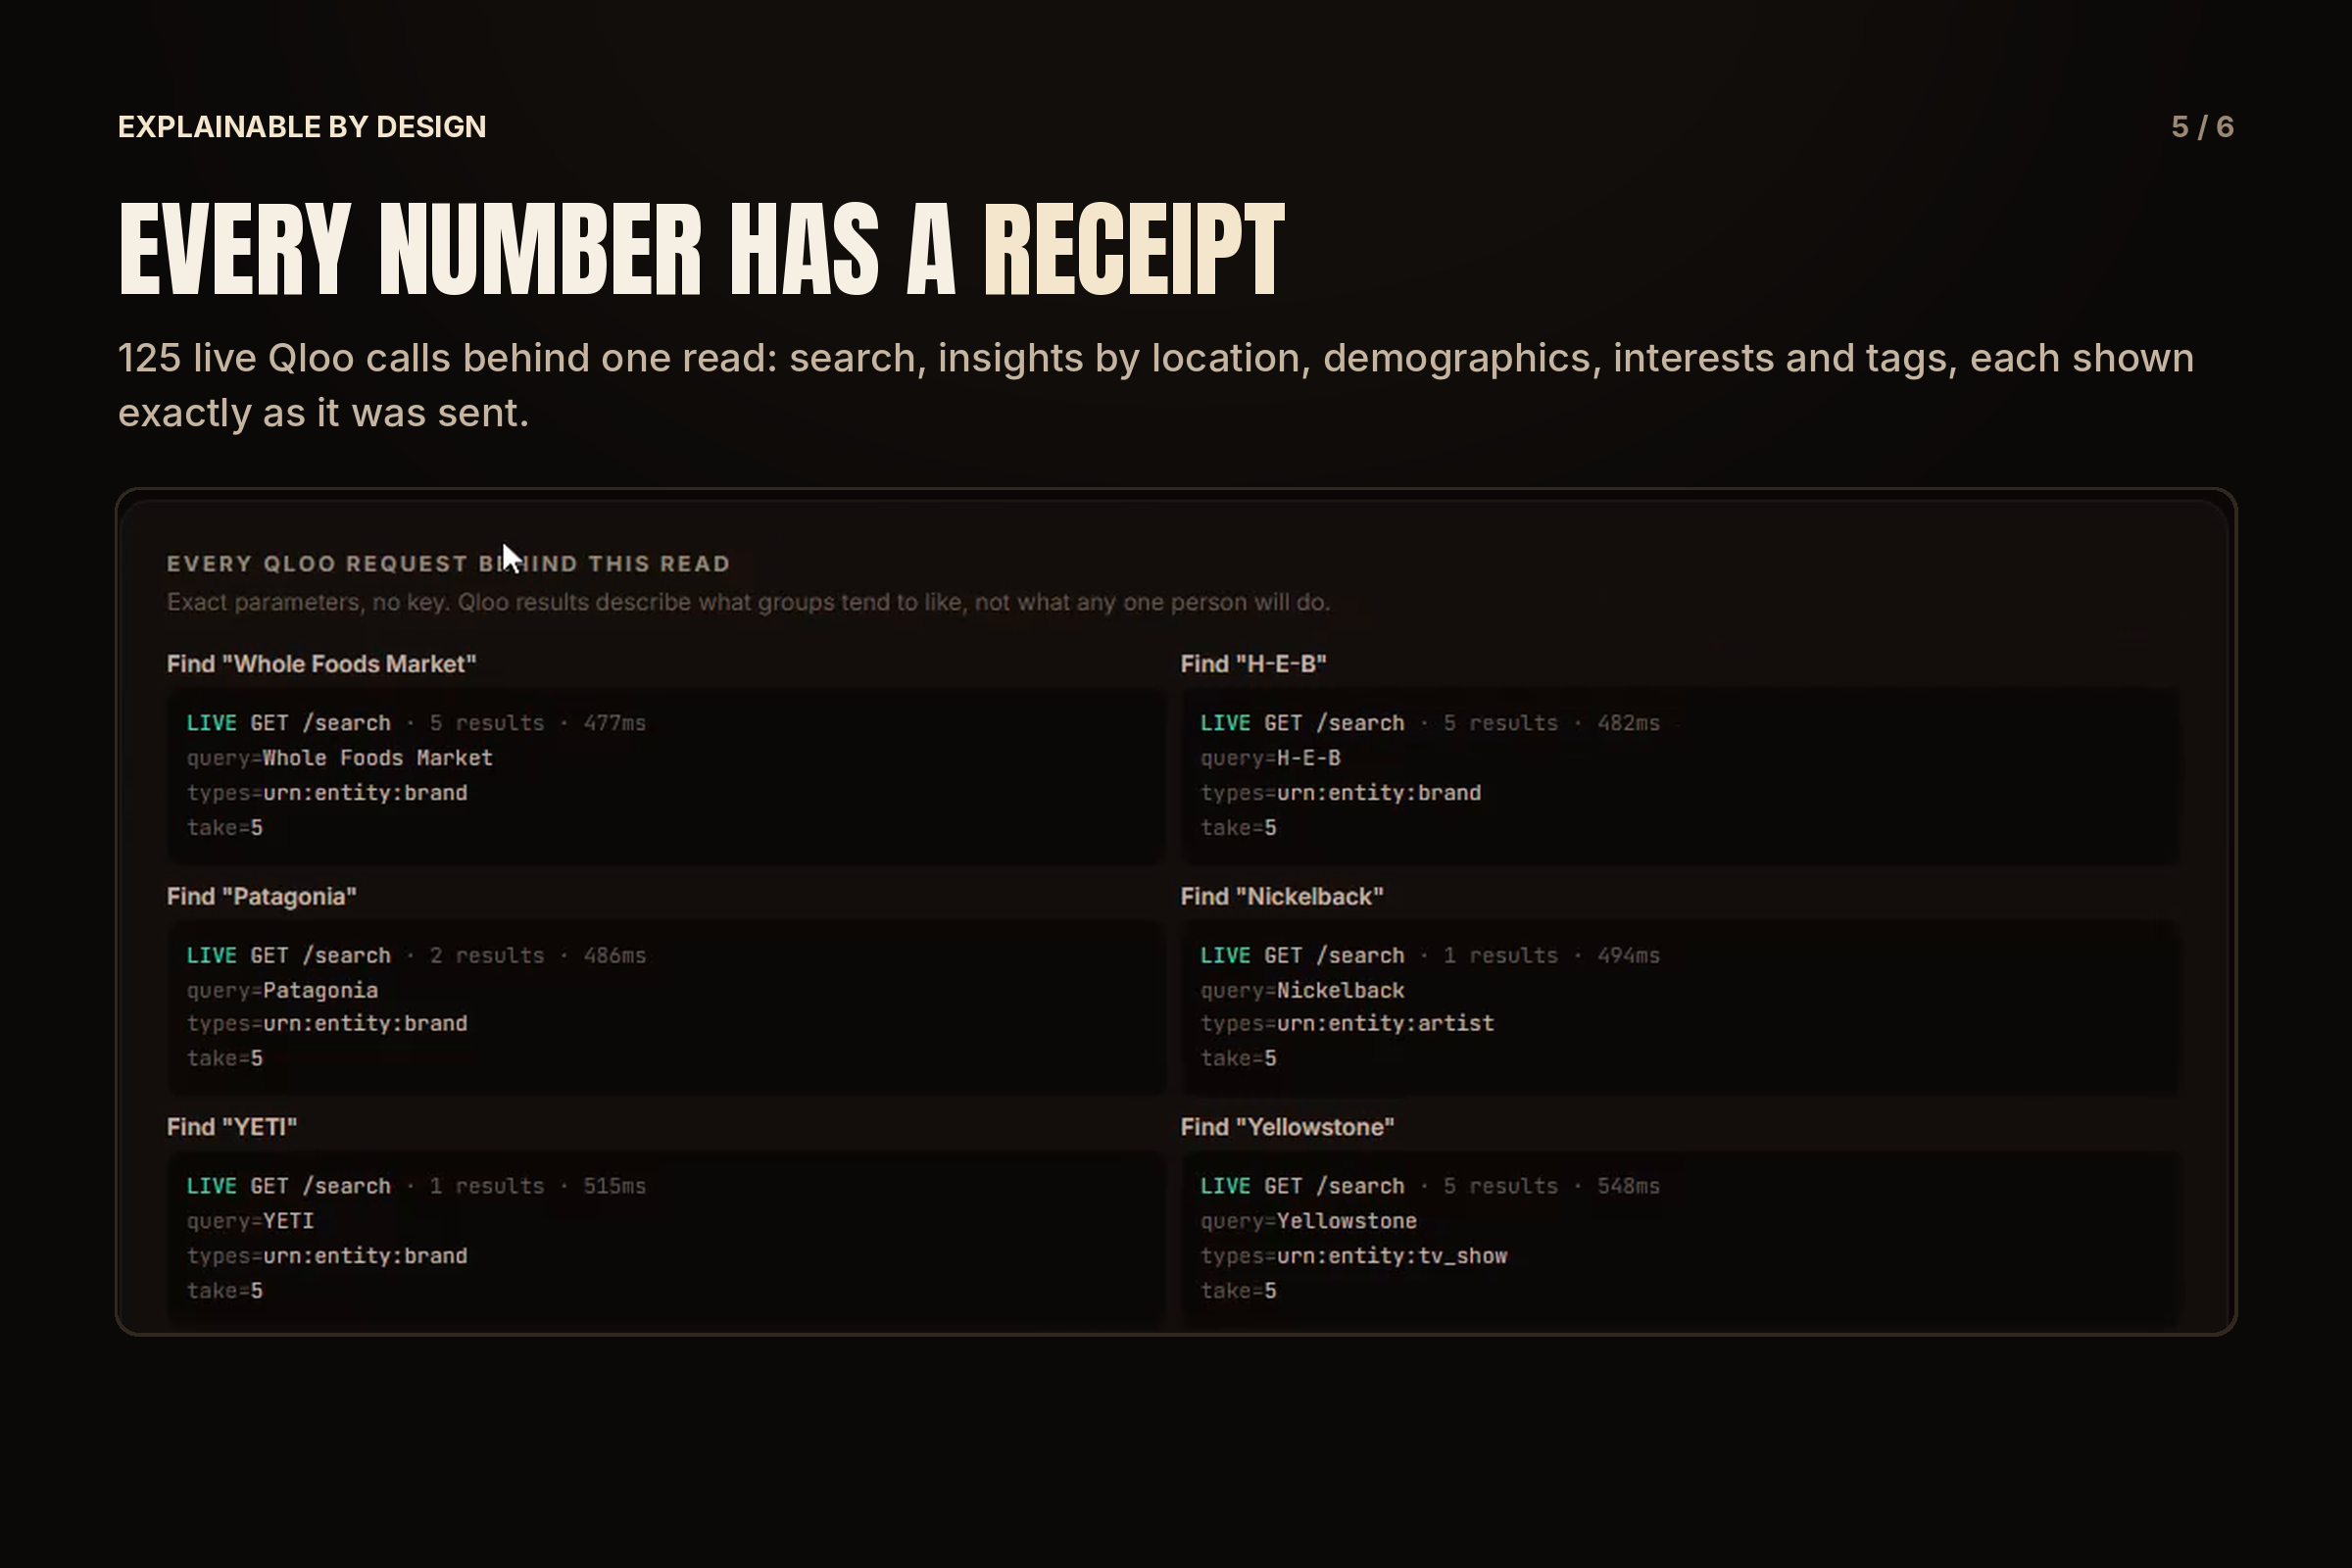
Every number links to a receipt: the exact Qloo request behind it.
How I built it
I built Read the Room solo.
Stack: TanStack Start (React 19 and server functions) on Nitro, deployed on Vercel. The Qloo Insights API is only called from the server, so the key never reaches the browser. Qloo responses are cached server-side in Vercel's runtime cache, shared by every serverless instance. OpenRouter provides the model (DeepSeek), with strict JSON-schema outputs. Styling is Tailwind CSS v4.
The Qloo pipeline:
- Resolve a reference:
GET /searchwithtypes=urn:entity:<kind>. A hit only counts if its name agrees with the reference; otherwise related categories are tried (sports teams and festivals are brands in Qloo). - Score it for the crowd:
GET /v2/insightswithfilter.results.entitiesandsignal.location.query. - Compare with other cities: the same call once per panel city (Nashville, Brooklyn, Austin, Salt Lake City, Los Angeles, Chicago, Boston, Atlanta).
- Age of the room:
GET /v2/insightswithfilter.type=urn:demographicsandsignal.interests.entities, which gives each reference's audience skew per age band. - Find swaps:
GET /v2/insightswithsignal.interests.entities=<weak ref>, the crowd's city andfilter.popularity.min=0.75. Every candidate is then scored exactly like the original. - Room taste profile:
GET /v2/insightswithfilter.type=urn:tag,filter.tag.types=urn:tag:theme:qlooandfilter.parents.types=urn:entity:tv_show, plus music genres for artists. - Crowd work:
GET /v2/insightswithfilter.type=urn:entity:placeandfilter.location.query, plus the TV, music, brands and movies the city over-indexes on.
The model never decides a verdict. I only use the model for what models are good at: reading a script and rewriting a line. The verdict comes from a fixed rule over Qloo numbers.
Qloo's affinity of a crowd for a well-known entity sits between 0.9 and 0.99999, so I read it on a log scale. For an entity e and tonight's city c:
$$ s(e,c) = \frac{-\log_{10}\left(1 - a(e,c)\right)}{5} $$
That spreads affinities over 0 to 1 (0.99 becomes 40/100, 0.999 becomes 60/100). Then each reference is compared with itself in the other cities of the panel, never with other references:
$$ \text{lift}(e,c) = s(e,c) - \text{median} \lbrace s(e,c') : c' \neq c \rbrace $$
If Qloo leaves an entity out of a city's results, it measured no audience there. That counts as a measured zero when other cities do have an audience.
- 🔥 Kills: strength of at least 30/100 here, and either a lift of +5 points or more, or a regional favorite (measured in at most a third of the other cities).
- 💀 Dies: a lift of −5 points or less, or no measurable audience here while other cities have one.
- 😬 Risky: everything else, including household names (top 0.5% popularity) this crowd doesn't over-index on. Recognized, not loved.
The age band (college show, corporate gig, casino theater) shifts the call by one step. If a reference's audience skews −0.3 or more away from the room's age band, the verdict drops a step; if it skews +0.3 or more toward it, a strong 😬 becomes a 🔥. That's why The Joe Rogan Experience drops to 💀 for a 55+ casino crowd (−0.53), and Fortnite rises to 🔥 for a college show (+0.72).
A swap candidate is only offered if this crowd likes it more than the original, and more than the typical city does:
$$ s(\text{swap},c) \ge s(e,c) + 0.03 \quad \text{and} \quad \text{lift}(\text{swap},c) > \text{lift}(e,c) $$
The model then picks which candidate best plays the same role in the joke ("an overpriced, bougie grocery store") and rewrites as few words as possible.
The room score is the share of the set that lands:
$$ \text{RoomScore} = 100 \cdot \frac{\text{kills} + \frac{1}{2} \text{risky}}{\text{kills} + \text{risky} + \text{dies}} $$
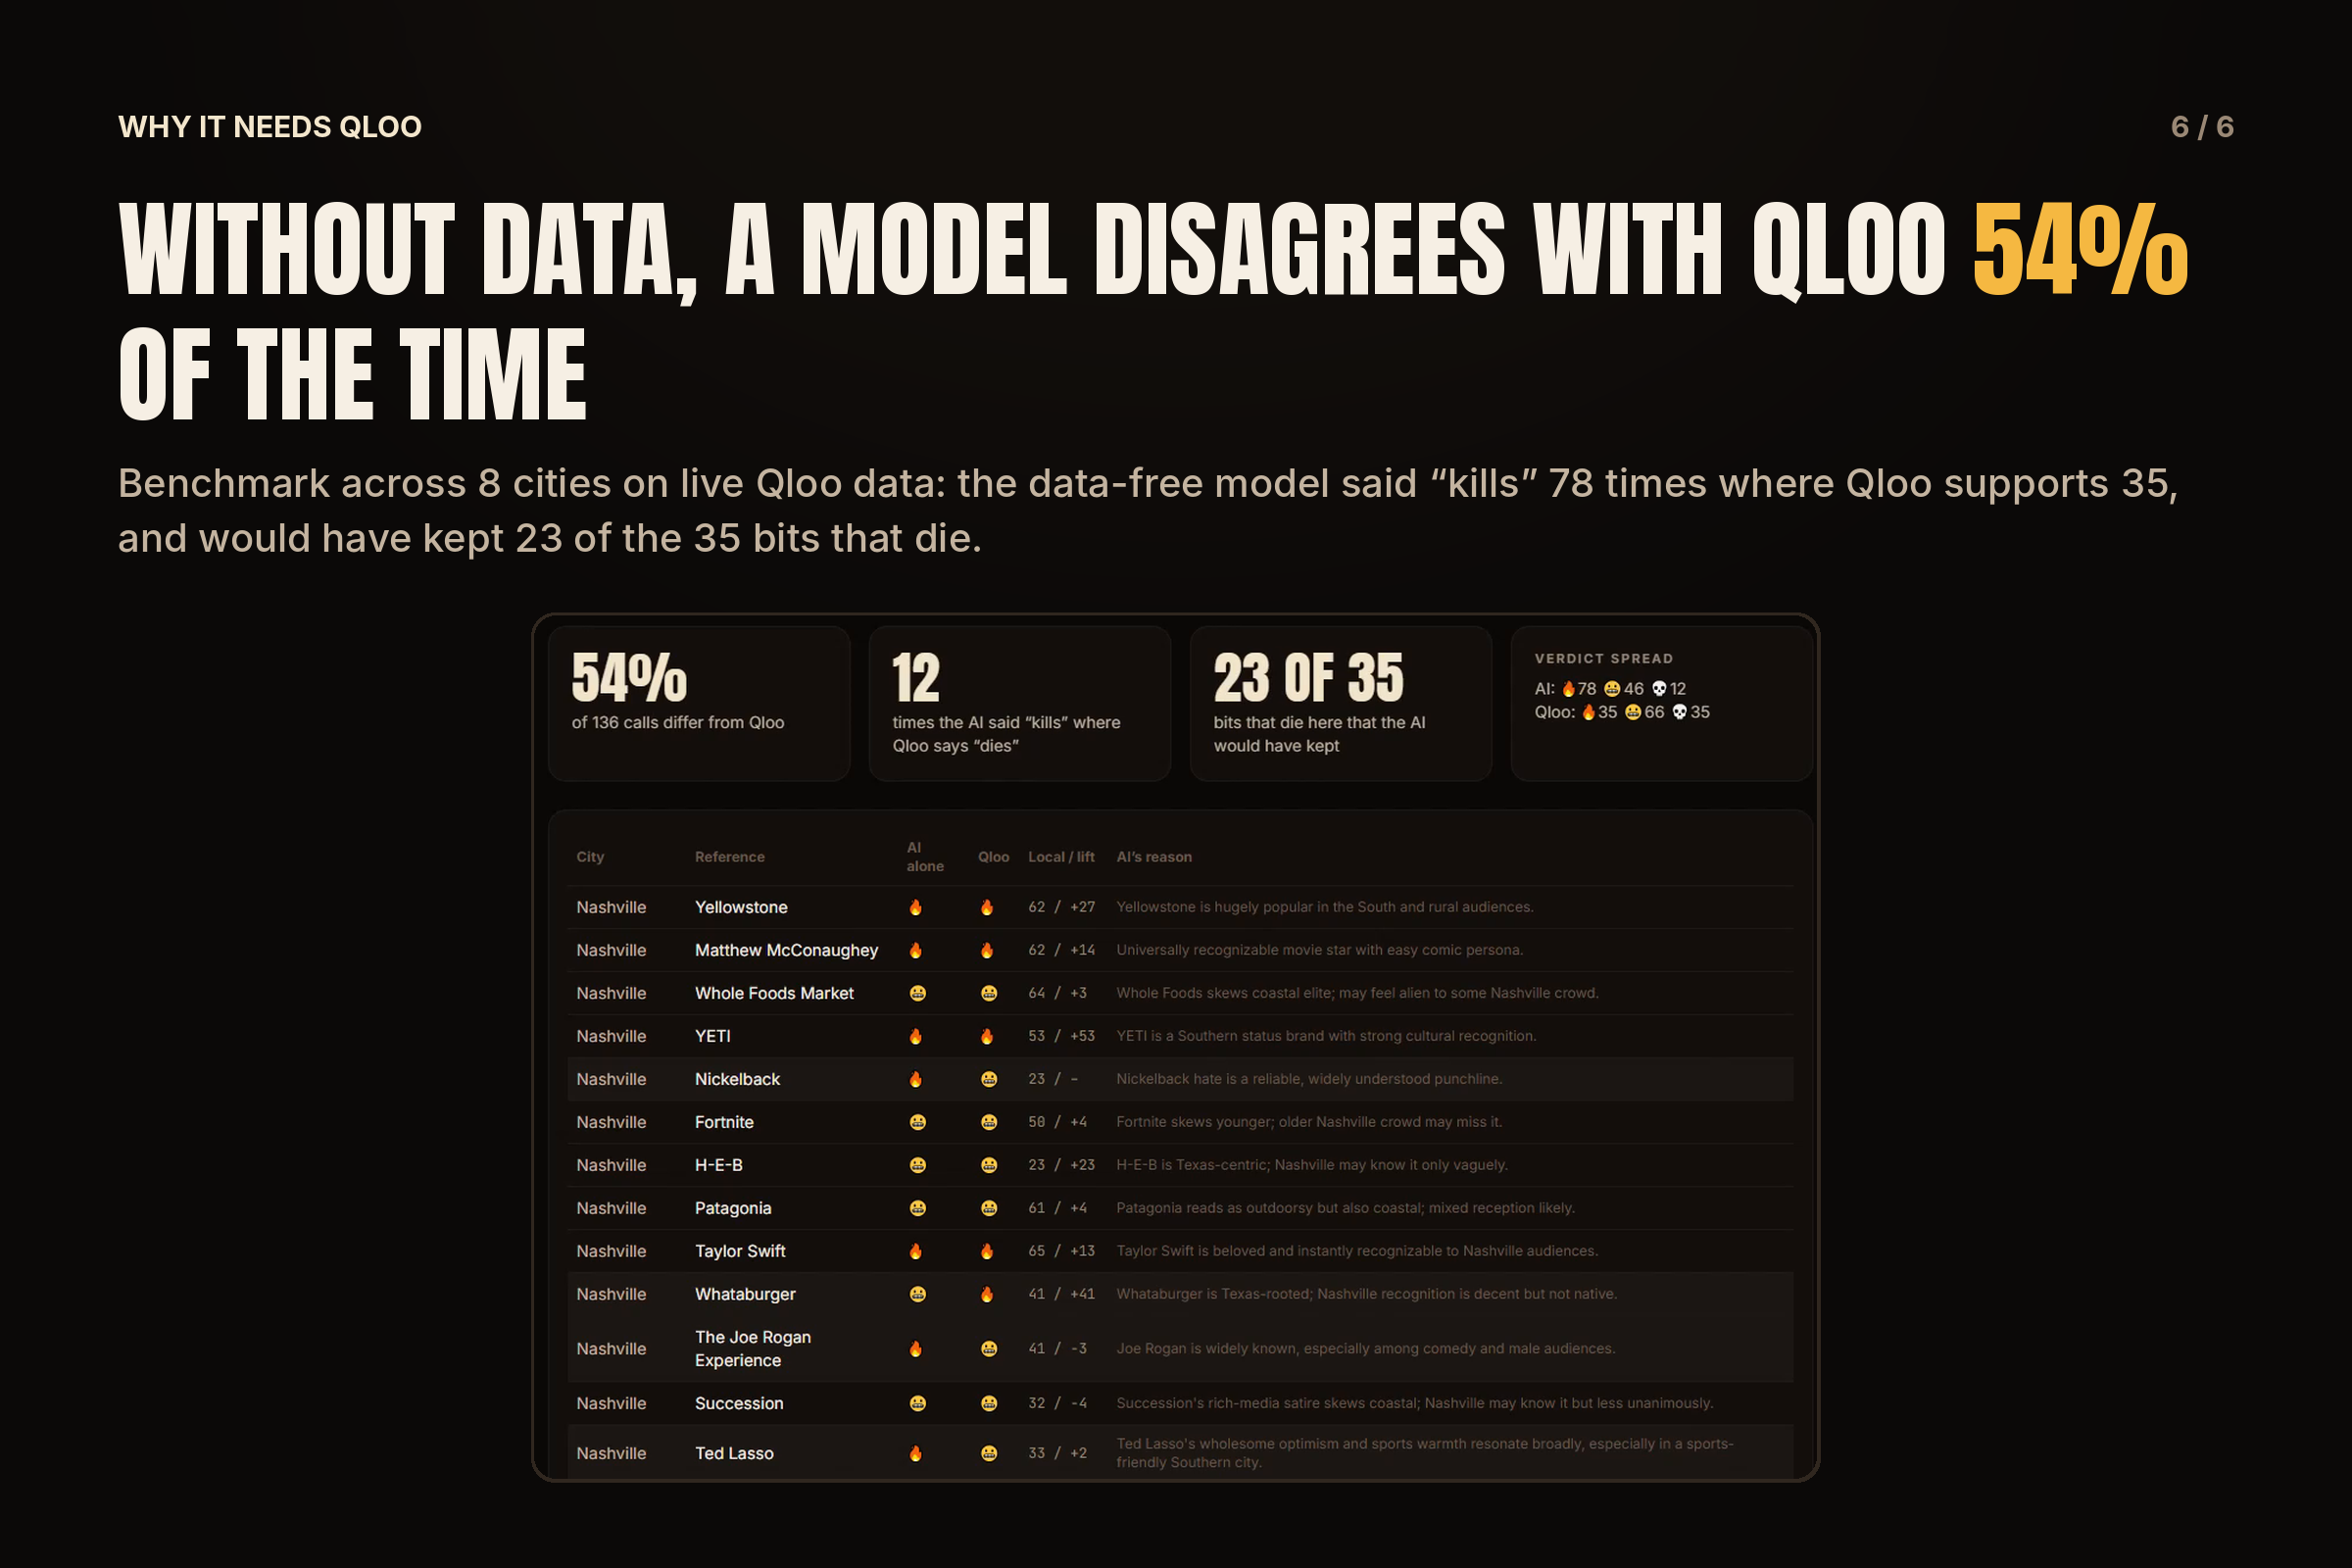
Why it needs Qloo. On every read, I also ask the model to guess the verdicts with no data, and show where it disagrees with Qloo. The benchmark page runs this across both sample scripts in 8 cities on live Qloo data: the data-free guesses disagreed with Qloo on 54% of 136 calls. The model called 🔥 78 times where the data supports 35, said "kills" 12 times where Qloo measured "dies", and would have kept 23 of the 35 bits that die. That doesn't make Qloo a laugh predictor (affinity is not laughter), but it shows what a model does without data: it guesses from stereotypes, with no way to check. Read the Room replaces the guess with a measurement and a receipt for every call.
Challenges I ran into
- "United States" is not a baseline. My first version compared each city with a nationwide score. On live data I found that the "United States" locality resolves to a single point in Montana, which made Yellowstone look huge nationwide. I replaced it with the median across a panel of 8 cities, which is also easier to explain: "this crowd vs. the typical city".
- Every affinity looked the same. Well-known entities score between 0.93 and 0.999 almost everywhere, so fixed thresholds couldn't separate anything. Reading affinity on a log scale and comparing each reference with itself across cities made the differences clear: Yellowstone is 62/100 in Nashville and 24/100 in Brooklyn.
- The age signal flattened everything. With an age band, every location affinity collapsed to about 0.96, so the Patriots looked average in Boston. I now read the city without the age signal, and apply age separately from each audience's age skew (
urn:demographics). - A rate limit can look like a verdict. The key allows 10 requests per second. A rate-limited request returns nothing, and "nothing" is exactly what Qloo returns when a city has no audience for an entity. My first parallel probe produced fake 💀 verdicts this way. Now every request is paced under the limit, identical requests are shared, and a failed call is never counted as "no audience".
- Fuzzy search returns confident wrong answers. "Logan Roy" found Logan Paul, "Buc-ee's" found the Milwaukee Bucks, and the Dodgers found their team store. A hit now only counts if every word of the reference appears in it (or it is a shorter form of the reference), and unmatched references retry related categories.
- Speed. A full read makes over 100 Qloo calls under a 10-per-second limit, and the first live demo took about 85 seconds. Pacing, sharing identical requests, a cache shared across serverless instances, showing results as each step finishes instead of at the end, and running the structured model calls without reasoning brought a cold read to about 40 seconds, with the verdicts on screen well before the rewrites finish.
- Keeping the joke intact. Swapping the noun is easy; keeping the rhythm and the punchline is not. Each reference carries a role, and the rewrite also replaces details that only fit the old reference, like a catchphrase or a menu item ("a Number 1" became "a Crave Case" when Whataburger became White Castle).
- Agents on serverless. A tool-calling loop with several Qloo calls per turn can outlast a serverless function. The browser drives the loop, one model turn per request, which also means every tool call shows up on screen as it happens.
What I learned
- Taste data and language models do different jobs. A model is great at reading a script and rewriting a line. Only measured taste data can say what a specific room loves. The best results came from keeping those jobs separate.
- Absence is a signal. When Qloo returns no audience for YETI in Brooklyn while 3 other cities have one, that is a measurement, not a missing value. Treating it that way made the verdicts much sharper.
- Explainability builds trust. Showing the receipt behind every verdict made the tool feel trustworthy instead of magical, and it is exactly how Qloo presents its own results.
- Results describe groups, not people. Qloo's affinities describe what groups tend to like, not what any one person will do. I designed the copy around that, and no personal data is ever sent to Qloo: only entity names, a city and an optional age band.
What's next
- Neighborhood-level reads (Williamsburg vs. Park Slope) with heatmaps.
- A tour planner that orders the cities and bits for a whole run.
- Ad scripts and campaign copy: localizing one script for every market is the same problem, with a real budget behind it.
Built With
- javascript
- tanstack
