-
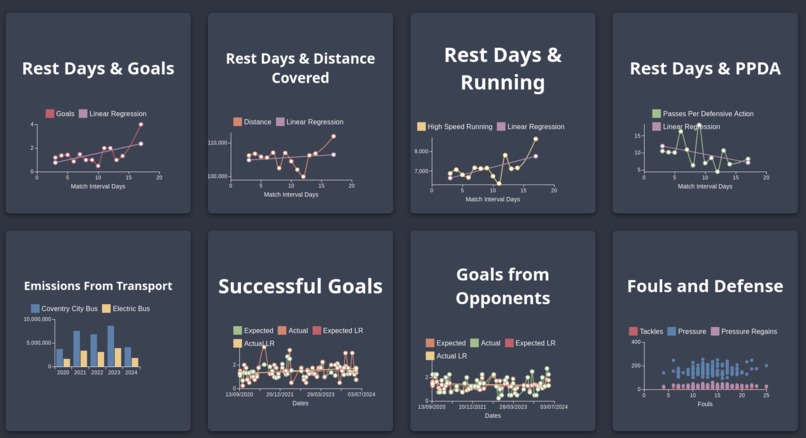
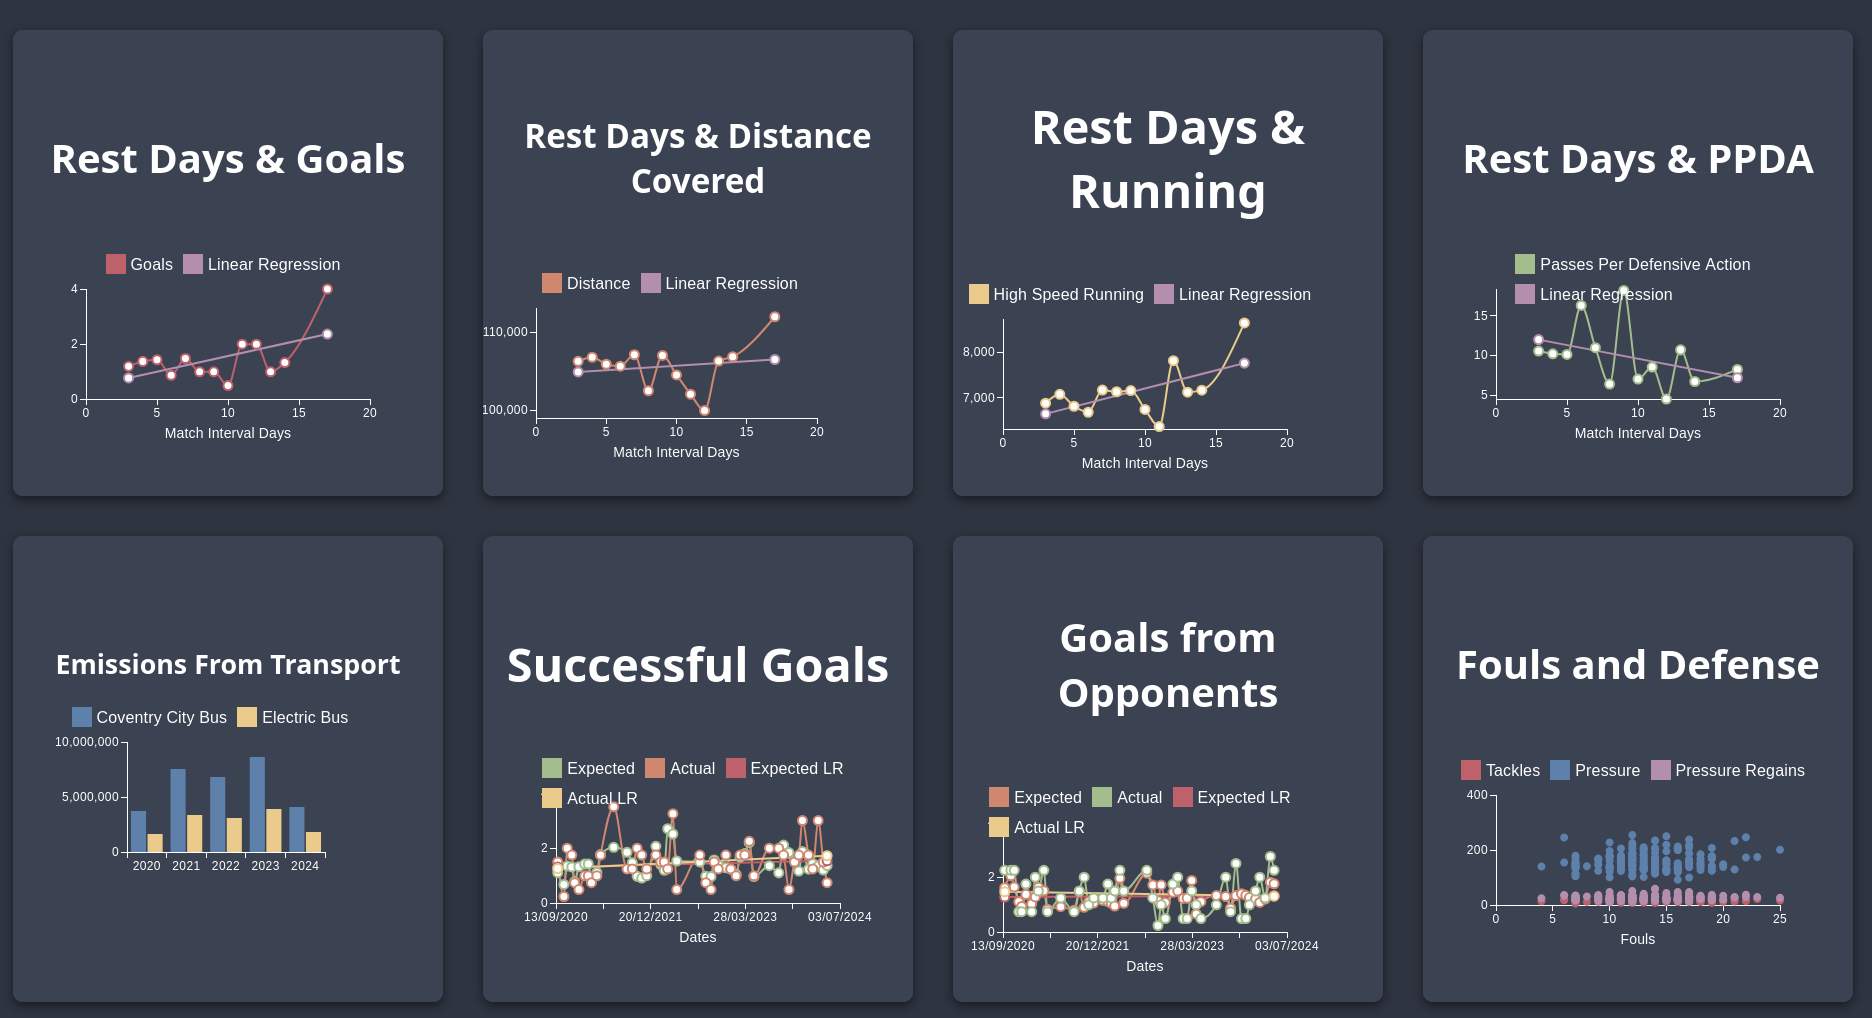
Home screen
-
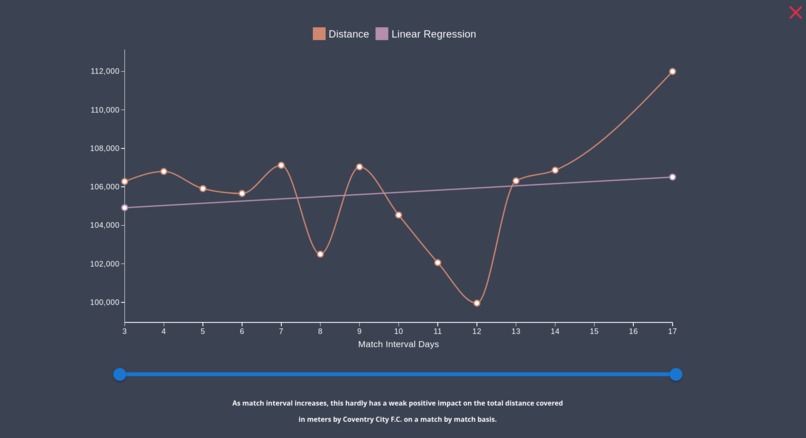
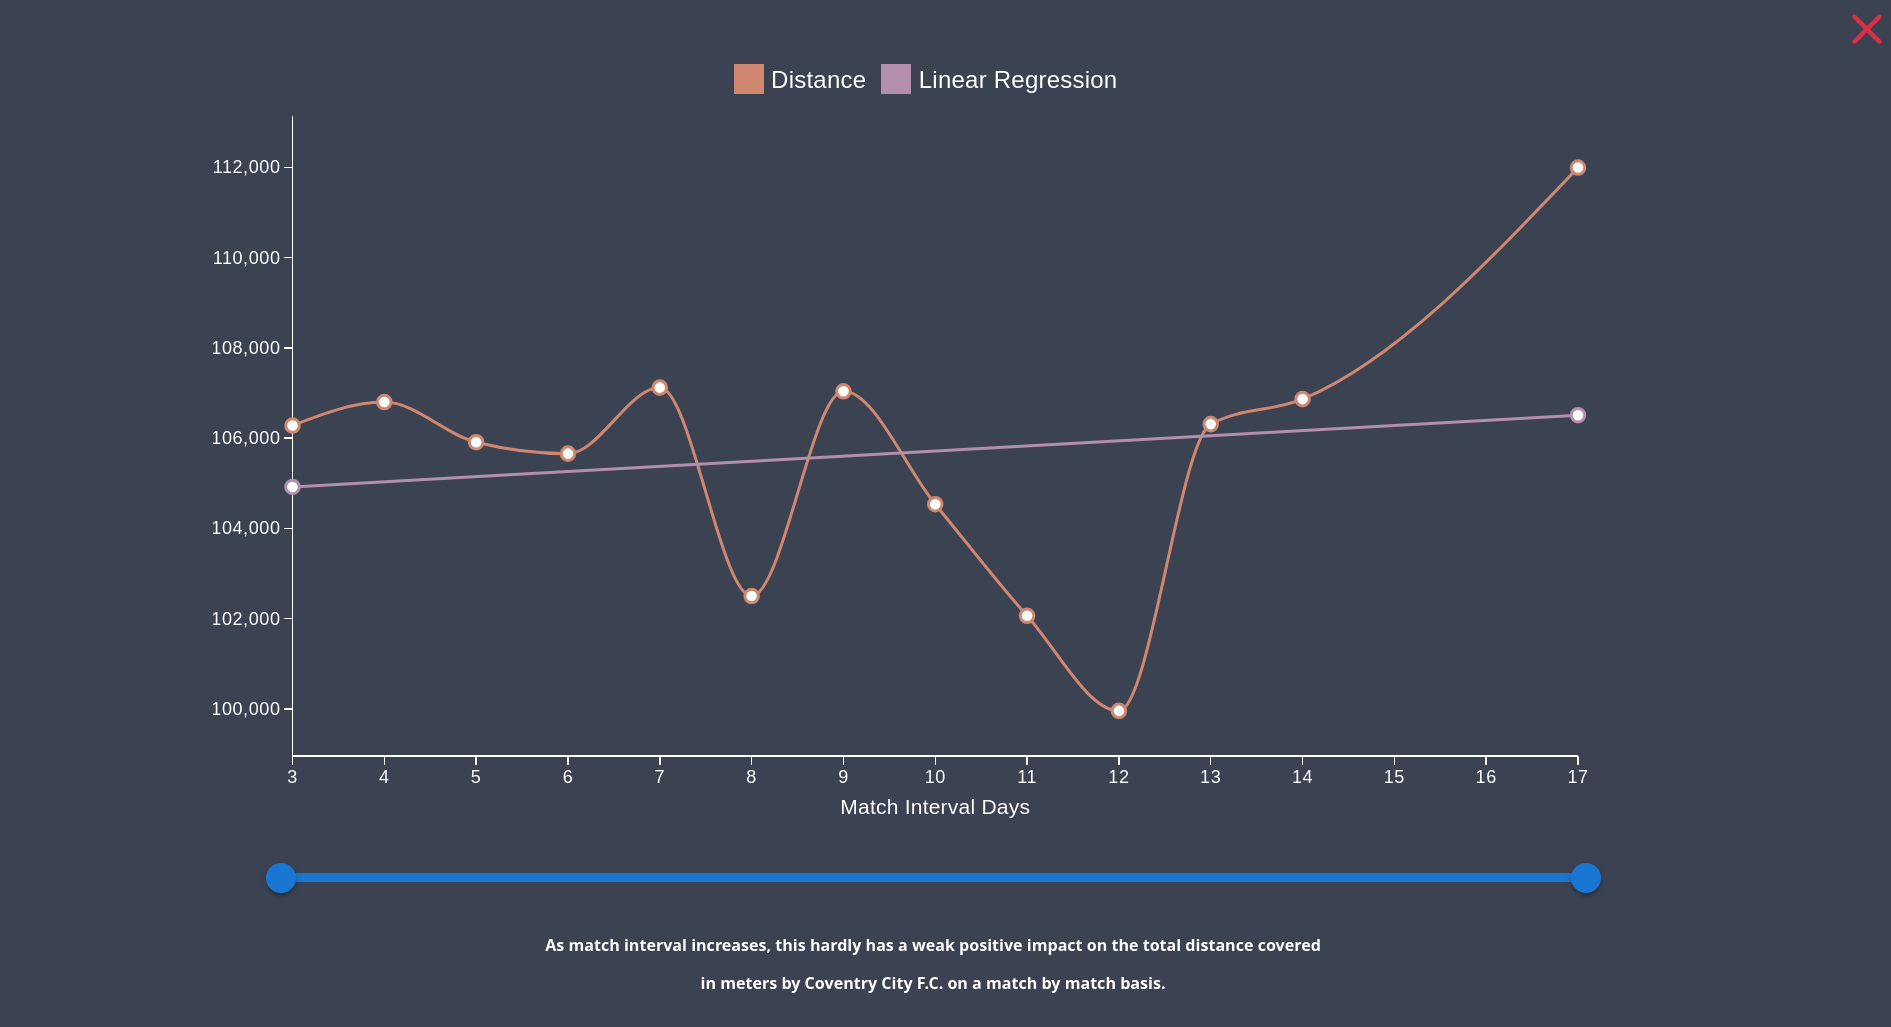
Choosing a graph to inspect
Inspiration
What it does
Visualization over various data metrics in line, bar and scatter charts
How we built it
In React, utilising Pandas for data processing.
Challenges we ran into
Several chart implementations failed to work. Our boxes didn't like being put in a grid layout
Accomplishments that we're proud of
Crunching numbers to produce specific json files for each UI box
What we learned
Try using same technology in backend as frontend, helps with communication and being able to support eachother in languages that we are both familiar in using.
What's next for Reactive
Aim to fix errors, such as missing y-axis for graphs (issue with padding). Also add new features, such as ability to create a plot based on variables from the dataset.

Log in or sign up for Devpost to join the conversation.