Inspiration
The COVID-19 pandemic fundamentally disrupted how people live, work, and choose where to call home. We were inspired by the "X-Minute City" urban planning concept—the idea that essential amenities should be accessible within a short walk or drive.
We asked: Has the pandemic redefined what makes an apartment community desirable?
Traditional real estate metrics focused heavily on downtown proximity and transit access. We hypothesized that post-pandemic preferences have shifted toward suburban communities with tight amenity clusters—a "15-Minute Suburb" phenomenon.
What it does
An Old Lens on a New World predicts RevPAR (Revenue Per Available Room) growth for apartment communities and reveals how the pandemic has reshaped residential preferences. Our system:
- Predicts Performance: Utilizes a 12-model ensemble to predict apartment performance, achieving a RMSE of 0.0714 (5-fold CV).
- Quantifies the Shift: We discovered that grocery store importance increased by 165% and park proximity by 187%, while restaurant importance dropped by 45%.
- Validates the "15-Minute Suburb": Our data confirms that outer suburbs with tight amenity access (10–15 min drivetime) now outperform downtown cores.
- AI-Powered Insights: Features a chatbot that answers natural language questions about market trends while rigorously protecting confidential property data.
How we built it
Data Pipeline
- Integration: Merged property-level data with AARP livability scores, walkability metrics, and amenity access data.
- Feature Engineering: Created 100+ features across property, geographic, economic, and amenity dimensions.
Machine Learning
- Ensemble Architecture: A 12-model ensemble including LightGBM, XGBoost, CatBoost, HistGradientBoosting, ExtraTrees, and 4 domain-specific LightGBM models, plus Ridge/ElasticNet.
- Stacking: Implemented a Ridge Stacking meta-learner to combine diverse base predictions.
- Validation: Used GroupKFold by property ID to strictly prevent data leakage between training and validation sets.
AI Chatbot
- 3-Layer Architecture: Flows from pre-computed findings → structured data → raw data analysis.
- Semantic Search: Uses OpenAI embeddings for semantic search with cosine similarity matching.
- Privacy First: Built-in confidentiality filters block specific property-level data requests.
Tech Stack
Python, Streamlit, LightGBM, XGBoost, CatBoost, OpenAI API, Plotly, Matplotlib.
Challenges we ran into
- Data Leakage Prevention: Properties appeared across both pre- and post-COVID periods. We implemented GroupKFold by property ID to ensure no property appeared in both train and validation sets.
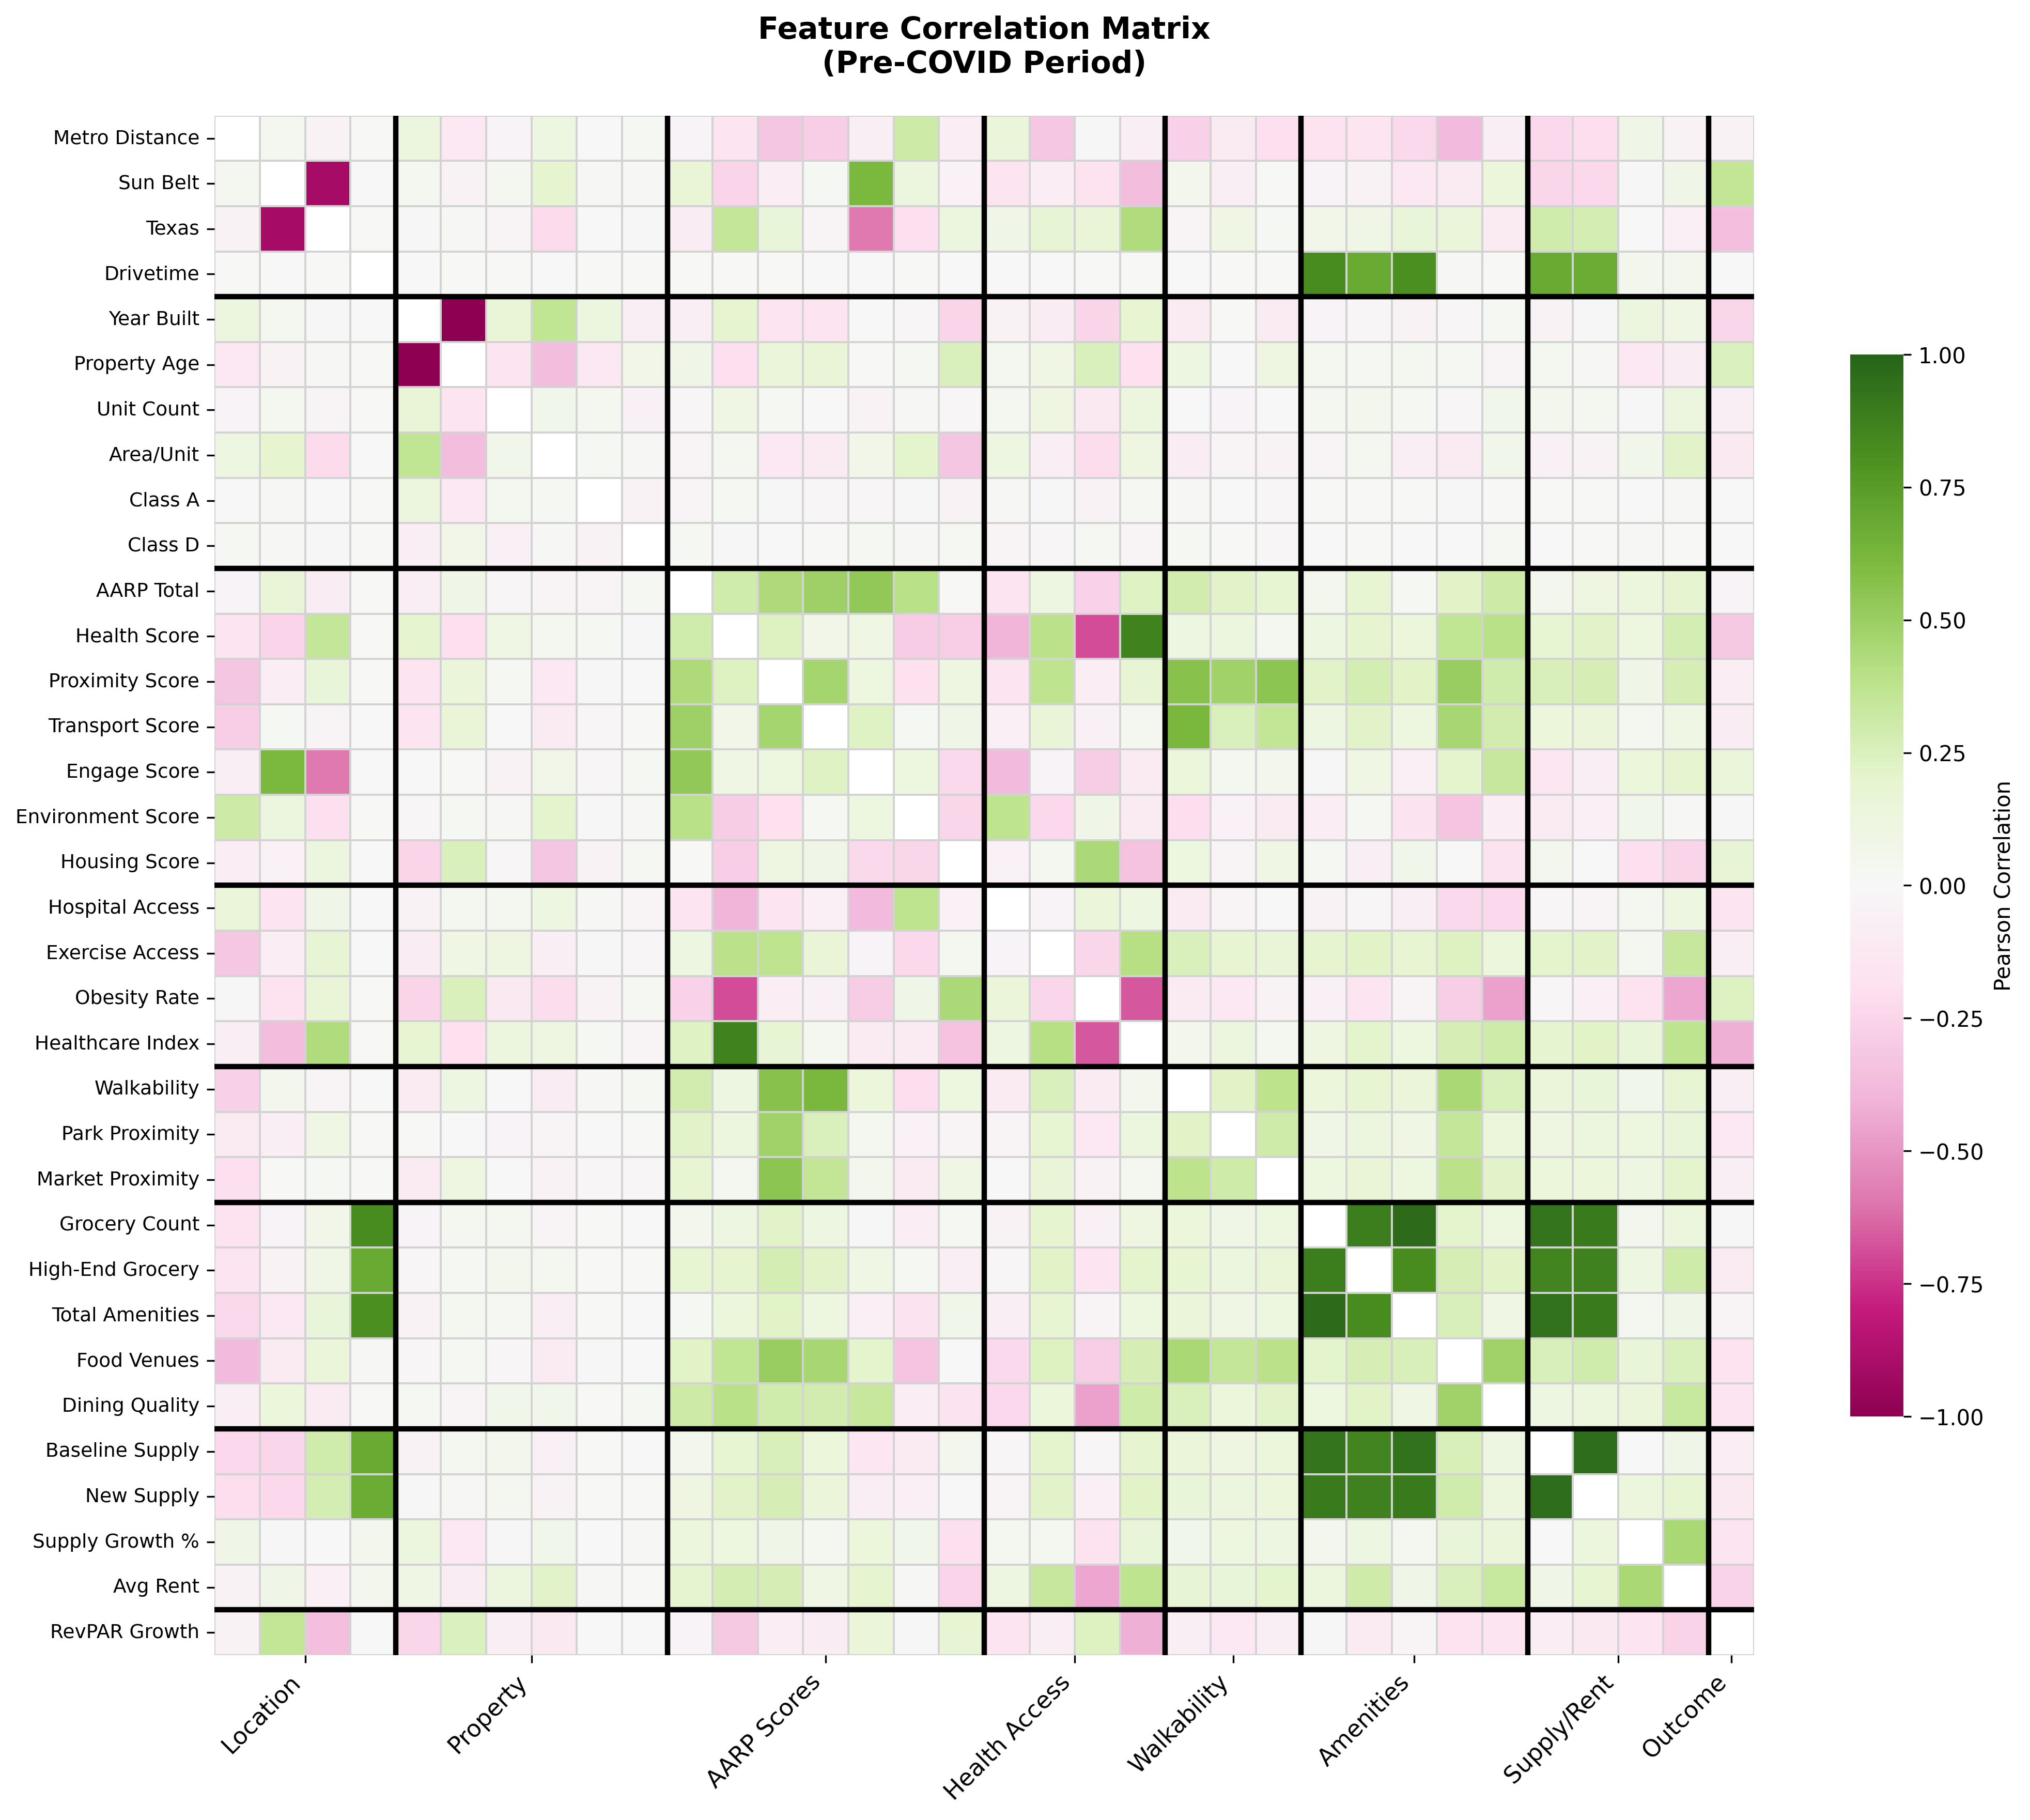
- Feature Multicollinearity: Initial features had high correlations (e.g., AARP health score ↔ smoking rates: \( r = -0.80 \)). We pruned features with >0.80 correlation to remove redundancy.
- Outlier Sensitivity: Extreme RevPAR growth values skewed predictions. We applied 99th percentile clipping to stabilize training.
- Balancing Utility vs. Confidentiality: We needed to provide deep insights without exposing property-level financials. Our 3-layer architecture with keyword filtering solved this.
Accomplishments that we're proud of
- Quantifying Disruption: Only 19.6% of properties maintained their performance quartile pre- vs. post-COVID.
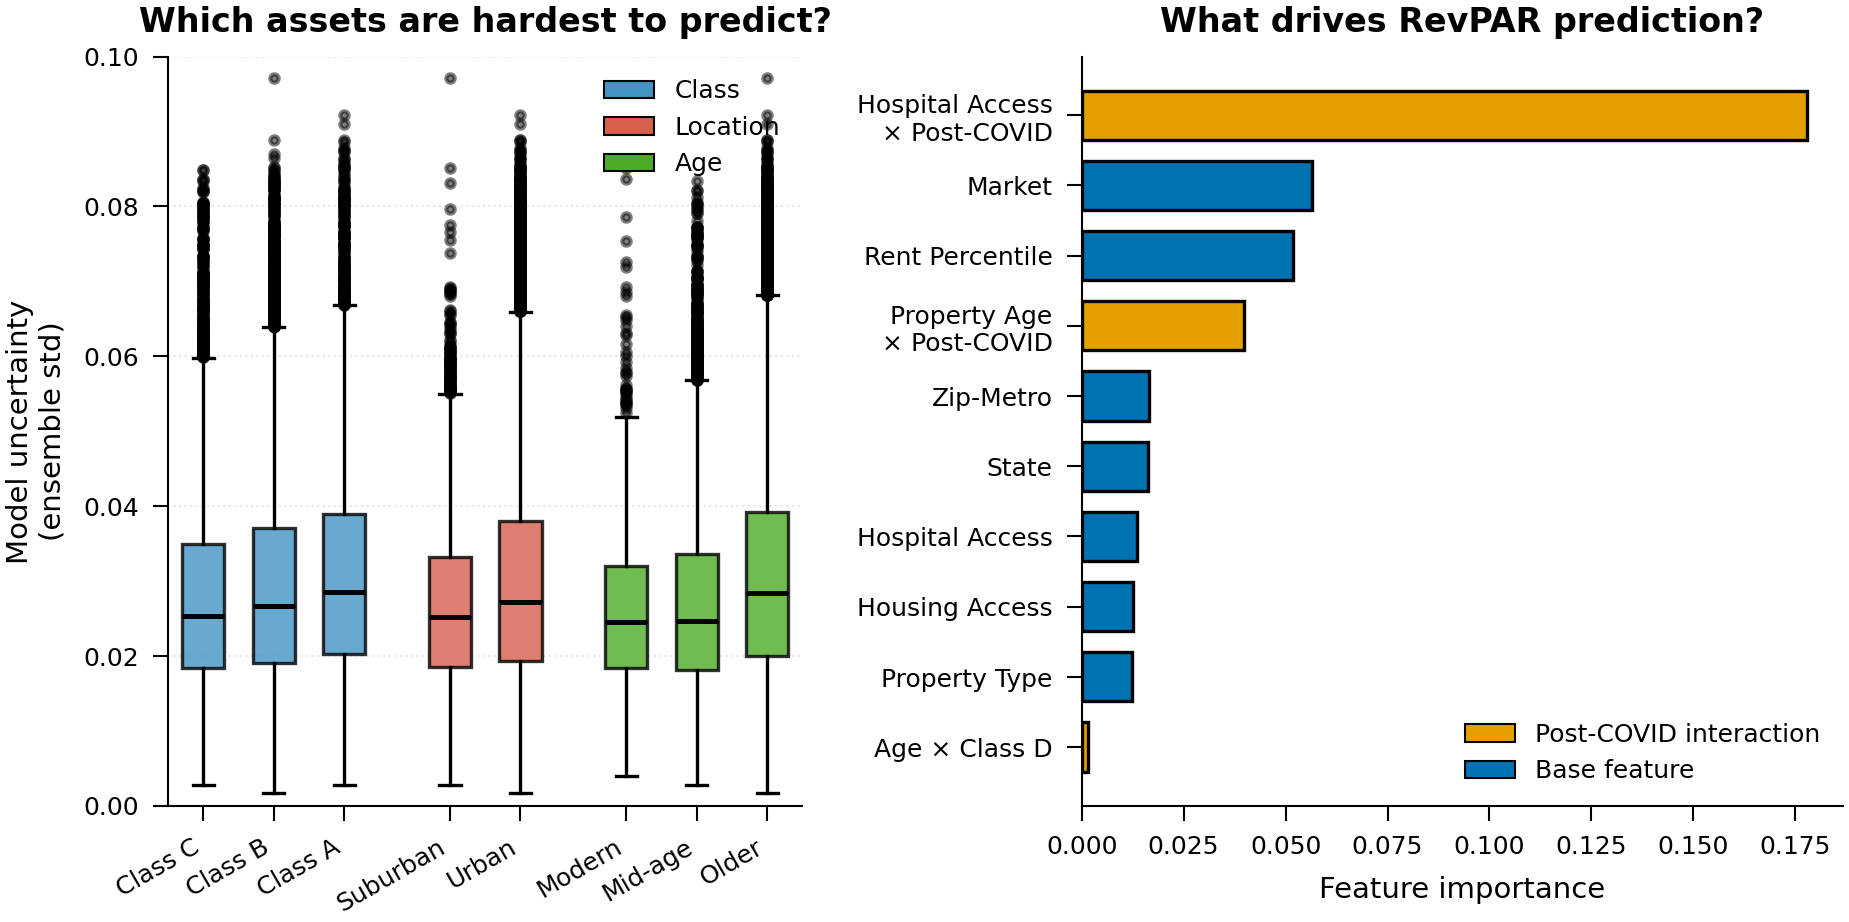
- Identifying New Predictors: Property Class became the #1 predictor (jumping from rank 100 pre-COVID). Class D properties averaged 14% RevPAR growth vs. 6% for Class A.
- Hypothesis Validation: The 15-minute drivetime radius showed optimal predictive power (\( R^2 = 0.65 \)), validating the "15-Minute Suburb" theory.
- Rigorous Analysis: Produced publication-quality visualizations using Fisher's z-test for correlation differences and bootstrap confidence intervals.
- High Accuracy: Achieved a 63% exact quartile match in classification, and 97% within one quartile.
What we learned
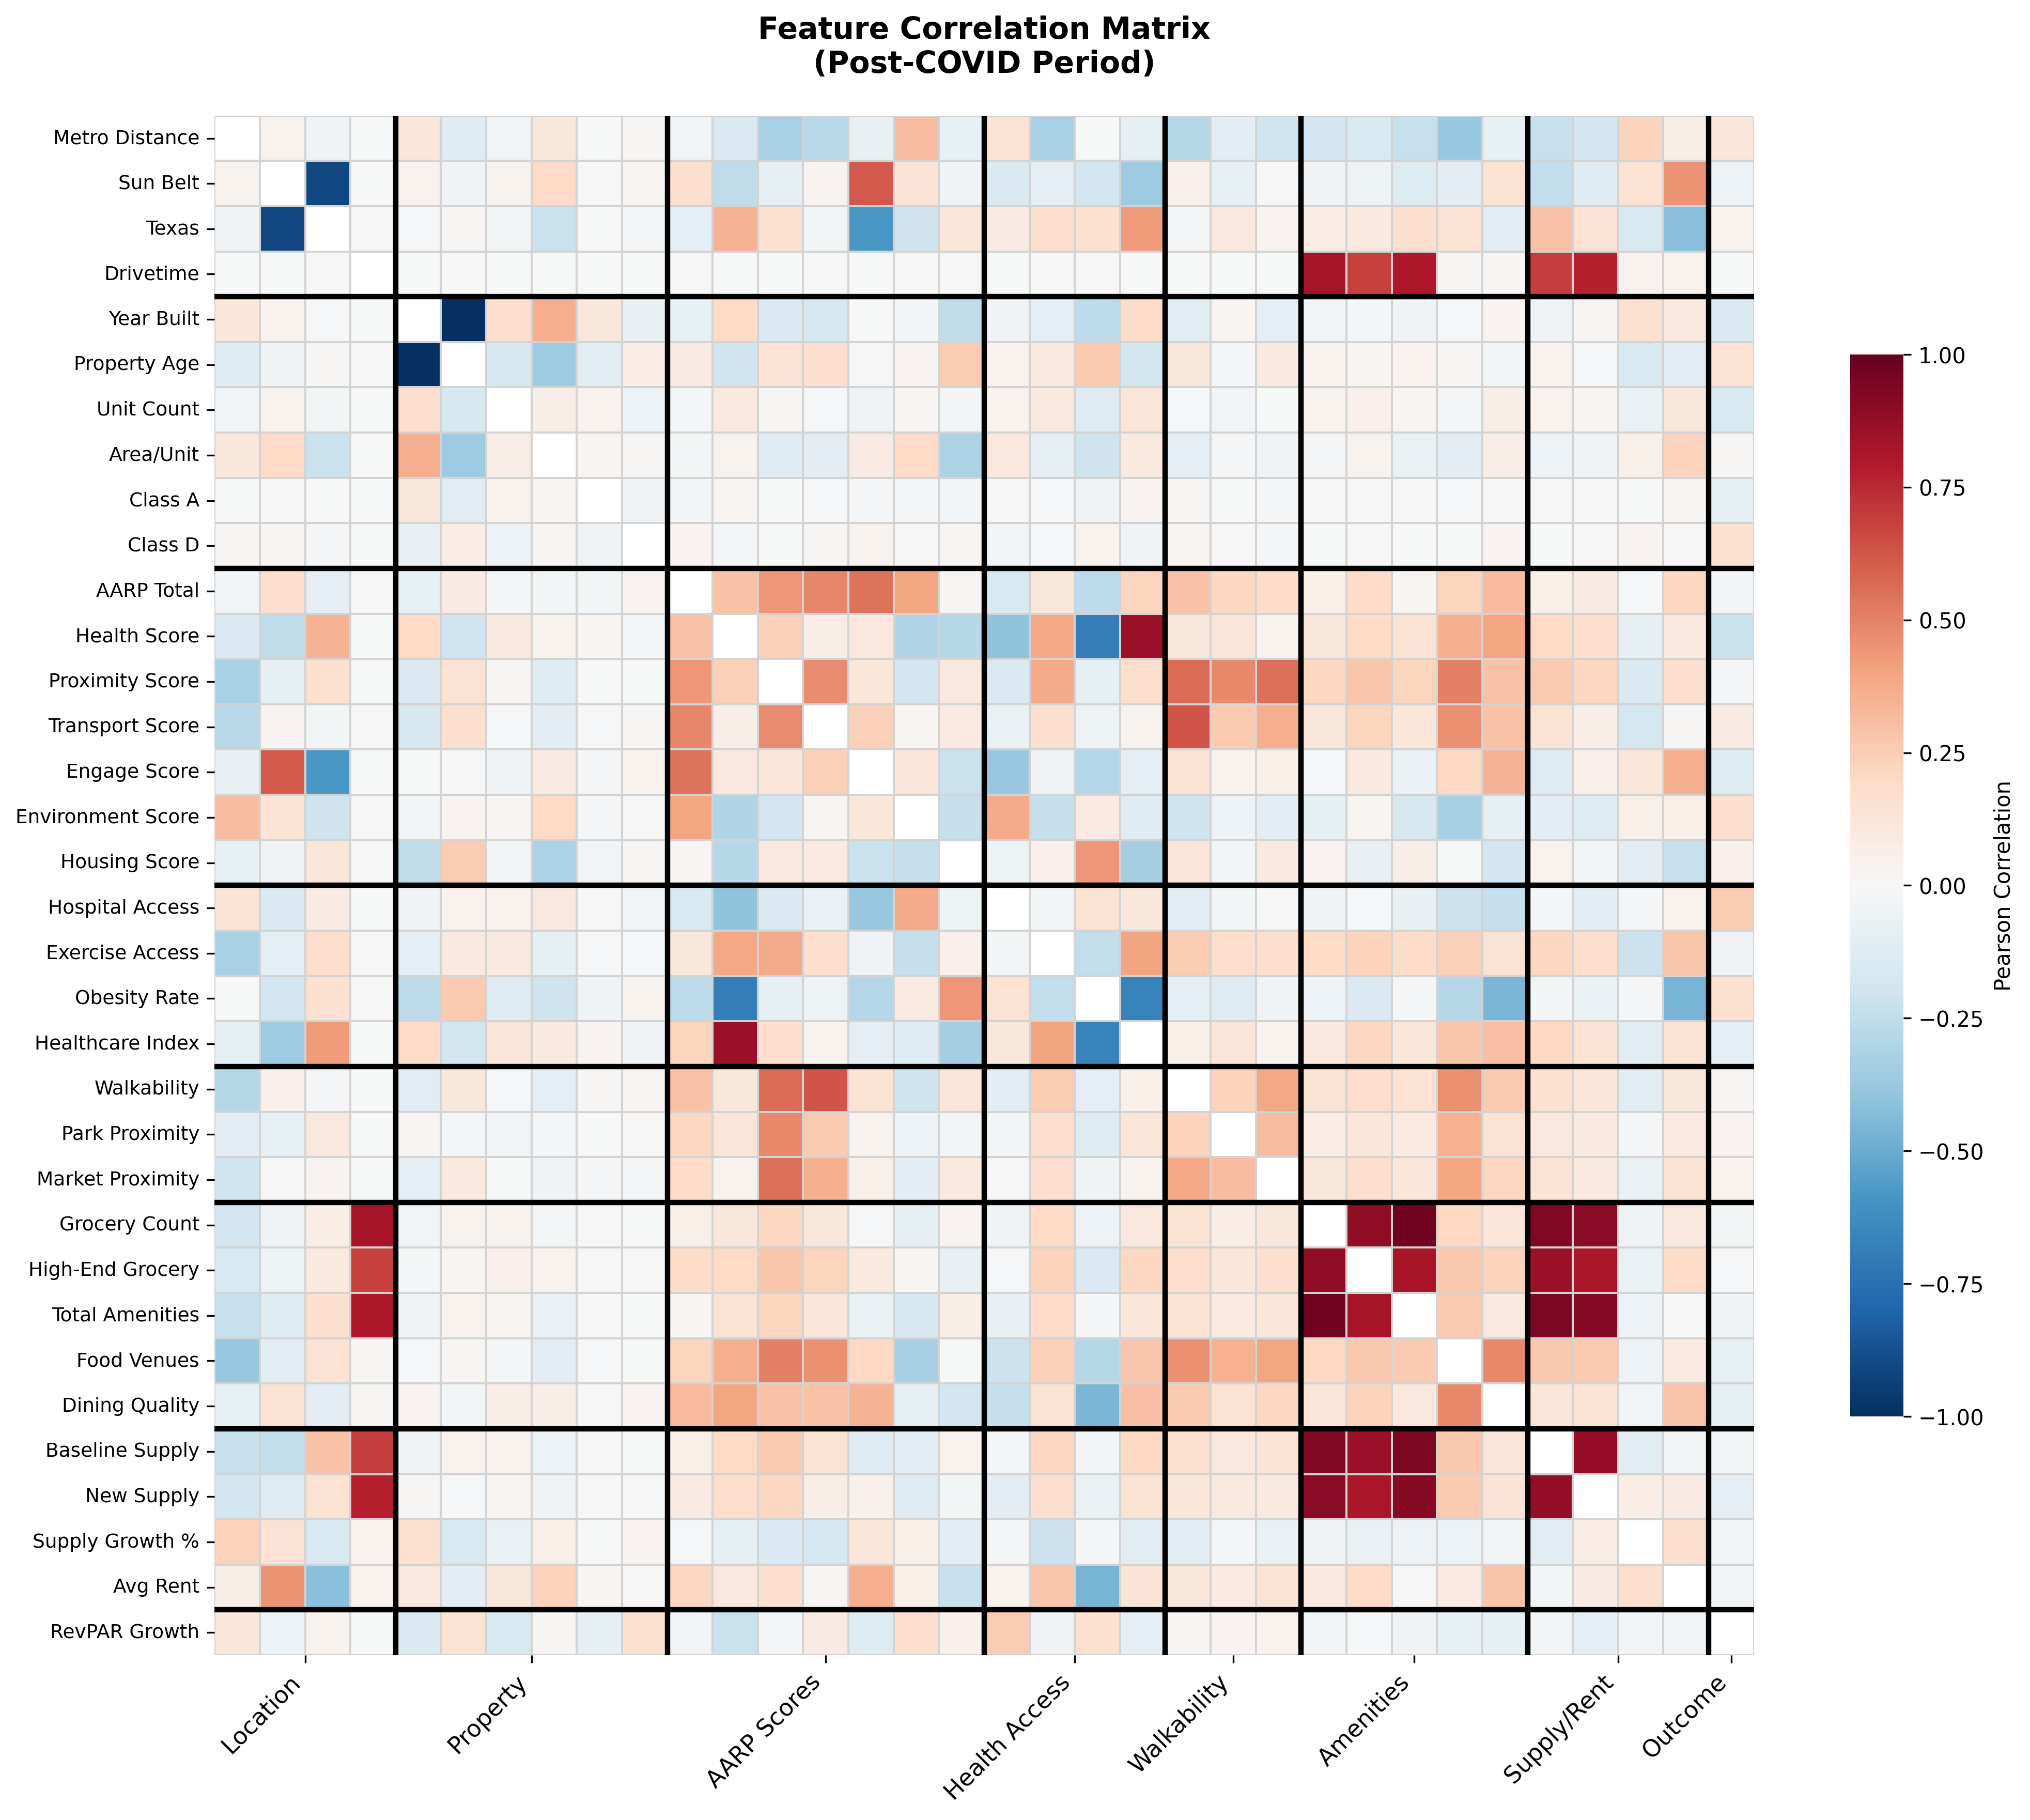
- The "Inversion": Downtown proximity and transit access—historically premium features—now show negative or neutral correlations with growth.
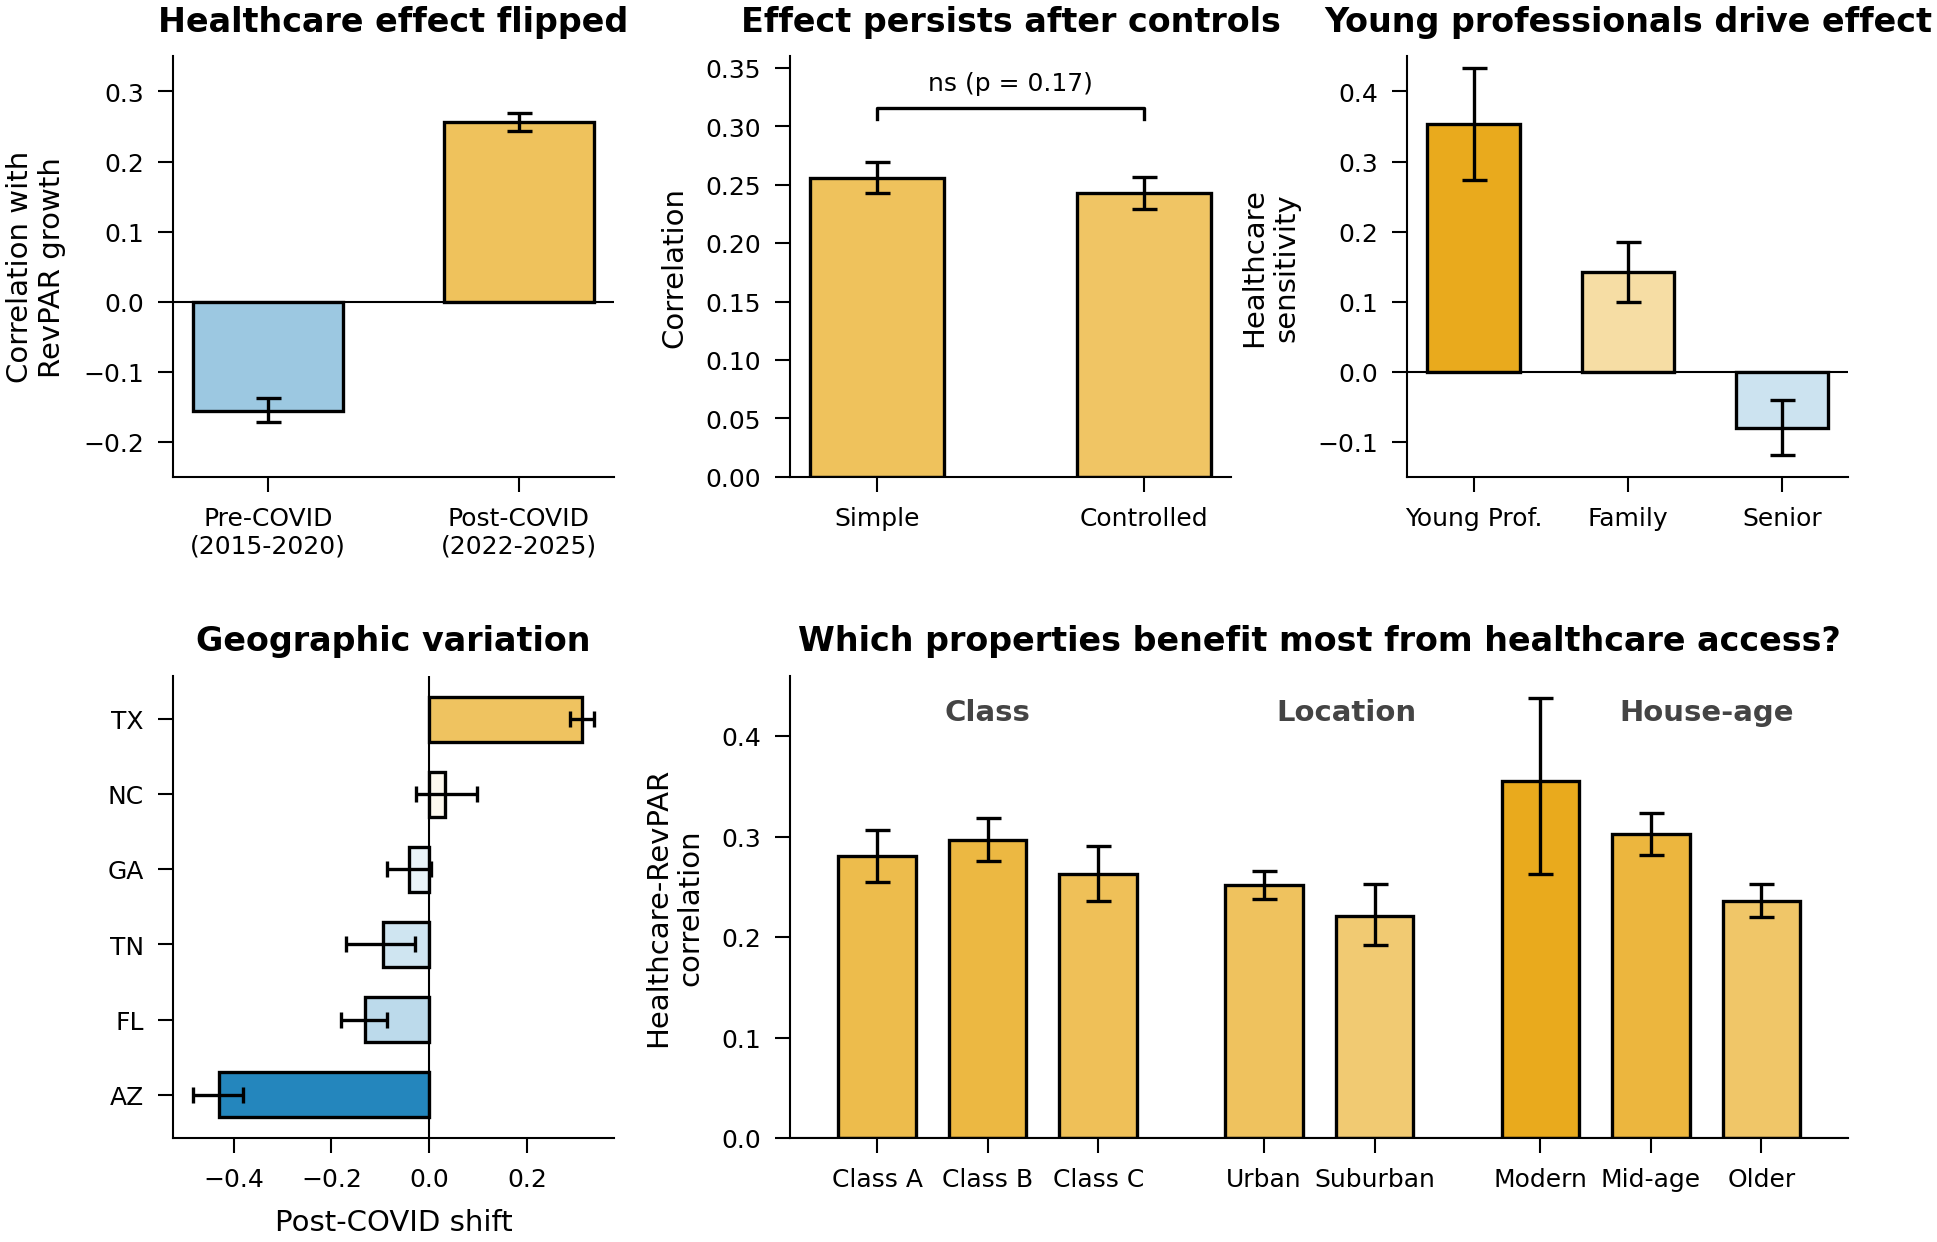
- Health Matters: AARP health scores and walkability became significant predictors post-COVID.
- Diversity > Tuning: Combining gradient boosting, linear models, and feature-subset specialists outperformed any single optimized model.
- Interpretability is Key: SHAP analysis was crucial to understand why predictions worked, moving beyond "black box" results.
What's next
- Time-Series Forecasting: Extending predictions to model RevPAR trajectories over 12–24 months.
- Hyperlocal Analysis: Incorporating POI density data at a finer geographic granularity.
- Public Deployment: Enabling real estate analysts to query our findings via Streamlit Cloud.
- Asset Expansion: Applying this methodology to office, retail, and industrial properties.
- Policy Impact: Providing regional recommendations to help urban planners understand which amenity investments drive housing value.


Log in or sign up for Devpost to join the conversation.