-
-
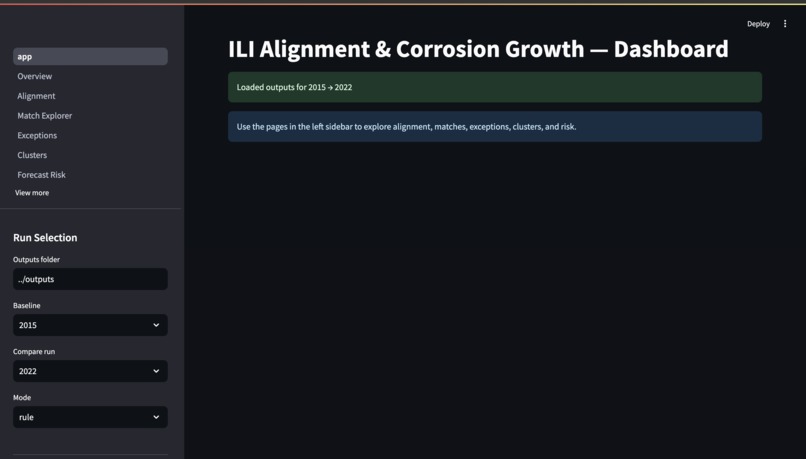
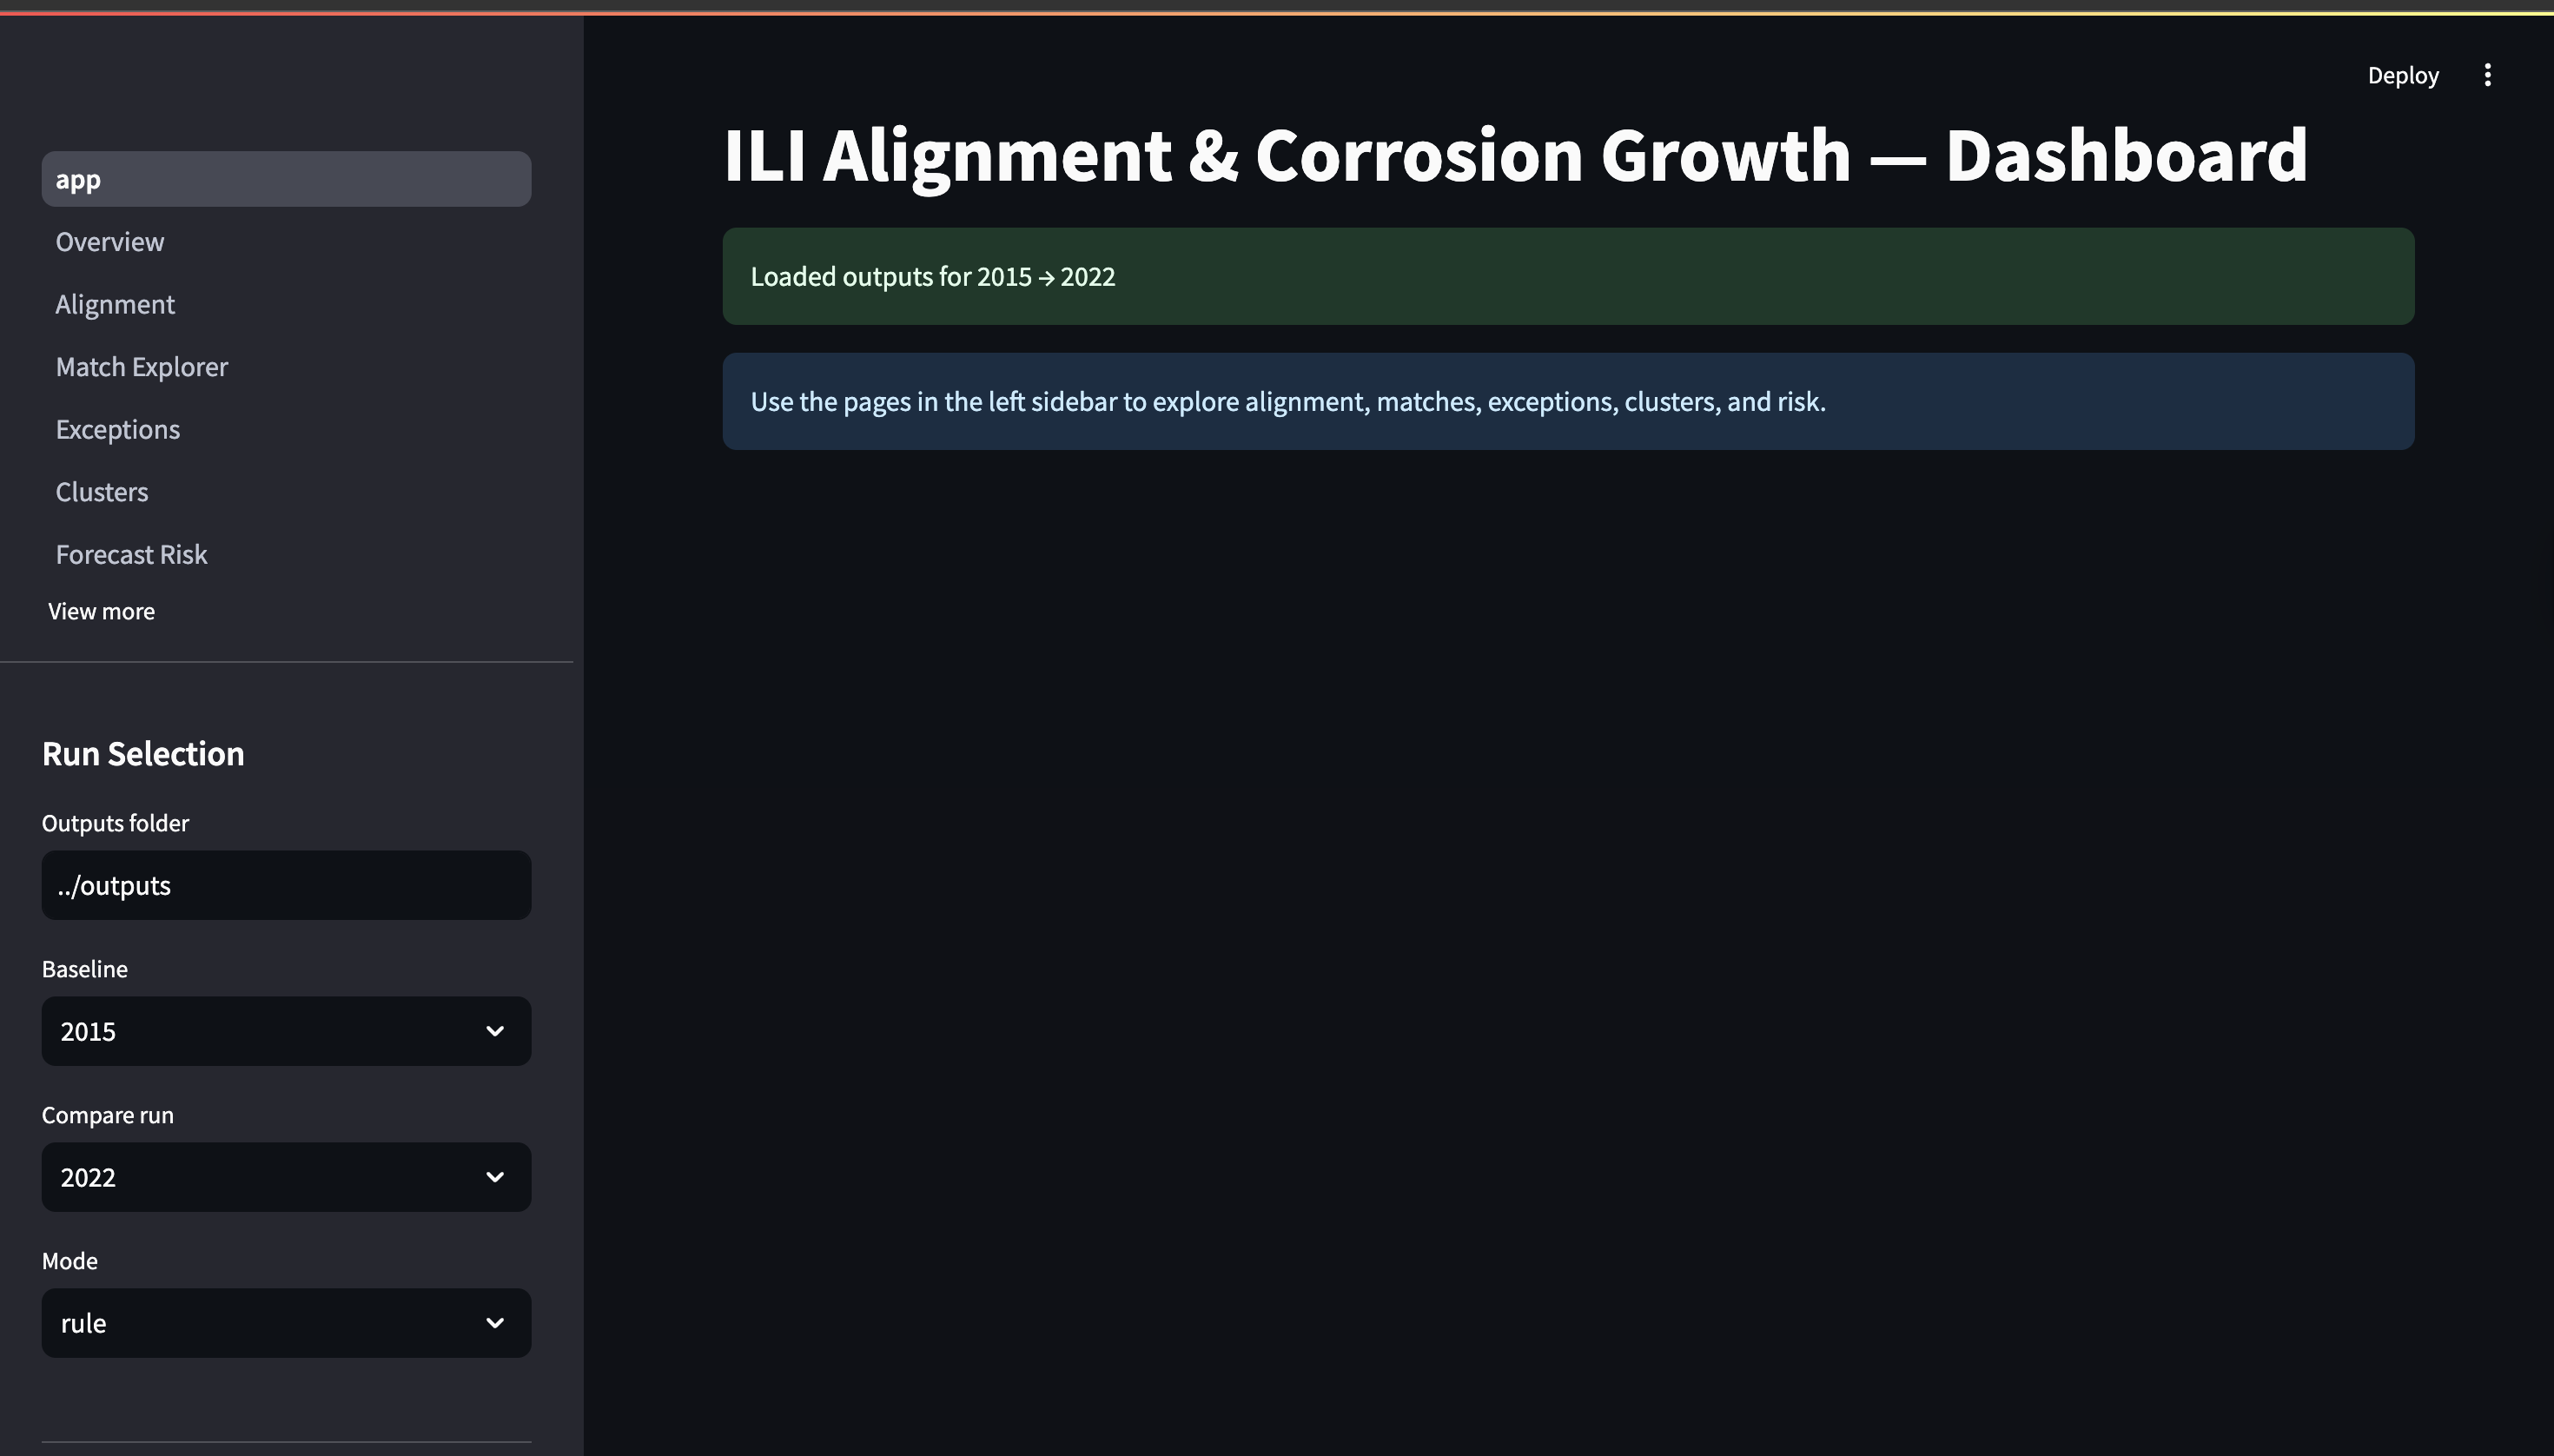
Dashboard Frontpage
-
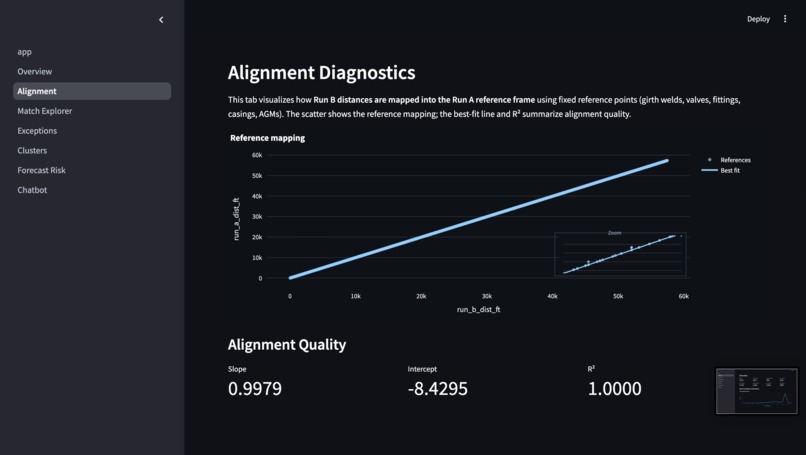
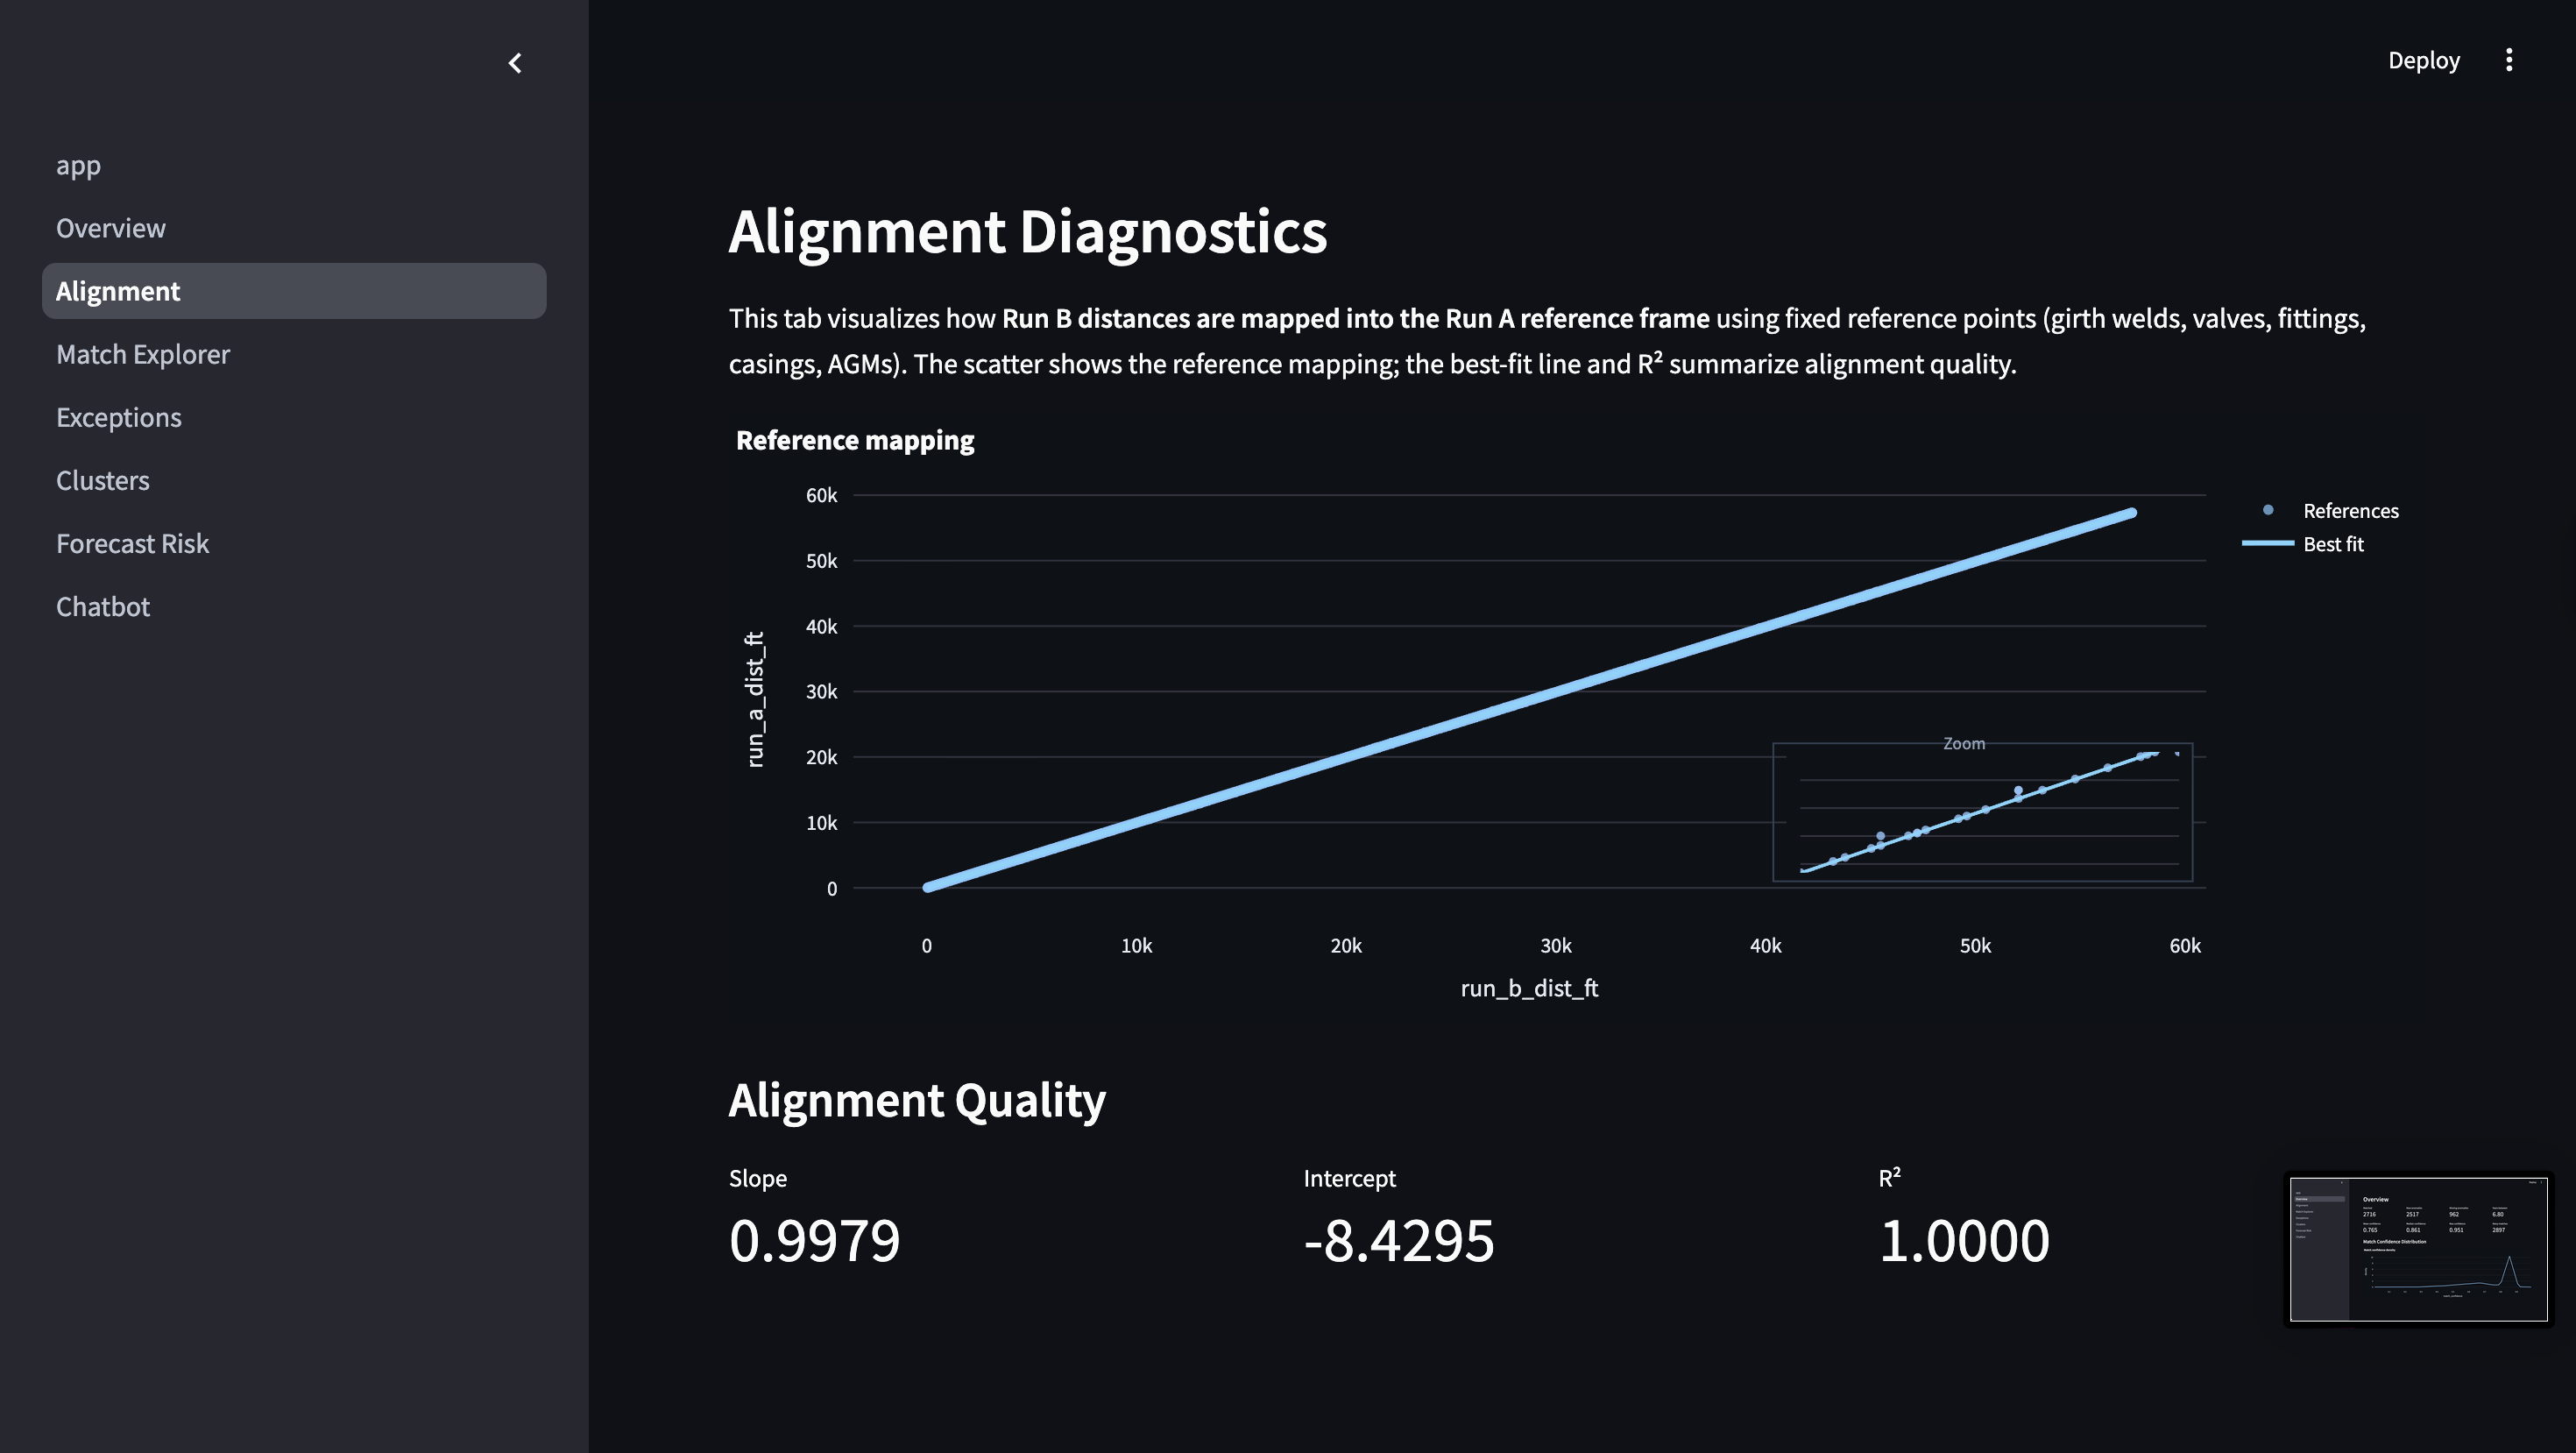
The Alignment Diagnostics Visualization
-
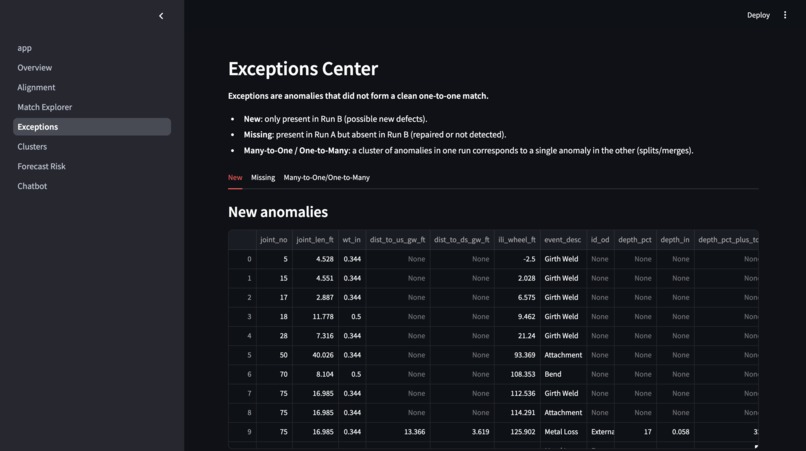
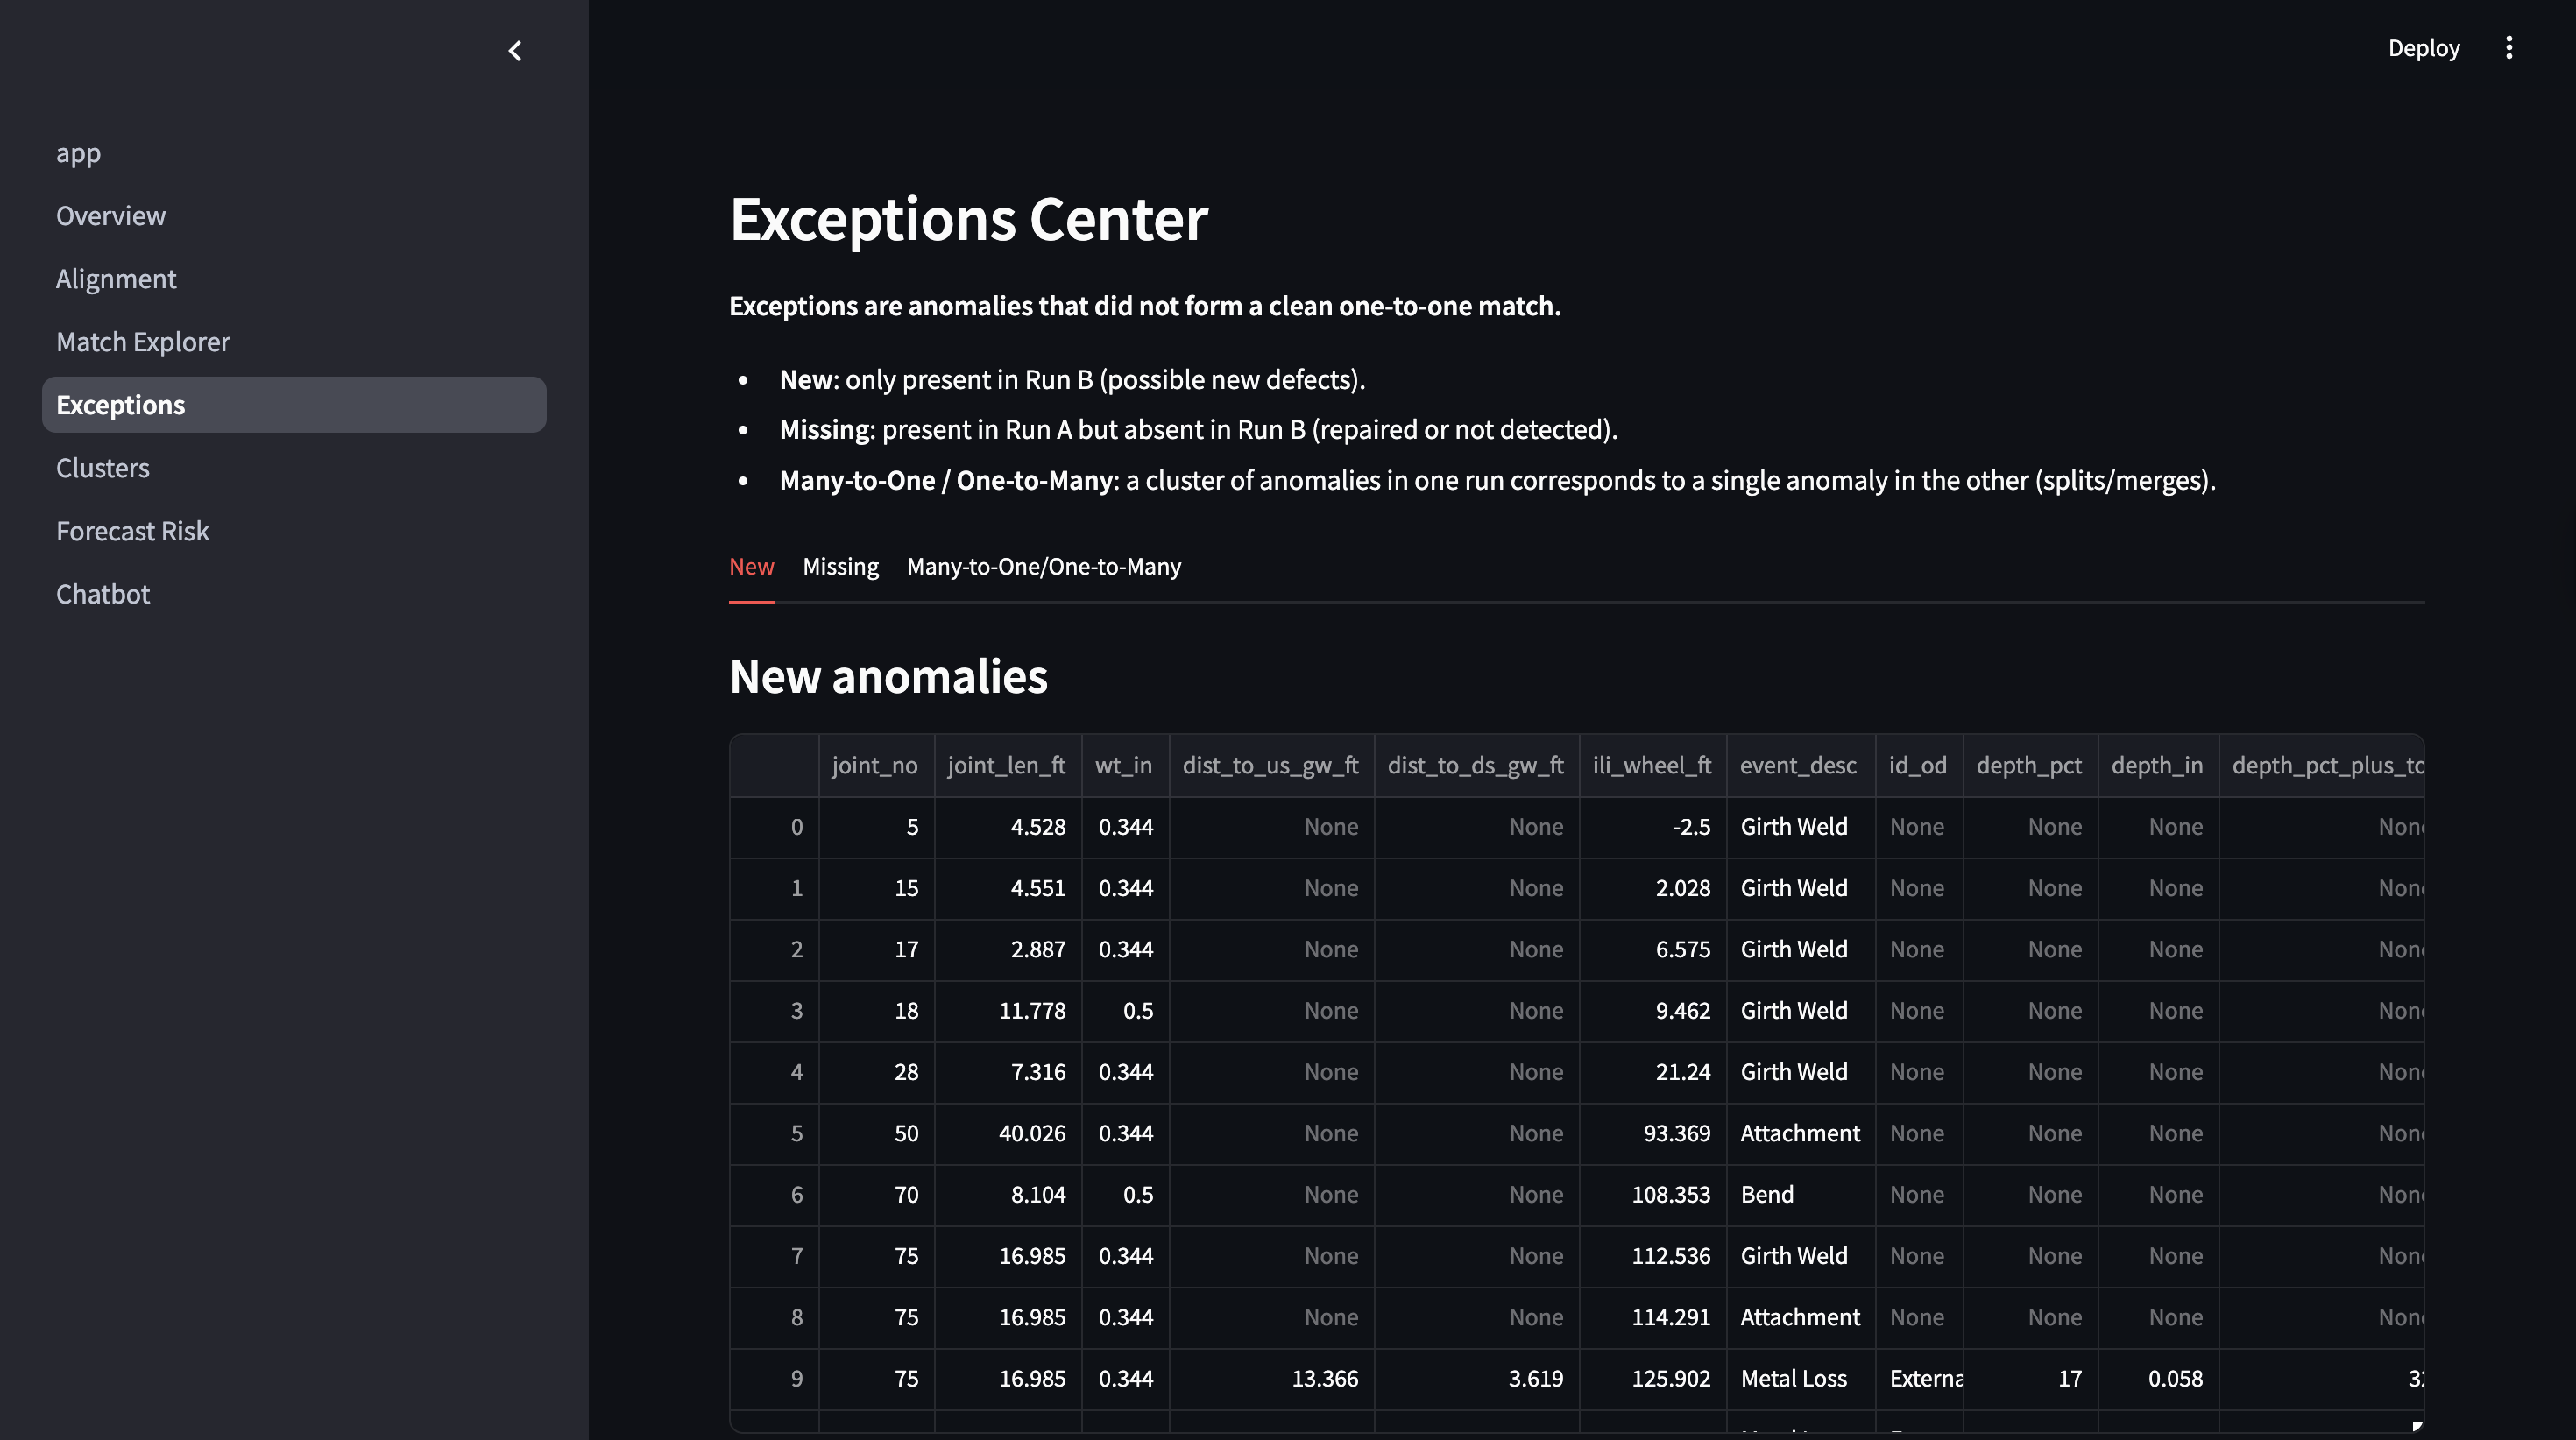
Exceptions Center
-
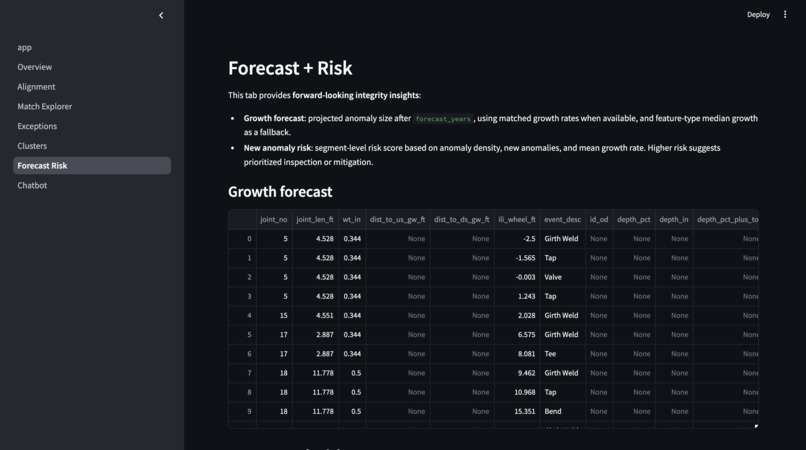
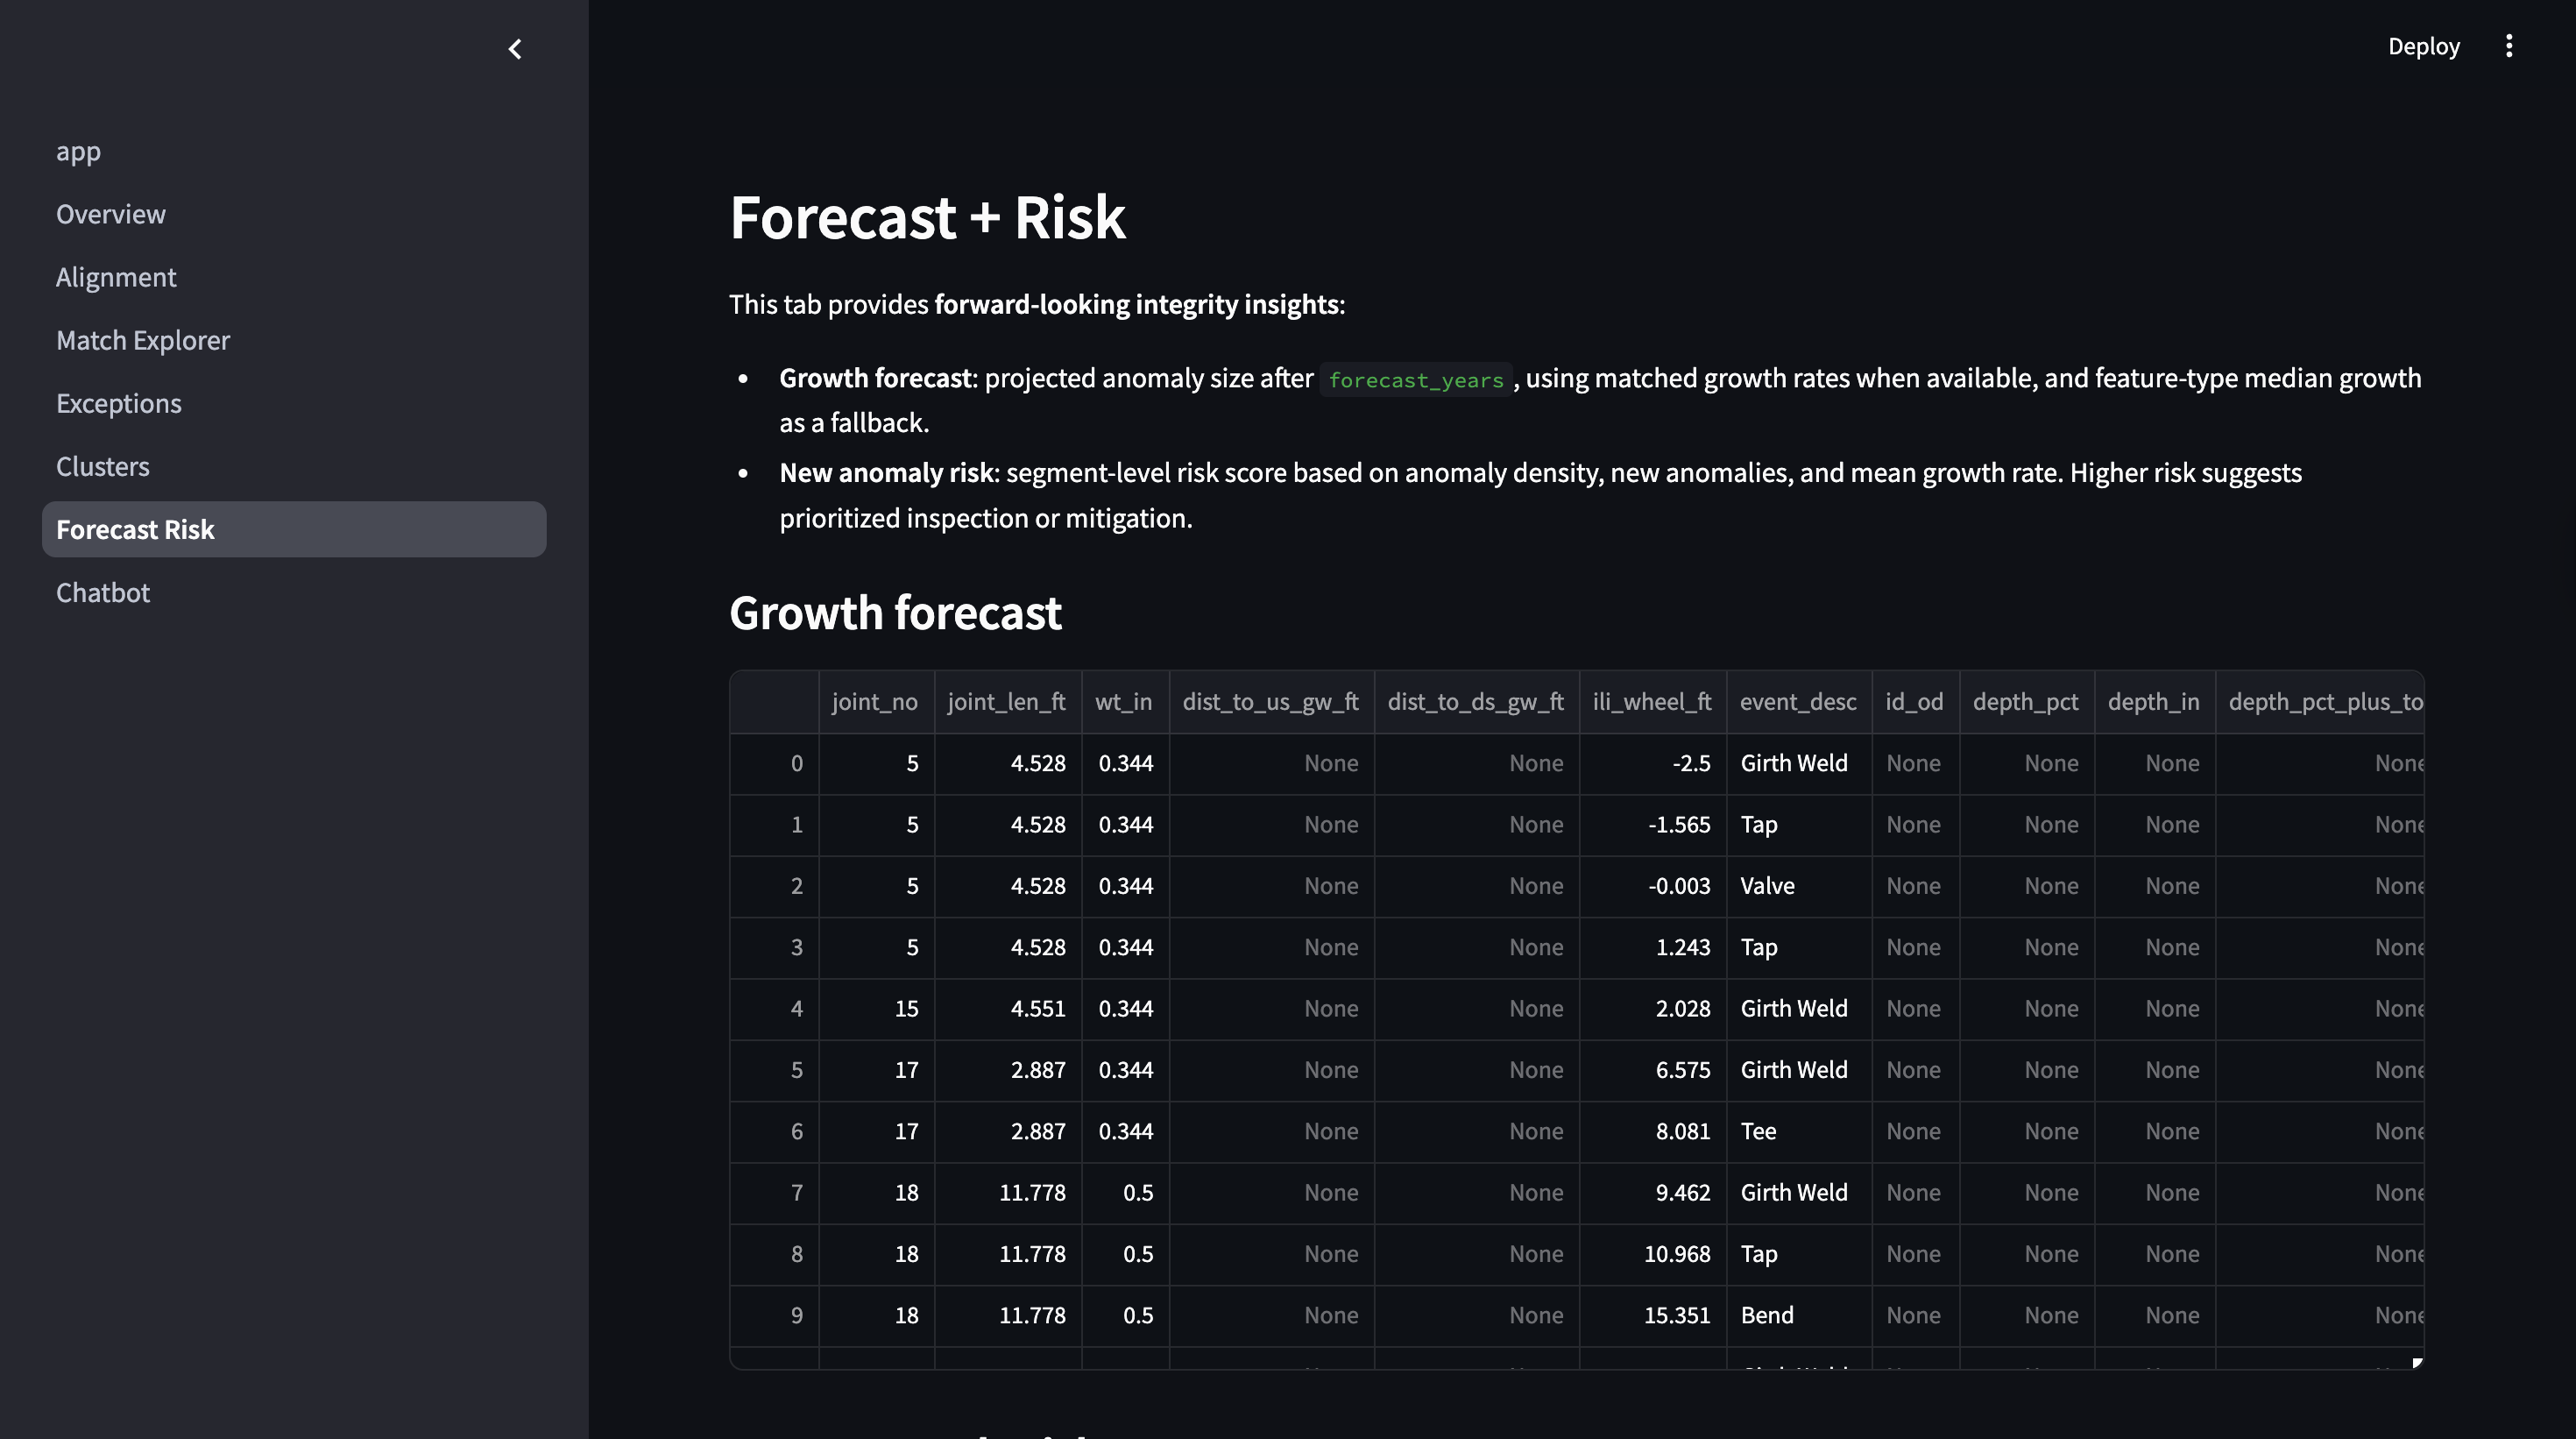
Forecast and Risk
-
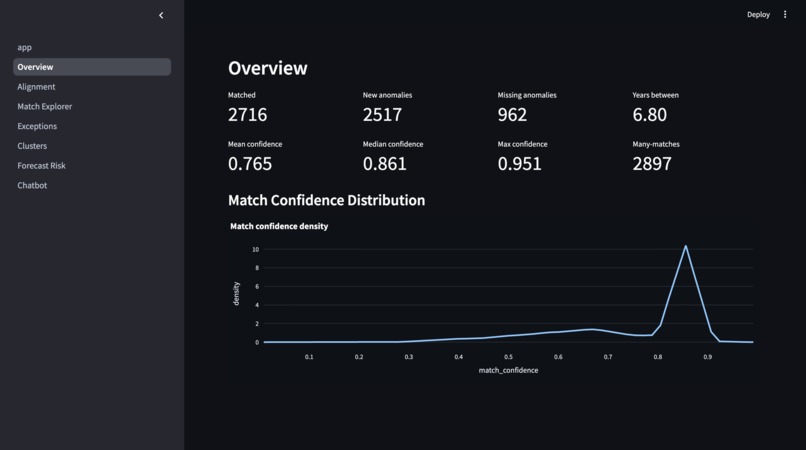
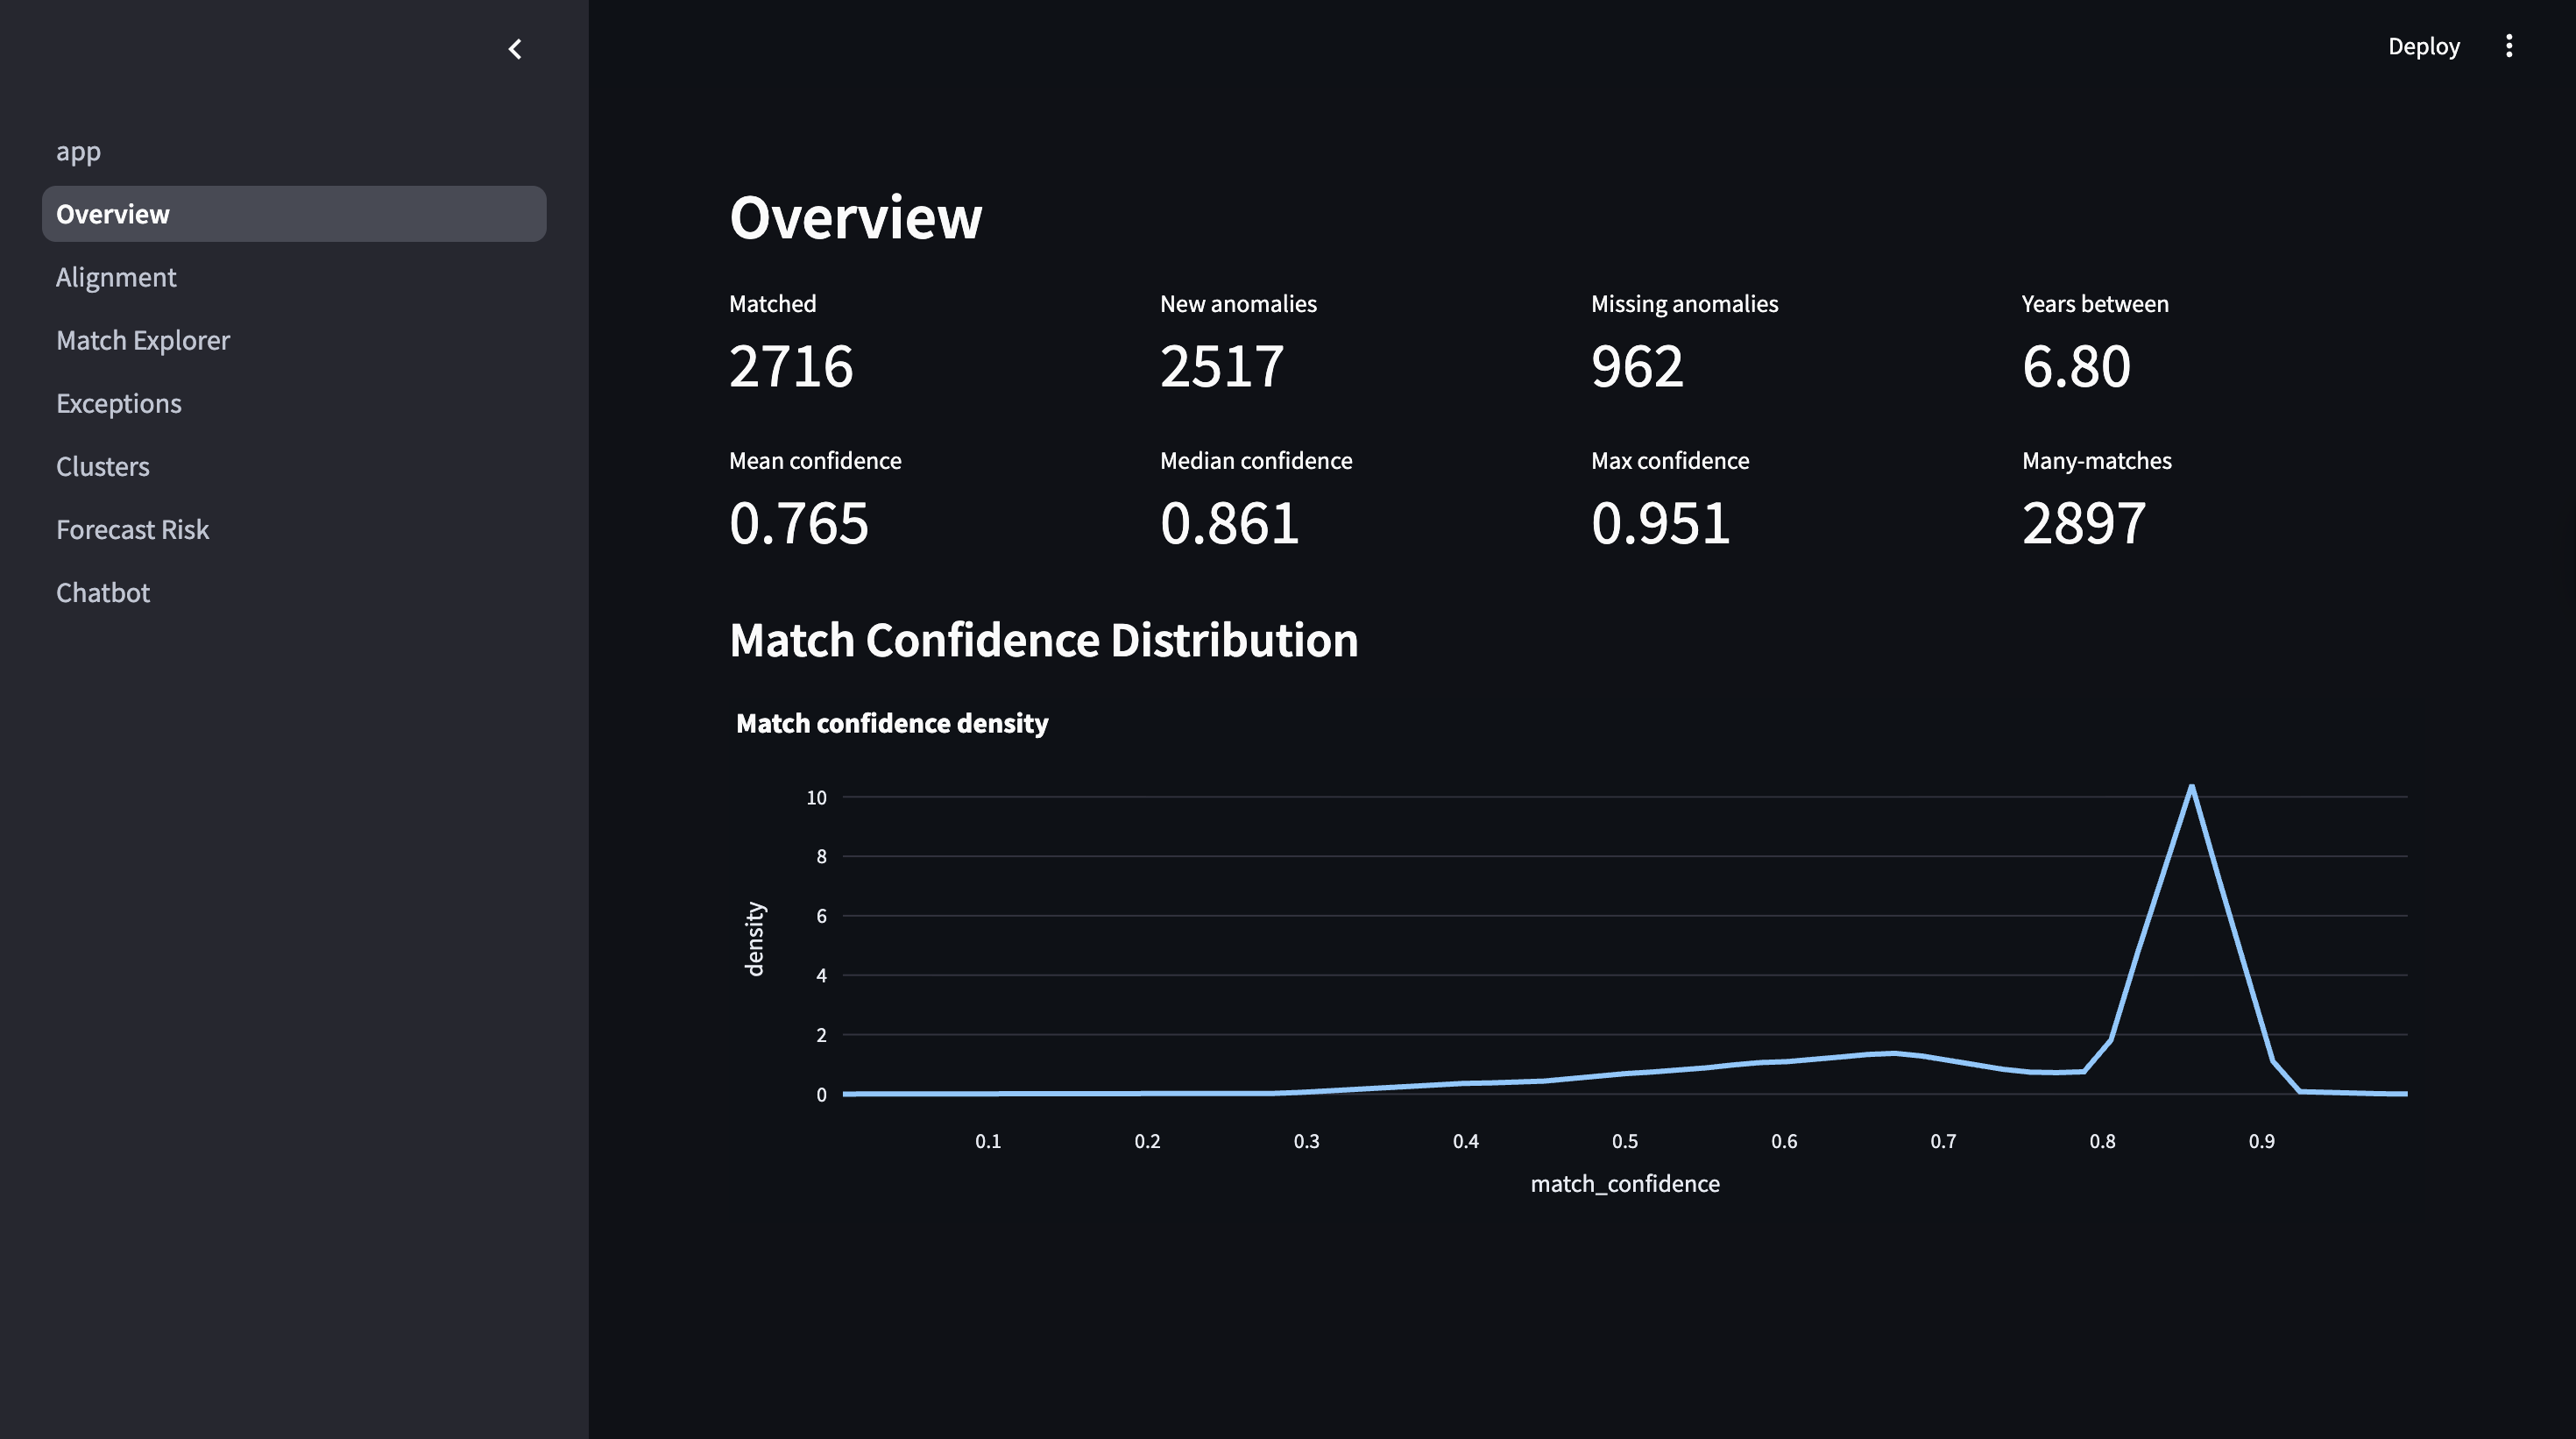
Overview Visualization
-
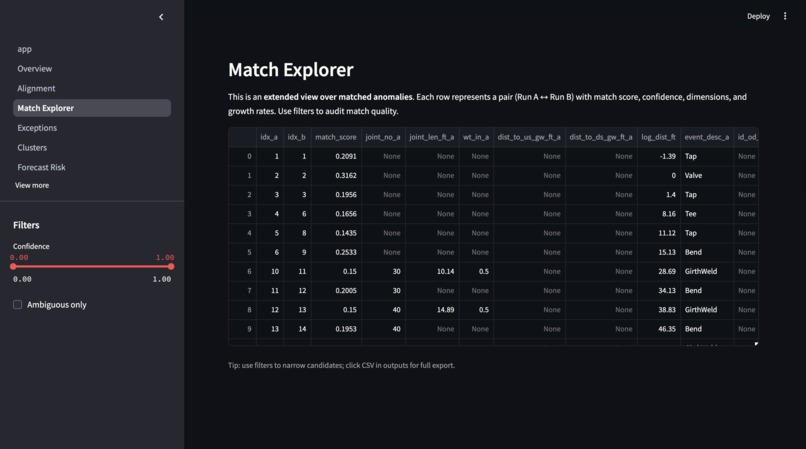
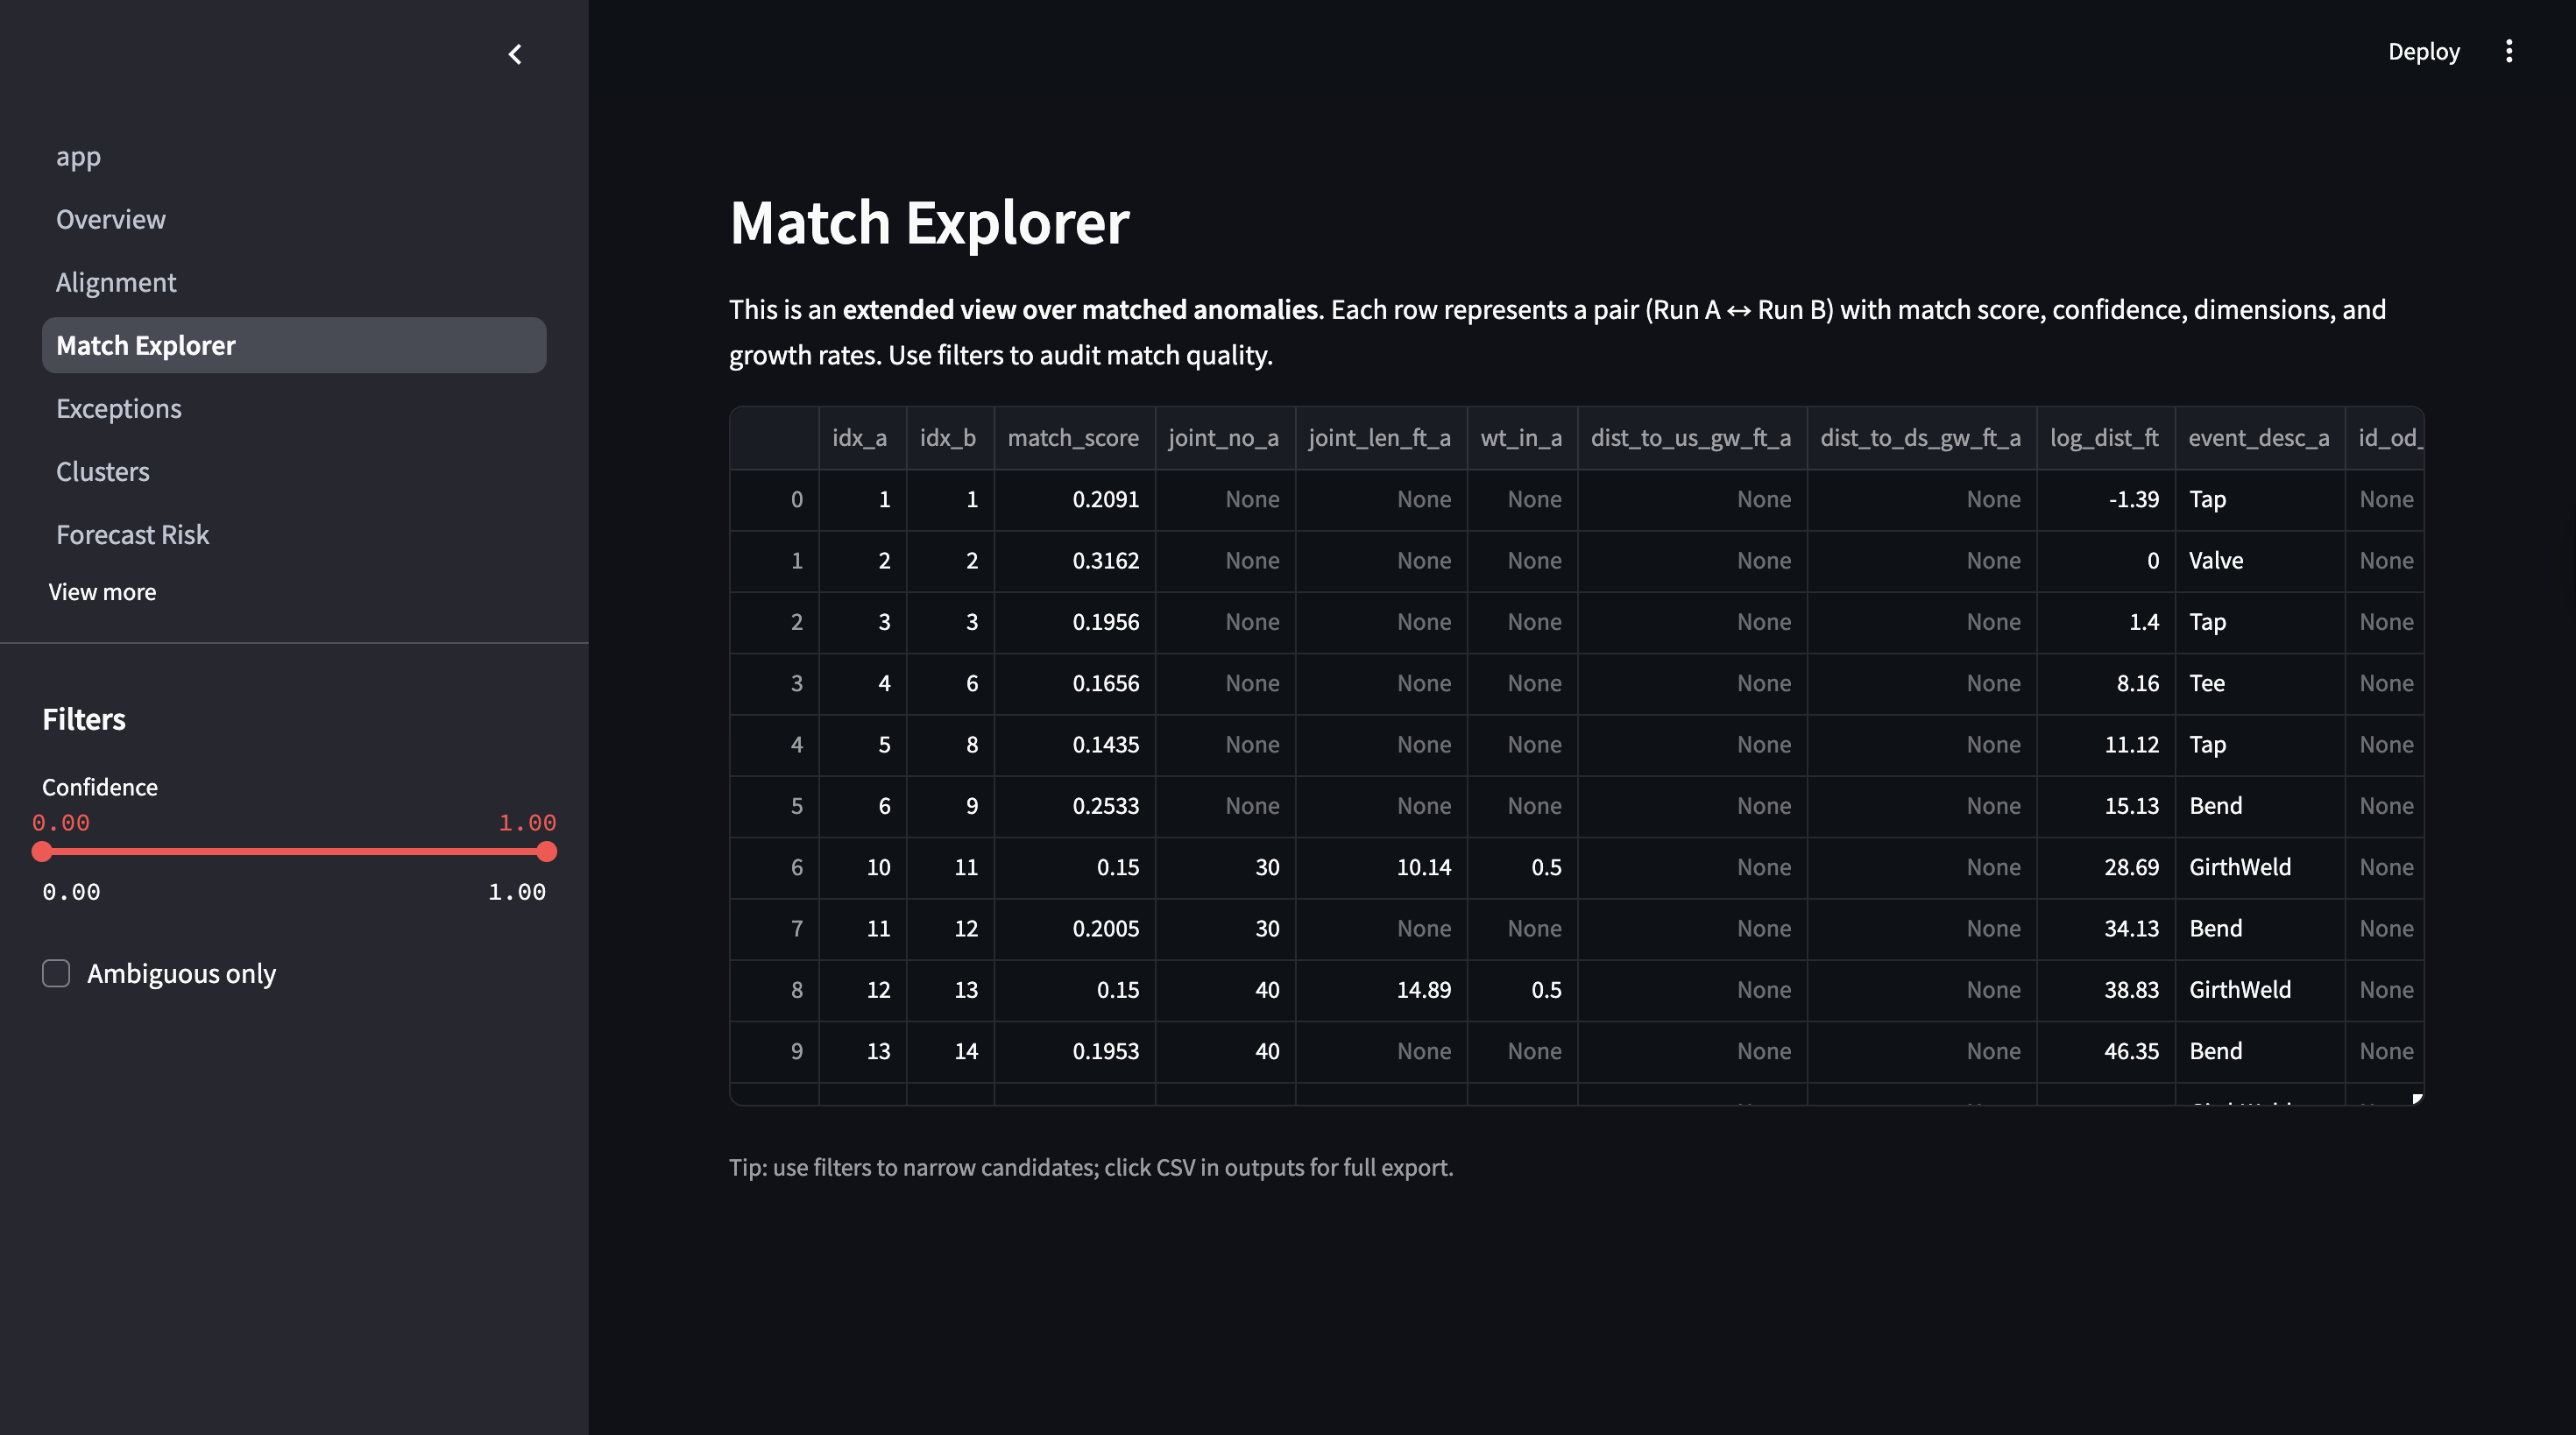
Match Explorer
-
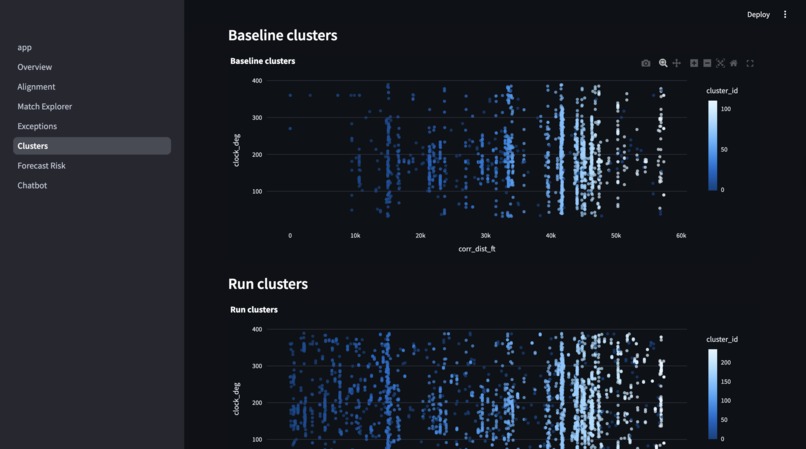
Base and Run Clusters Visualization
-
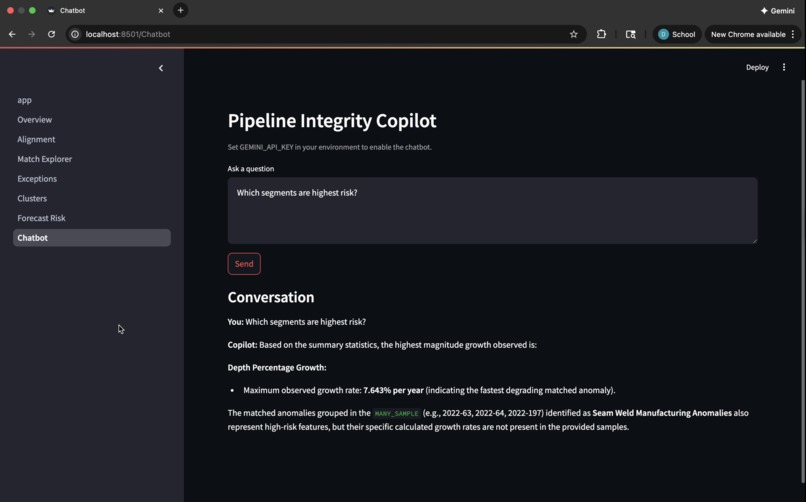
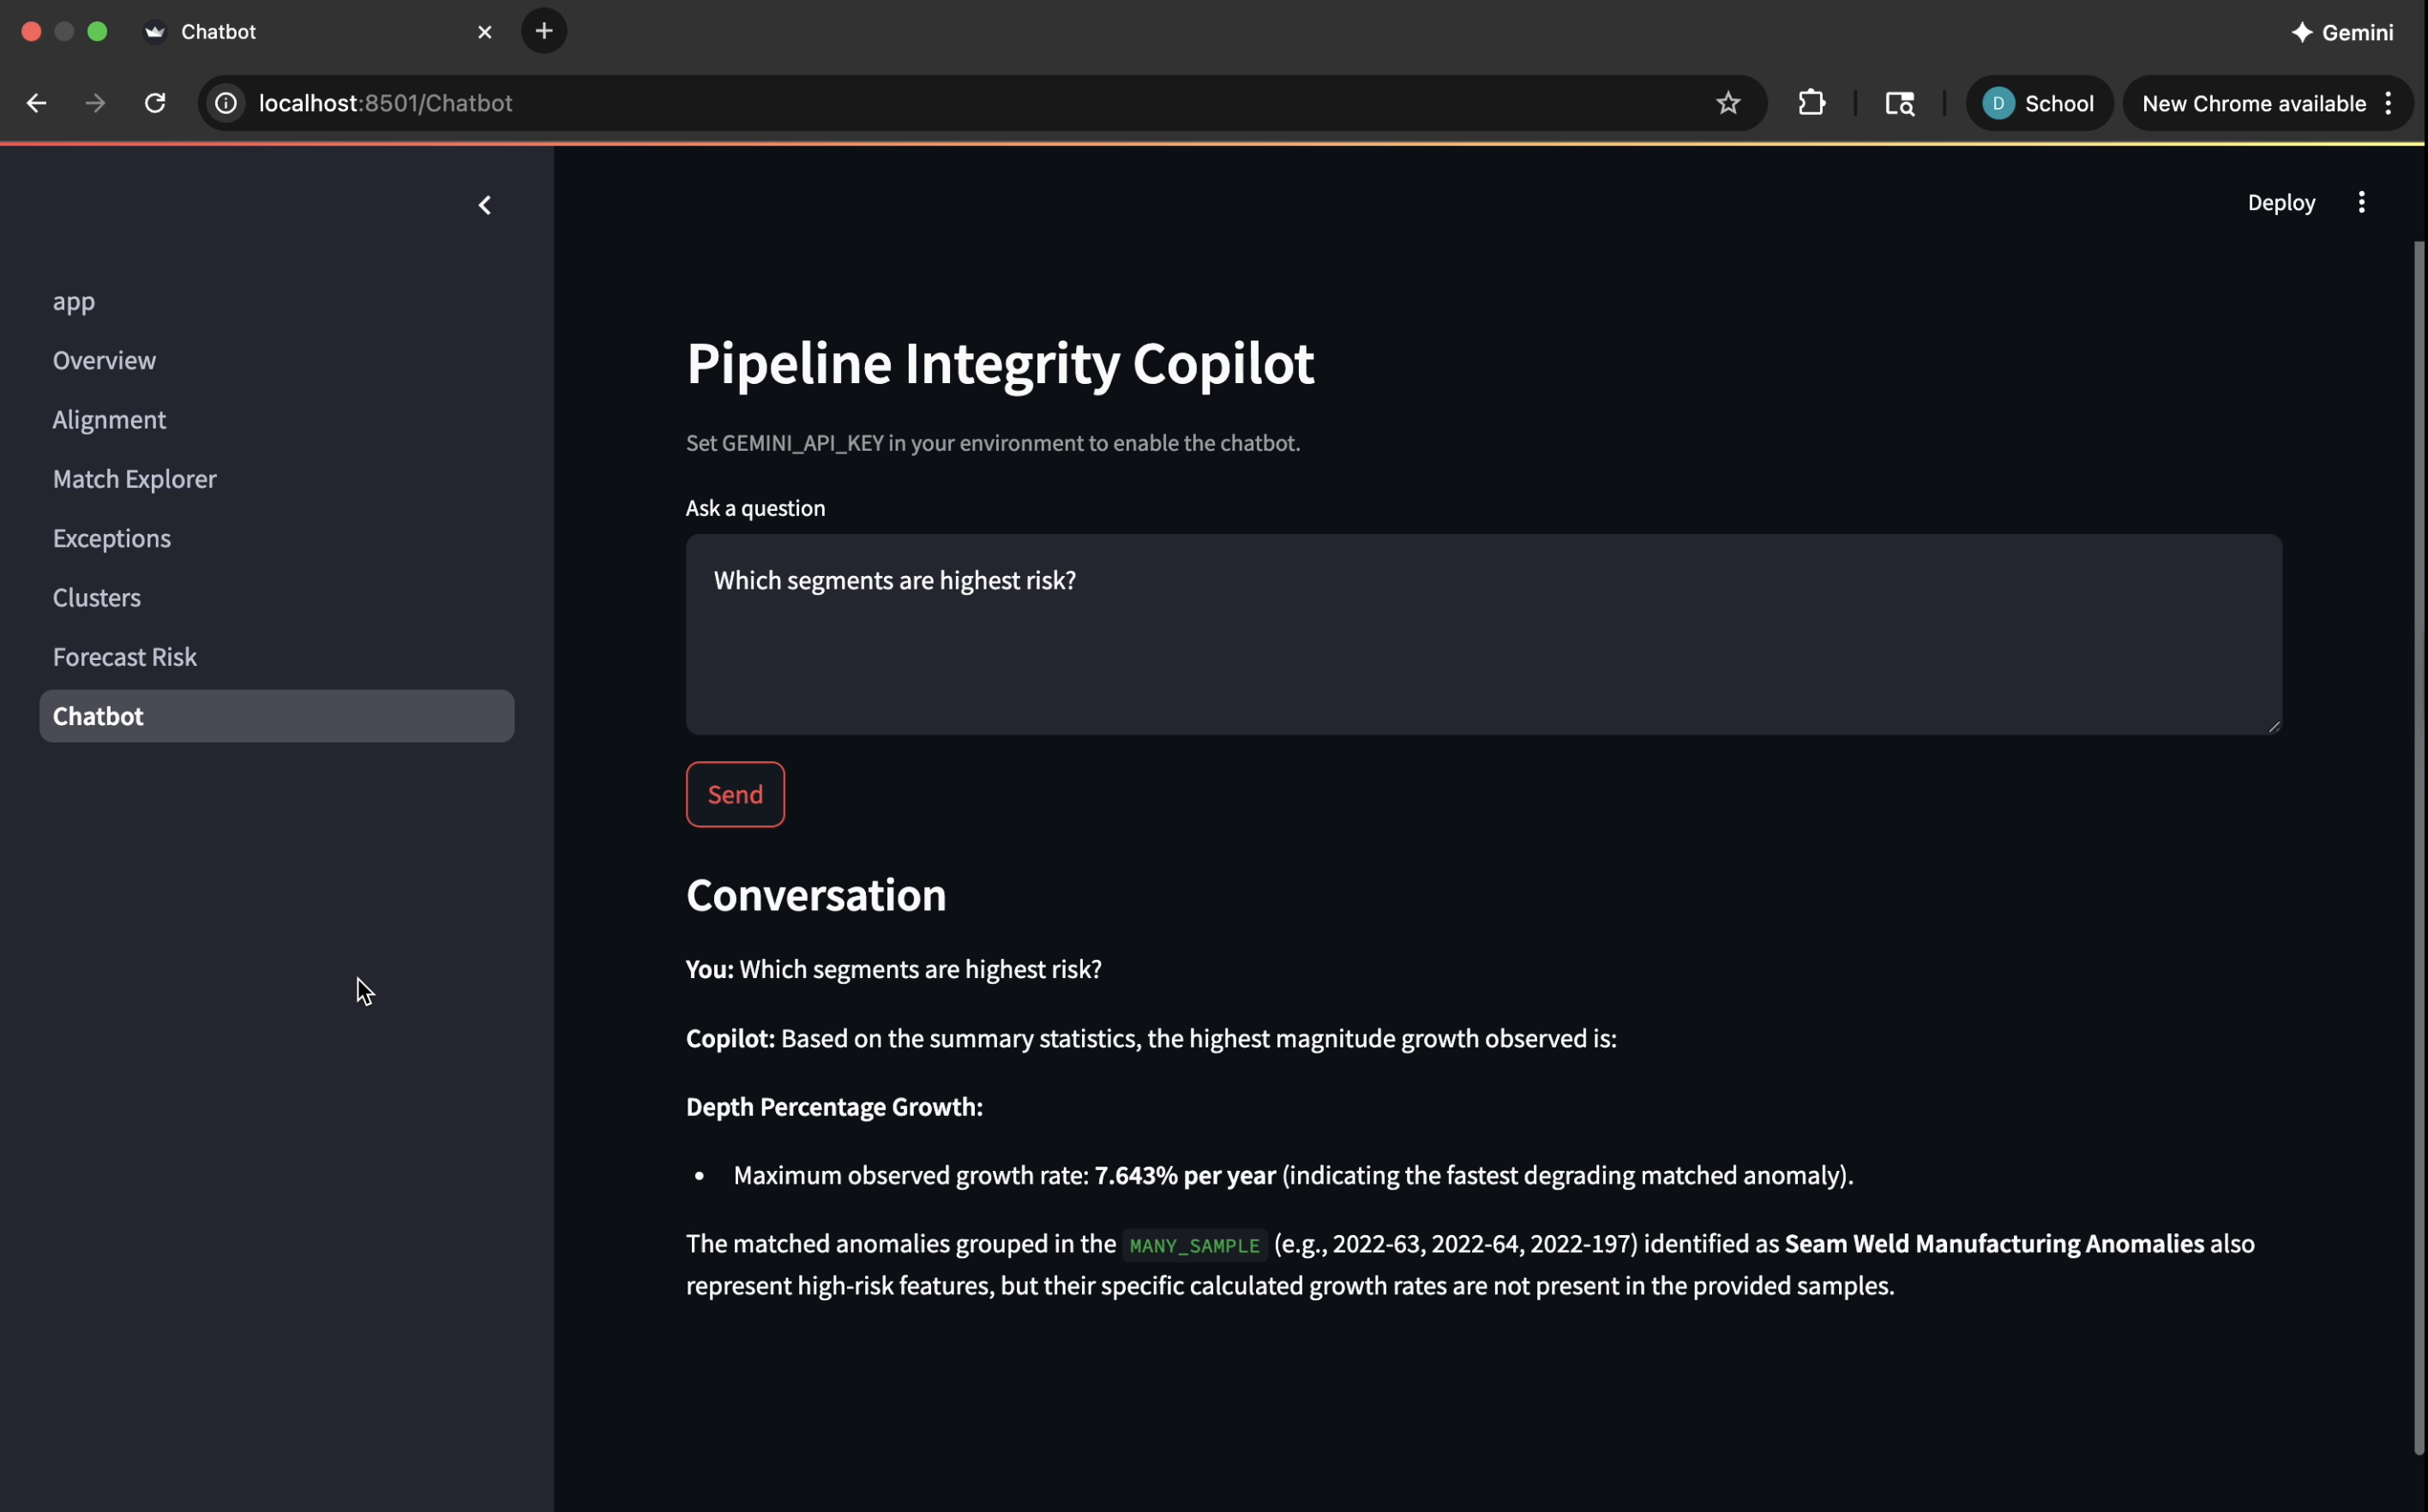
Gemini-powered Chatbot

About the Project
Inspiration
Pipeline integrity is a data-heavy problem. We were inspired by how much time engineers still spend manually aligning ILI runs, and how small misalignments can mask real corrosion growth.
The hackathon challenge was clear: if we could automate alignment and matching, we could make integrity decisions faster, safer, and more defensible.
What We Learned
We learned that alignment is the foundational step since everything downstream depends on it.
We also saw how noisy real ILI data can be:
- Missing clock positions
- Inconsistent feature names
- Vendor-specific formats
These factors make “simple matching” infeasible. Building an explainable pipeline helped us keep trust in the results.
How We Built It
We designed a modular pipeline:
Normalization
- Vendor-specific columns are mapped into a standard schema
- Clock positions are converted to a 0–360° format
- Vendor-specific columns are mapped into a standard schema
Reference Alignment
- Fixed points (girth welds, valves, fittings, casings, AGMs) are matched across runs
- Distances are corrected using these references
- Fixed points (girth welds, valves, fittings, casings, AGMs) are matched across runs
Matching
- Anomalies are paired using:
- Distance
- Clock position
- Feature type
- Dimensional similarity
- Distance
- Matching is solved globally using the Hungarian assignment algorithm
- Anomalies are paired using:
Growth Metrics
- Per-year growth is computed in:
- Depth
- Length
- Width
- Depth
- Per-year growth is computed in:
Exceptions Handling
- Explicit tracking of:
- New anomalies
- Missing anomalies
- Unmatchable anomalies
- New anomalies
- Explicit tracking of:
Stretch Goals
- Clustering (DBSCAN)
- Weakly-supervised ML matching
- Growth forecasting
- Segment-level risk ranking
- Clustering (DBSCAN)
Dashboard
- A Streamlit UI makes every step auditable and explainable
- A Gemini copilot provides fast Q&A over outputs
- A Streamlit UI makes every step auditable and explainable
Technical Highlights (Math)
Growth computation
$$ g_d = \frac{d_2 - d_1}{\Delta t}, \quad g_l = \frac{l_2 - l_1}{\Delta t}, \quad g_w = \frac{w_2 - w_1}{\Delta t} $$
Matching similarity score
$$ S = w_d \cdot \frac{|x_2-x_1|}{\tau_x} + w_c \cdot \frac{|c_2-c_1|}{\tau_c} + w_\ell \cdot \frac{|l_2-l_1|}{\tau_\ell} + w_w \cdot \frac{|w_2-w_1|}{\tau_w} $$
Lower (S) indicates a better match.
Risk scoring by segment
$$ \text{Risk} = z(\text{total anomalies}) + z(\text{new anomalies}) + z(\text{mean growth}) $$
Challenges We Faced
Missing values
Many anomalies lacked clock or dimension data. We had to allow distance-only matching while still penalizing missing fields.
Alignment sensitivity
Small reference errors can cascade into mismatches. We built:
- Linear alignment
- DTW alignment
- Hybrid alignment modes
No labeled data
Without expert matches, we used weak supervision to bootstrap ML matching.
What We’re Proud Of
We turned raw ILI data into a complete integrity workflow:
- Alignment
- Matching
- Growth analysis
- Clustering
- Forecasting
- Risk scoring
All while keeping the system auditable, explainable, and practical for real-world use.

Log in or sign up for Devpost to join the conversation.