Inspiration
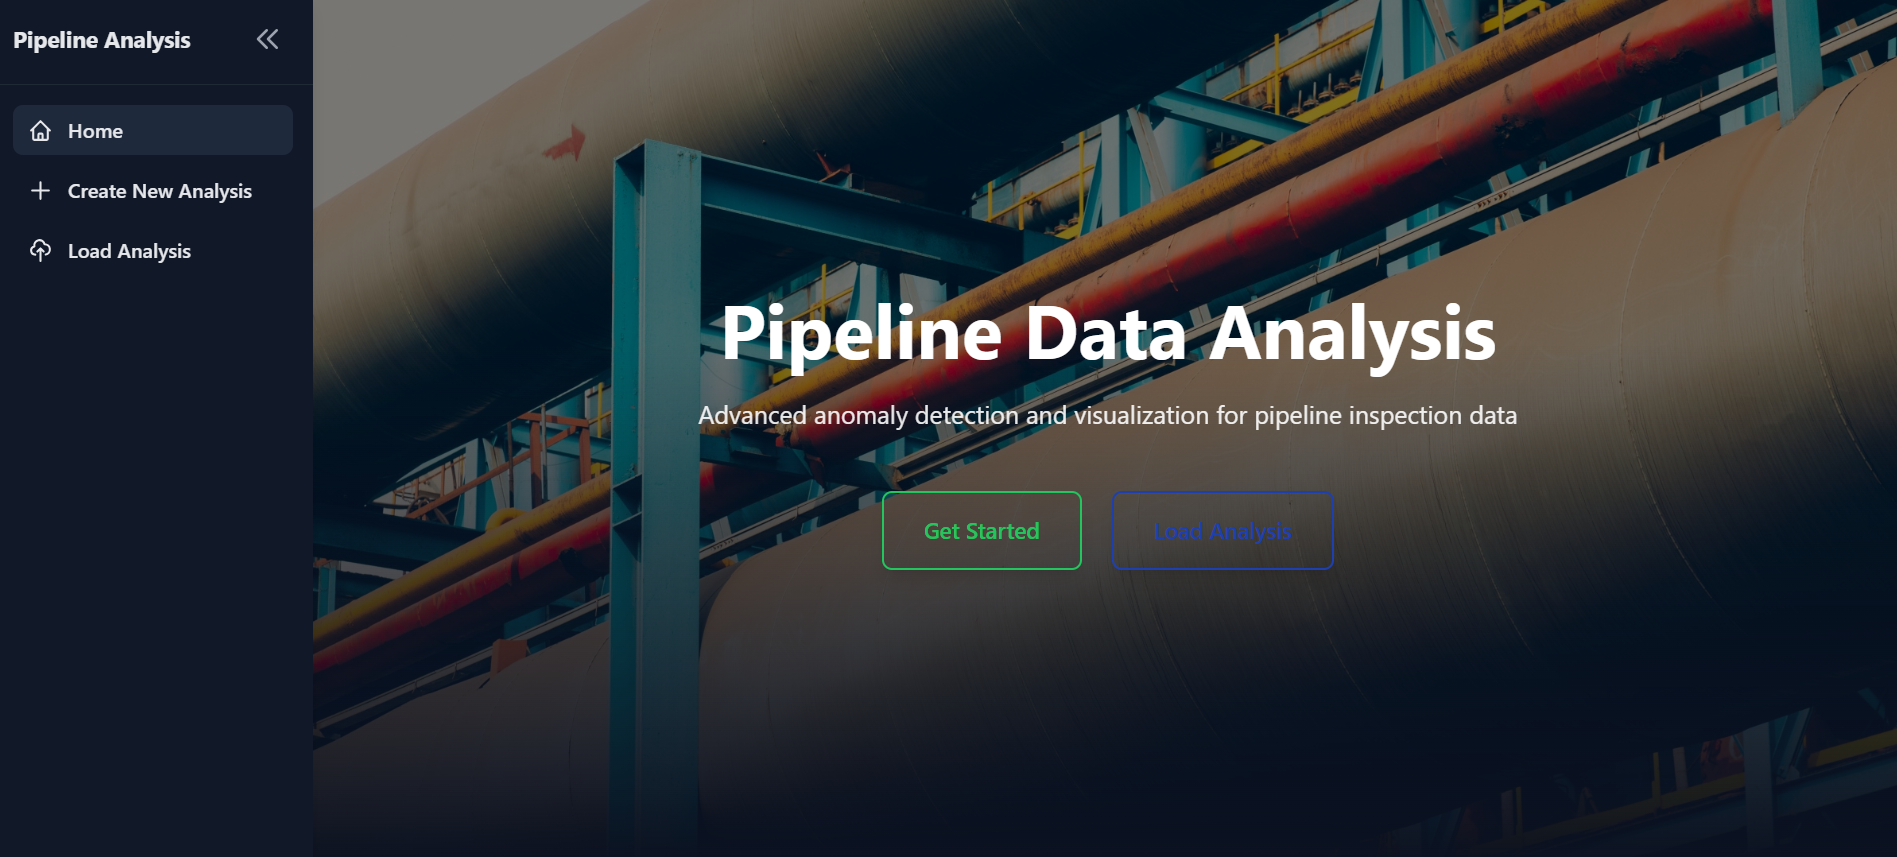
In-Line Inspection (ILI) tools are used to detecting anomalies in oil pipelines. However, data is inconsistently formatted across different ILI devices across different years. Currently, engineers perform tedious and manual data analysis across thousands of data entries.
What it does
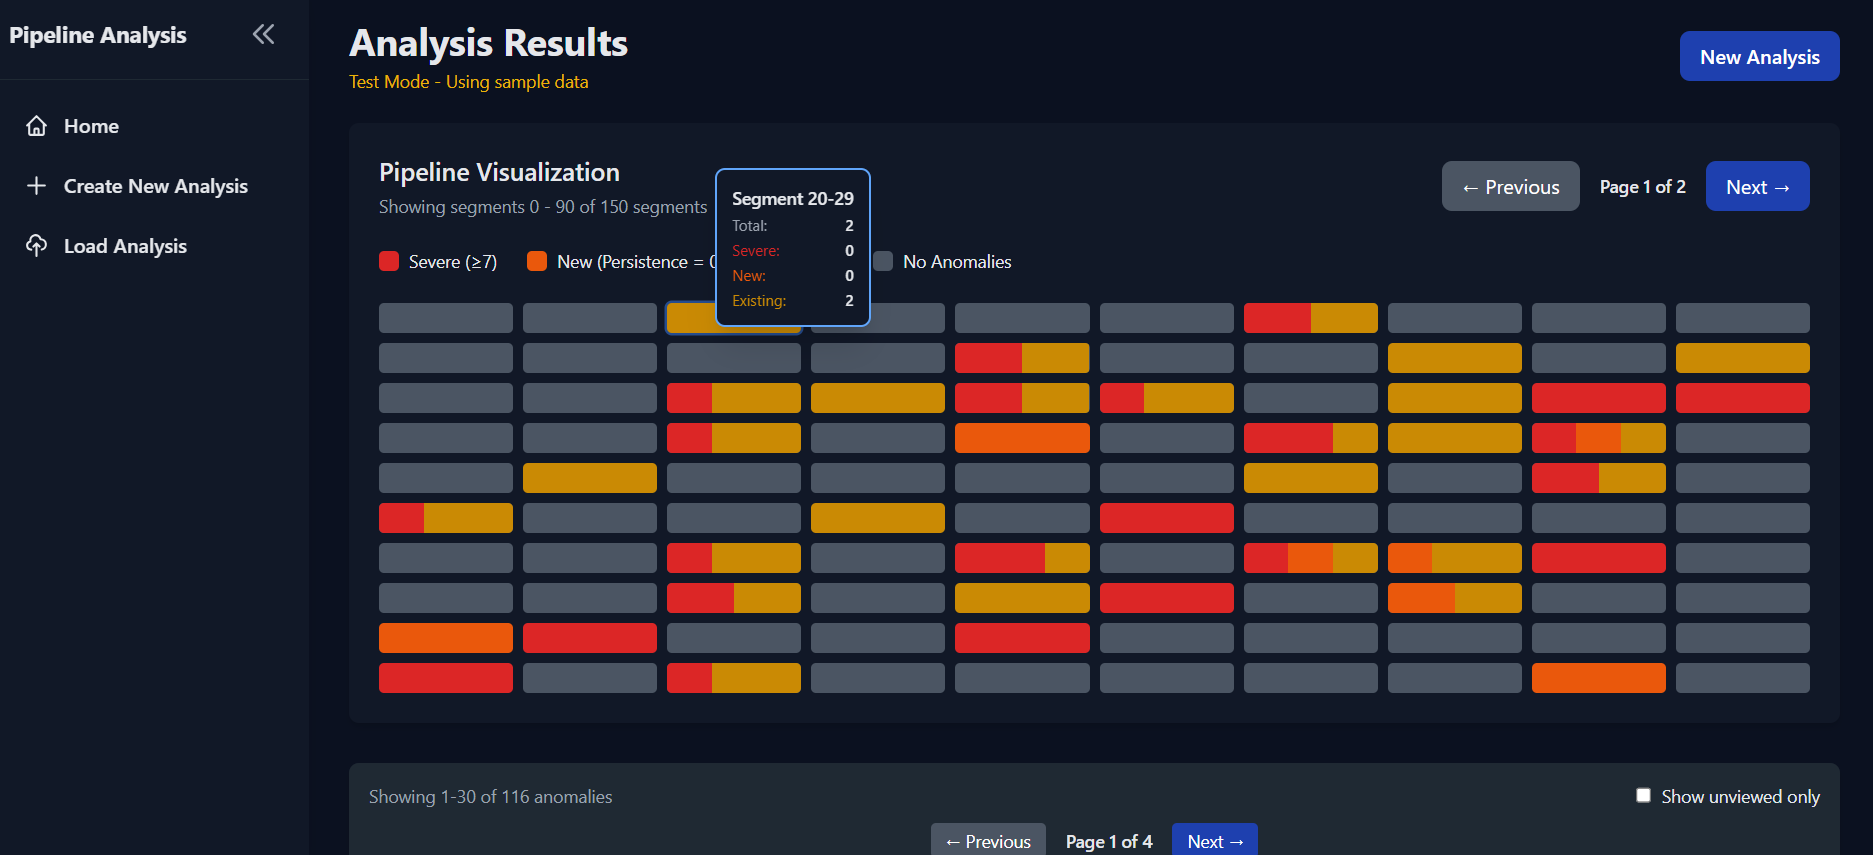
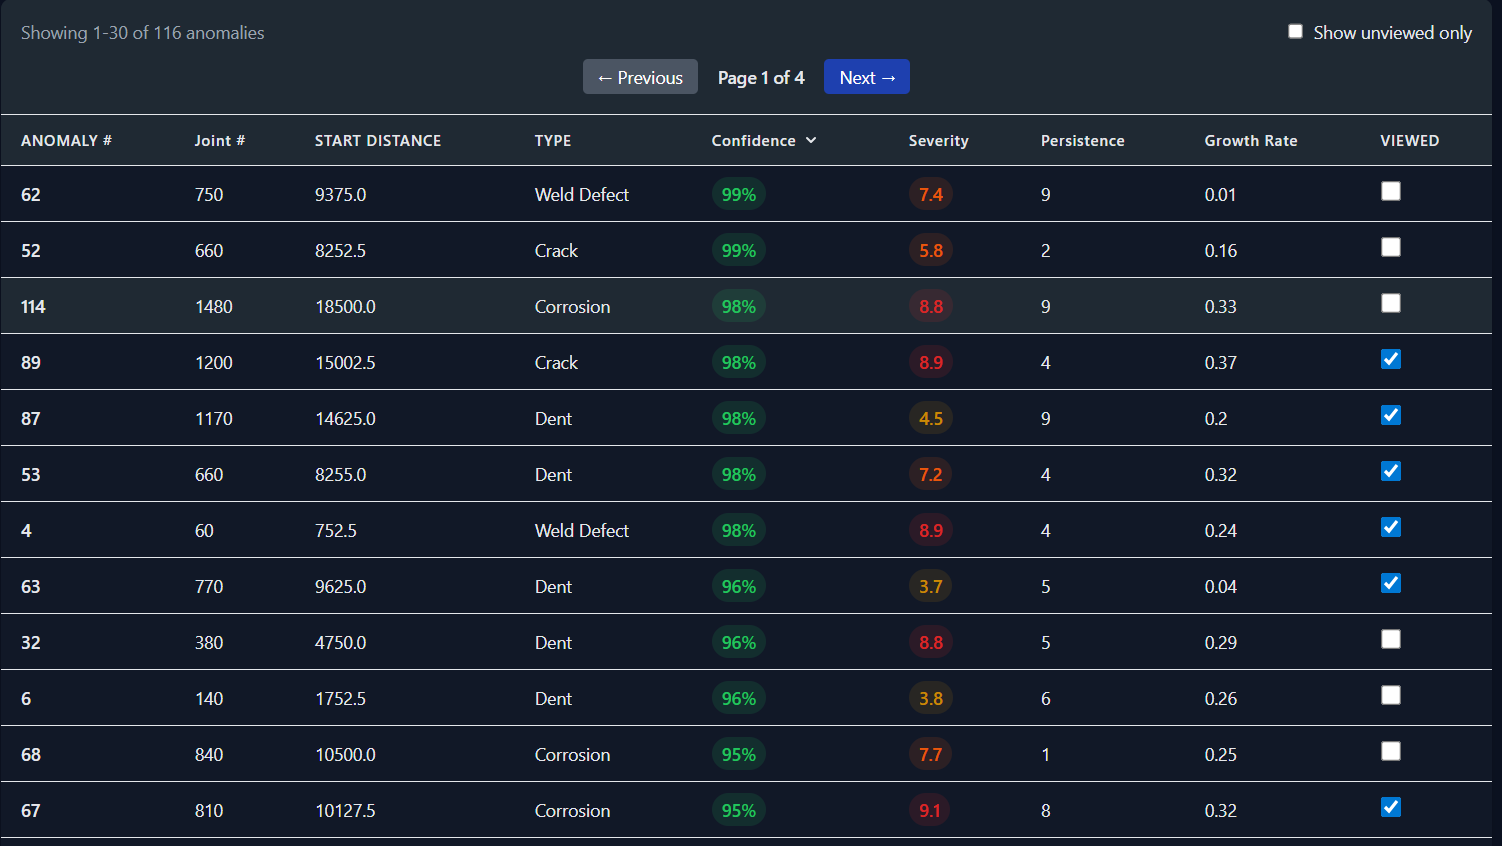
Oil pipelines face drift across various years, and are suspect to corrosion and dents. The historical anomaly data is aligned across different years using Dynamic Time Warping (DTW) algorithms, and individual anomalies are analyzed for persistence, growth, and severity.
How we built it
React.JS was used alongside a Python back-end that utilized Pandas for data analysis. This was essential for processing thousands of lines of data to process anomalies.
Challenges we ran into
Having different pieces of modular software interact with each other was challenging for integration. The system as a whole formats data, aligns data, and then finally computes statistical metrics.
Accomplishments that we're proud of
This project was built to tackle a real-world situation. By easing the process of detecting corrosion and dents, the long-term health of pipelines can be maintained.
What we learned
Data analysis with Python and integrating it with web development technologies.
What's next for RCP ILI Business Case
Software modularization and optimization.

Log in or sign up for Devpost to join the conversation.